- Data extracted in February 2017. Most recent data: Further Eurostat information, Main tables and Database. Planned article update: September 2018.
Maps can be explored interactively using Eurostat’s Statistical Atlas (see user manual).

(%)
Source: Eurostat (ilc_lvho01) and (demo_gind)

(million)
Source: Eurostat (ilc_pees01)

(%)
Source: Eurostat (ilc_peps13)
(%)
Source: Eurostat (ilc_peps13), (ilc_li43), (ilc_mddd23) and (ilc_lvhl23)
(% of total population)
Source: Eurostat (ilc_lvho01)

(%)
Source: Eurostat (ilc_lvho07d)
(%)
Source: Eurostat (hlth_silc_21)

(%)
Source: Eurostat (edat_lfs_9913)

(%)
Source: Eurostat (edat_lfse_29)
(%)
Source: Eurostat (lfst_r_ergau)
(%)
Source: Eurostat (lfst_r_urgau)
(% of all individuals)
Source: Eurostat (isoc_ci_ifp_fu)
This article forms part of Eurostat’s annual flagship publication, the Eurostat regional yearbook. It assesses differences between people living in rural areas and those living in urban areas, based on an analysis by degree of urbanisation and covers the following subjects: poverty and social exclusion, housing, health, education, the labour market and the digital divide.
The previous chapter of this online publication focused on the growing share of the European Union (EU’s) population that lives and works in and around cities and concentrated on sustainability issues linked to these developments. That said, there are a number of real and perceived advantages which may attract people to live in (some) rural areas: lower housing and living costs, more space, a better social fabric, less pollution, closer proximity to nature, or a less stressful lifestyle. These advantages can be juxtaposed against a range of (potential) drawbacks, for example: fewer local education or job opportunities/choices; difficulties in accessing public services or transport services; or a lack of cultural/social venues for leisure activities requiring infrastructure.
Main statistical findings
- Lithuania was the only EU Member State where a majority (56.2 %) of the population in 2015 was living in a rural area (see Figure 1); in Luxembourg, Slovenia, Latvia and Hungary a relatively high share of the total number of inhabitants also lived in rural areas.
- At least half of the rural population in Bulgaria, Romania and Malta was at risk of poverty or social exclusion in 2015; most of the Member States that joined the EU in 2004 or more recently recorded a higher risk of poverty or social exclusion among their rural populations than in cities or in towns or suburbs.
- In 2015, almost one quarter (22.8 %) of the EU-28 population was living in a house in a rural area; for comparison, a slightly higher share (24.7 %) of the EU-28 population was living in a flat in a city.
- Among people aged 30 to 34, just over one quarter (27.9 %) of the EU-28 population that was living in a rural area had a tertiary level of educational attainment in 2015; this share rose to one third (33.4 %) for people living in towns or suburbs, and peaked at almost half (48.1 %) among those living in cities.
- The EU-28 unemployment rate in rural areas was 9.1 % in 2015, which was somewhat lower than the rate in cities (10.0 %); rural areas in Austria, Germany and the United Kingdom were characterised by very low unemployment rates (less than 4.0 %).
Population distribution by degree of urbanisation
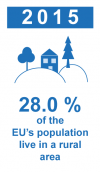
Just over one quarter (28.0 %) of the EU-28 population lived in a rural area in 2015, with a somewhat higher share living in towns and suburbs (31.6 %), while the biggest share of the EU-28 population lived in cities (40.4 %). During the five-year period from 2010 to 2015, there was a gradual increase in the number of people living in rural areas across the EU-28, their relative share of the total number of inhabitants rising by 1.7 percentage points; the increase in the share of the population living in towns and suburbs was even greater (rising by 4.7 points), while the share of people living in cities declined at a relatively rapid pace; these patterns possibly reflect Europeans leaving inner city areas in search of more (affordable) space, in suburbia, towns, or the countryside.
Lithuania was the only EU Member State where a majority of the population lived in rural areas
There were considerable differences between the EU Member States concerning the relative size of their rural populations: Lithuania was the only country where a majority (56.2 %) of the population lived in a rural area (see Figure 1), while 45–49 % of the total number of inhabitants lived in a rural area in Denmark, Croatia, Latvia, Hungary, Slovenia and Luxembourg. By contrast, a relatively low share of the total population lived in rural areas in several of the most populous Member States, including Germany (22.4 %), Italy (18.9 %), Belgium (18.0 %), the United Kingdom (14.9 %) and the Netherlands (14.7 %). Malta recorded a much lower share (0.3 %) of its population living in rural areas, with the vast majority of its inhabitants living in the metropolitan area in and around the capital city of Valletta. Indeed, almost 9 out of every 10 inhabitants in Malta lived in a city; the United Kingdom and Spain were the only other Member States where a majority of the population lived in cities. It is useful to consider these distributions by degree of urbanisation when analysing the remainder of the results presented in this article; most notably, little weight should be accorded to the results for rural areas in Malta, given they represent just 0.3 % of the Maltese population.
A more detailed picture of population distributions by degree of urbanisation is provided in the introductory chapter (see Map 1), which presents information for local administrative units level 2 (LAU2). This confirms the patterns noted above, insofar as most of the eastern territorial regions of the EU and the Baltic Member States were characterised by relatively large rural populations, whereas population density was more pronounced in Belgium, the Netherlands, North Rhine-Westphalia (Germany), Malta, coastal Italy and Portugal, as well as southern Spain, central and southern parts of the United Kingdom.
Risk of poverty and social exclusion
The number of people at risk of poverty or social exclusion is one of five headline targets for monitoring the Europe 2020 strategy, which set the goal for the EU to become a ‘smart, sustainable and inclusive economy’, among others by reducing the number of people at risk of poverty or social exclusion by at least 20 million. The same indicator is also used to within the sustainable development goals (SDGs) and furthermore forms 1 of the 14 headline indicators used in Eurostat’s scoreboard to track the progress being made in relation to the European Pillar of Social Rights, which aims to build a more inclusive and fairer EU.
Those people who are at risk of poverty or social exclusion are in at least one of the following three situations: at risk of (monetary) poverty; severely materially deprived; living in a household with very low work intensity. Figure 2 presents an overview for the number of people at risk of poverty or social exclusion in the EU-28. In 2015, there were 118.8 million Europeans classified as being exposed to at least one of the three types of risk, with 9.2 million facing all three of these risks.
The risk of (monetary) poverty was the most commonly faced risk within the EU-28 population as it affected a total of 86.6 million inhabitants — either in isolation or in combination with one or both of the other risks. In this context, the rate of people at-risk-of- poverty is defined as a relative concept, based on the share of the population living below the poverty threshold (itself defined as 60 % of the median equivalised disposable income, after social transfers; a measure which takes account of the age of each household member). The poverty threshold is set independently in each of the EU Member States and it is important to note that the risk of poverty reflects the distribution of wealth, whether or not incomes are shared equitably/uniformly across society, irrespective of average income levels.
Almost one in four (23.7 %) of the EU-28 population was at risk of poverty or social exclusion
A higher proportion of the EU-28 population living in rural areas (compared with urban areas) faced the risk of poverty or social exclusion. In 2015, just over one quarter (25.5 %) of the rural population was at risk of poverty or social exclusion, while lower shares were recorded for people living in cities (24.0 %) and especially those living in towns and suburbs (22.1 %), perhaps explaining, at least in part, the movement towards towns and suburbs.
The risk of poverty or social exclusion was highest in the rural areas of several eastern and southern EU Member States
A closer examination reveals that in a small majority (15) of the EU Member States, the highest proportion of people at risk of poverty or social exclusion was recorded in rural areas (see Figure 3). This was particularly the case in Bulgaria, Romania and Malta, where at least half of the rural population was at risk of poverty or social exclusion in 2015. There were nine additional Member States where the share of the rural population at risk of poverty or social exclusion was higher than the share recorded for the urban population and was also situated within the range of 30.0–40.0 %; six of these were Member States that joined the EU in 2004 or more recently (Latvia, Croatia, Lithuania, Cyprus, Hungary and Poland), while the other three were located in southern Europe (Greece, Spain and Portugal).
In Romania (and Malta), people living in rural areas were at least twice as likely as those living in cities to face the risk of poverty or social exclusion, with somewhat less pronounced differences recorded in Croatia, Poland and Bulgaria. By contrast, the rural populations of Austria, the Netherlands, Belgium, Denmark, Germany and the United Kingdom were much less likely to be at risk of poverty or social exclusion than those living in urban areas (particularly those living in cities). It is also interesting to note that there was a fairly uniform distribution across the territories of Finland, Slovenia, the Czech Republic, Italy, Ireland (2014 data) and Sweden, insofar as they each recorded a narrow range when analysing the share of people who were at risk of poverty or social exclusion by degree of urbanisation.
There was a marked geographical split when analysing information by EU Member State: on the one hand, the highest risk of poverty or social exclusion for many of the eastern, southern and Baltic Member States was usually recorded within rural populations; by contrast, the highest risk of poverty or social exclusion in most of the western and northern Member States was usually recorded for people living in cities. Indeed, while cities in the eastern part of the EU were often characterised by recent economic growth and lower risks of poverty or social exclusion, in western Europe they often displayed an urban paradox insofar as they had higher levels of wealth creation, but at the same time relatively high shares of their populations were living with the risk of poverty or social exclusion, suggesting they were characterised by relatively high degrees of income inequality.
Almost one in five of the EU’s rural population was living at risk of poverty
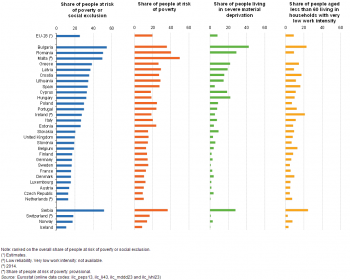
Figure 4 analyses the information relating to the risk of poverty and social exclusion in more detail and focuses exclusively on rural areas. In 2015, almost one in five (19.8 %) inhabitants living in EU-28 rural areas was at risk of (monetary) poverty, compared with 9.1 % of the rural population that was aged less than 60 and living in a household with very low work intensity, and 8.3 % of the rural population that was living in severe material deprivation.
Across the EU Member States, the risk of monetary poverty among those living in rural areas peaked in 2015 at half (50.0 %) of the very small rural population in Malta. Apart from this particular case, relatively high shares of the rural populations in Romania (40.4 %) and Bulgaria (35.8 %) also faced the risk of monetary poverty. At the other end of the range, the risk was considerably lower for the rural population of the Czech Republic (9.1 %) and was also relatively low (in the range of 10–11 %) for the rural populations of the Netherlands, Austria and Denmark.
Less than 10 % of the EU’s rural population was living in a household with very low work intensity
Work intensity is defined as the ratio of the total number of months that all working-age (18–59 years) household members have worked during the income reference year and the total number of months the same household members theoretically could have worked in the same period. Very low work intensity is defined as a ratio of less than 0.2, in other words, households where working-age adults worked less than one fifth of their potential labour input during the reference period.
The share of people living in households with very low work intensity peaked at 23.0 % for the rural population of Bulgaria, while more than one in five persons (21.2 %; 2014 data) who were living in the rural areas of Ireland also faced this risk. By contrast, less than 5.0 % of the rural population in the Czech Republic and in Sweden lived in households with very low work intensity. These figures may reflect, among others, the incidence of small-scale subsistence farms, labour market conditions, social security systems and the composition of households — for example, single person households (especially those with dependent children) are more likely to be characterised by very low work intensity than households composed of two or more adults.
One twelfth of the EU’s rural population faced severe material deprivation
Severe material deprivation is an absolute (rather than relative) measure of poverty: it refers to the enforced inability (rather than choice not to do so) to pay for at least four of the following items: unexpected expenses; rent, mortgage or utility bills; a one week annual holiday; a meal with meat or fish every second day; adequate heating to keep the home warm; a washing machine; a colour television; a telephone; or a car.
The distribution of severe material deprivation across rural areas was skewed, as only 10 of the EU Member States recorded a share that was above the EU-28 average. Deprivation was concentrated in the rural areas of the south-eastern part of the EU, as the share of the population living in severe material deprivation peaked at 42.6 % in Bulgaria and 29.0 % in Romania, while Hungary and Greece were the only other EU Member States to report that more than one fifth of their rural populations were living in severe material deprivation. By contrast, the severe material deprivation rate for rural areas was less than half the EU-28 average in 12 of the Member States, with rates falling to below 2.0 % in Finland, Austria, Luxembourg, Sweden, the Netherlands and Malta.
Housing
In recent years there has been a growing share of the EU labour force working from home, as the introduction of new technologies has made it relatively easy to carry out some occupations remotely; these changes have resulted in more choice/flexibility for some people as to where they live (and work).
Relatively high house prices in some city centre locations, coupled with improvements in transport and communication infrastructures have encouraged some people to consider moving to suburban or rural areas. Such moves usually involve a trade-off, for example, individuals have to decide whether they can accept a lengthy/congested commute to work in return for being able to buy a larger property or being able to live in an area that has a lower level of crime or a wide choice of green spaces within close proximity.
More than 80 % of the EU’s rural population lived in a house
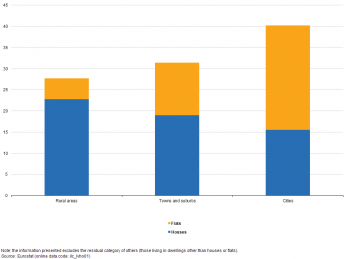
Unsurprisingly the relative abundance of space in rural areas (compared with urban areas) is reflected when analysing types of dwelling by degree of urbanisation. In 2015, almost one quarter (22.8 %) of the EU-28 population was living in a rural area and in a house, while an additional 4.9 % of the population was living in a rural area and in a flat; as such, more than four out of every five people in the rural population lived in a house.
A majority of people living in towns and suburbs also lived in houses (19.0 % of the total number of EU-28 inhabitants), while the proportion of the population that were city-dwellers and living in a house was lower (15.5 % of the EU-28 population) than the share living in a flat (24.7 %); as such, just over three fifths of the population living in cities occupied a flat.
These distributions reflect not only the lack of space for building houses in cities, but also the demand for property and demographics, insofar as young people (often living alone) are pulled to cities by educational, career, cultural and other opportunities, whereas (expanding) families tend to move towards the suburbs, towns and rural areas in search of more space and other benefits that may impact on their overall quality of life.
The share of people overburdened by housing costs was lower in rural areas of the EU
Housing is often the largest single item in a household budget, irrespective of whether the occupants are paying off a mortgage/loan or renting a property. The housing cost overburden rate is defined as the share of the population that is living in a household where total net housing costs were greater than 40 % of disposable income. House/flat prices and rents vary considerably, not just between and within EU Member States, but also at a more local/regional level.
The data presented below on housing cost reflect a wide range of factors, including: affordability, income distributions, or the supply and demand for housing. For example, people living in cities are often prepared to pay more for less space in order to live centrally or in a fashionable borough/district. This has led to the gentrification (displacement of lower-income families as a result of rising property prices) of some inner cities and considerable changes in their demographic and social make-up, with young, upwardly mobile professionals moving into regenerated housing stock, often crowding out the indigenous population. In a similar vein, popular rural locations can also see their property prices rise at a rapid pace, especially when supply is constrained by local planning authorities seeking to maintain the original charm of an area by prohibiting new developments.
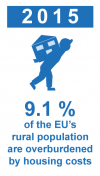
Across the EU-28, the housing cost overburden rate in 2015 was lowest in rural areas (9.1 %), with a slightly higher rate recorded for people living in towns and suburbs (10.6 %) and a peak among those living in cities (13.3 %).
The distribution of the housing cost overburden rate across the rural areas of the EU Member States was relatively uniform, whereas there was far greater variation for cities (see Figure 6). In 2015, less than 5.0 % of the rural population in Slovenia, Luxembourg, Ireland (2014 data), France, Cyprus, Finland, Austria and Malta was overburdened by the cost of housing, whereas Cyprus and Malta were the only EU Member States where less than 5.0 % of city-dwellers faced such a burden. The share of the rural population overburdened by the cost of housing was situated within the range of 5.0–12.0 % for the majority of Member States, as only Bulgaria, Romania and Greece reported higher shares. By contrast, there were 11 Member States where the share of the population living in cities that was overburdened by housing costs rose above 12.0 %; these included the three Member States that recorded the highest shares for rural areas — Bulgaria, Romania and Greece — as well as Denmark, Germany, the Netherlands, the Czech Republic, the United Kingdom, Belgium, Slovakia and Austria.
In Greece, approximately 4 out of every 10 inhabitants were overburdened by the cost of housing, irrespective of the degree of urbanisation; these shares were considerably higher than in any of the other EU Member States. Romania, Croatia and Bulgaria were the only EU Member States where the housing cost overburden rate was higher for the population living in rural areas than it was for people living in cities; these figures may reflect, among others, the prevalence of subsistence farming activities, few alternative employment opportunities, low employment rates for women, and relatively large family units in rural communities. As such, some eastern parts of the EU were characterised by relatively high degrees of risk of poverty or social exclusion which probably impacted upon the burden faced in relation to housing costs.
Health
One of the main concerns for many Europeans is their health. Figure 7 presents information on the share of people (aged 16 and over) who reported unmet needs for health care due to expense, distance to travel, or the length of waiting lists. The ability to pay for/expense of medical services is clearly linked to the distribution of income, while people living in rural areas are more likely to be deterred from seeking health care services as a result of travelling long distances (medical services tend to be concentrated in towns and cities), and the length of waiting lists reflects the supply of and the demand for services (which may vary according to the treatment, therapy or intervention required).
Rural populations in the EU were more likely to have unmet needs for health care
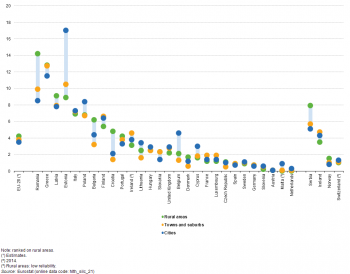
In 2015, some 4.2 % of the EU-28 population living in rural areas reported unmet needs for health care during the 12 months prior to the survey. This share was somewhat higher than the corresponding figures recorded for towns and suburbs (3.8 %) or for cities (3.5 %).
In most of the western EU Member States there was almost no difference in the share of the population that reported unmet needs for health care when analysing by degree of urbanisation, whereas there was a wider variation particularly apparent for several of the Member States that joined the EU in 2004 or more recently. Looking more closely, just over half (15) of the Member States reported very small differences (defined here by a range of less than 1.0 percentage point between the highest and lowest shares). Relatively wide variations were recorded in Romania, Croatia and Bulgaria, where the share of the rural population with unmet needs for health care was at least 3.0 percentage points higher than the lowest share (recorded for city-dwellers in Romania, and for people living in towns and suburbs in Croatia and Bulgaria). Similar variations were recorded in Estonia and Belgium, although the highest shares of their populations with unmet needs for health care were recorded in cities.
Education
Education (like health) can play an important role in determining life chances and raising the quality of life of an individual. Education also has social returns, insofar as raising overall educational standards will likely result in a more productive workforce which, in turn, may drive economic growth.
People living in rural areas are generally more inclined to leave education or training early
A lack of educational skills and qualifications is likely to restrict access to a variety of jobs/careers. In 2015, the EU-28 early leavers’ rate from education and training (defined for people aged 18 to 24 years) peaked at 12.2 % in rural areas, compared with 11.5 % in towns and suburbs, and 9.8 % in cities. There were however considerable differences between the EU Member States: on one hand, particularly high early leavers’ rates were recorded in the rural areas of a number of principally eastern and southern Member States, for example, Slovakia, Spain, Greece, Hungary, Estonia, Romania and Bulgaria (where the gap between rates in rural areas and in cities ranged from 7.3 to 25.8 percentage points). By contrast, there were four western Member States — France, Germany, Belgium and Austria — as well as Malta, where the early leavers’ rate from education and training was higher among city-dwellers.
Just over one quarter of the EU’s rural population (aged 30 to 34) had a tertiary level of educational attainment
Turning to the other end of the educational attainment ladder, in 2015 just over one quarter (27.9 %) of the EU-28’s rural population (aged 30 to 34 years) had a tertiary level (ISCED 2011 levels 5–8) of educational attainment; this figure could be compared with a share of one third (33.4 %) for people living in towns and suburbs and almost a half (48.1 %) among city-dwellers (see Figure 8).
An analysis over time reveals that the rural areas consistently recorded the lowest level of tertiary educational attainment, while the gap between rural areas and cities grew. In 2004, just over one fifth (21.0 %) of the EU-28 rural population (aged 30 to 34 years) had a tertiary level of educational attainment, while the corresponding share for city-dwellers was just over one third (34.4 %), a difference of 13.4 percentage points; by 2014, this gap had widened to 20.5 percentage points, falling marginally the year after to 20.2 points in 2015.
Looking at the individual EU Member States, the share of the rural population (aged 30 to 34 years) in 2015 with a tertiary level of educational attainment ranged from a high of 44.9 % in Luxembourg (compared with 77.7 % in cities) down to less than 10.0 % in Bulgaria (46.6 % in cities) and Romania (46.4 % in cities). Tertiary levels of educational attainment were consistently lower in rural areas than they were in cities, across all of the Member States, except Malta (for which the data are of low reliability).
This situation of more highly-educated people in cities may reflect a number of factors. For example, most universities and other tertiary educational establishments are based in cities, while cities tend to have more dynamic and specialised labour markets, which may be particularly attractive to graduates.
The share of young people (aged 18 to24) living in rural areas of the EU who were neither in employment nor in further education or training was 3.7 percentage points higher than in cities
Figure 9 presents information for the share of young people (aged 18 to 24 years) neither in employment nor in further education or training (abbreviated as the NEETs). For the first of these two criteria — not in employment — the respondent may be unemployed or economically inactive; for the second of these criteria — nor in further education or training — the respondent should not have received any form of education or training during the four weeks preceding the survey. The denominator for the NEETs rate is the total population of the same age group, excluding those persons who failed to answer the question concerning participation in regular (formal) education and training.
In 2015, the share of young people (aged 18 to 24 years) in the EU-28 neither in employment nor in education or training stood at 15.8 %. An analysis by degree of urbanisation reveals that the NEETs rate for rural areas (17.9 %) was higher than that recorded for towns and suburbs (16.5 %) or for cities (14.2 %). An analysis over time (2004–2014) indicates that the EU-28 rate for rural areas was consistently higher than the rate for cities, with some of the widest gaps recorded during the latest three-year period for which data are available (2013–2015).
In 2015, there were 13 EU Member States where the NEETs rate for rural areas was higher than the EU-28 average; for towns and suburbs and for cities the distributions were fairly skewed insofar as in both cases only nine Member States recorded rates that were higher than the EU-28 average. The highest NEETs rate for rural areas was recorded in Bulgaria (40.9 %), while Greece and Croatia both also recorded rates above 30.0 %. As well as recording the highest NEETs rates in rural areas in 2015, these three Member States also recorded the biggest gaps when comparing NEETs rates for rural areas with those for cities, with the widest gap — 29.7 percentage points — recorded in Bulgaria.
There were six EU Member States (no data for Malta) where the NEETs rate for rural areas was equal to or less than 10.0 %. In four of these — the Netherlands, Germany, Luxembourg and Austria — the rate for rural areas was lower than that recorded in cities. Only two other Member States recorded a similar pattern, the United Kingdom and Belgium (where the largest gap between the rates for cities and rural areas was registered, at 6.9 percentage points).
As such, in keeping with the results for several other indicators, there was a marked geographical split when analysing information for education. Rural areas tended to record high NEETs rate in most of the eastern and southern EU Member States, where the difference between NEETs rates for rural areas and cities was usually quite wide. By contrast, NEETs rates were generally at a lower level in most of the western Member States, with a narrower range between the degrees of urbanisation and with rates in cities often higher than those for rural areas.
The EU-28 NEETs rate for young men was 15.4 % in 2015, compared with a rate of 16.3 % for young women. An analysis over time confirms the existence of a persistent gender gap, although this narrowed somewhat in recent years. The largest gender gap by degree of urbanisation was systematically recorded for rural areas. In 2015, the NEETs rate for young women living in rural areas (18.8 %) was 1.8 percentage points higher than the corresponding rate for young men (17.0 %).
Labour market
Employment conditions and opportunities to find or change work can play a considerable role in determining an individual’s material living conditions. Work is considered important for wellbeing not only because it generates income but also because it occupies a significant part of each working day and has the potential to develop skills, a sense of achievement, satisfaction or worth.
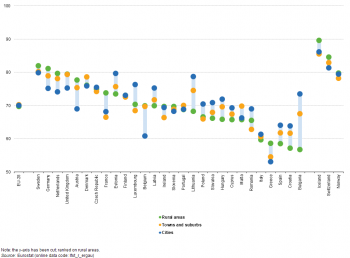
The employment rate is the percentage of employed persons in relation to the total population; comparisons are usually based on the population of working-age, defined here as those aged 20 to 64. There was almost no difference (0.5 percentage points) between EU-28 employment rates for the three different degrees of urbanisation (see Figure 10): in 2015, the lowest employment rate was recorded among people living in rural areas (69.7 %), while the rates for cities (70.0 %) and for towns and suburbs (70.2 %) were only marginally higher.
Employment rates are highly influenced by gender differences and in particular by different levels of female participation in the labour force. The EU-28 gender gap for employment rates (again among those aged 20 to 64) stood at 17.3 percentage points in 2002 (the first reference year for which data are available). While the EU-28 employment rate for men was 75.8 % in 2002 and again in 2015, there was a gradual increase in the employment rate for women, which rose to 64.2 % by 2015; as a result, the gender gap narrowed to 11.6 percentage points. An analysis for rural areas reveals a similar pattern, with a slightly wider gender gap for employment rates in rural areas (13.1 percentage points in 2015) and a slightly lower female employment rate (63.1 % in 2015): as such, the impact of female participation was even greater in rural areas than in urban areas.
Several northern and western Member States were characterised by higher employment rates in rural areas …
In 2015, employment rates for rural areas in Bulgaria and Lithuania were 16.7 and 10.5 percentage points lower than those recorded for cities; this pattern was repeated (although to a lesser degree) in eight other Member States, including Italy. By contrast, in Belgium and Austria, employment rates for rural areas were 9.1 and 8.7 percentage points higher than those recorded in cities; this pattern was repeated in six other Member States, including Germany and the United Kingdom.
In 2015, the highest employment rates in rural areas were recorded in northern and western EU Member States, with rates rising above 80.0 % in Sweden and Germany, while the Netherlands and the United Kingdom were just below this level. By contrast, the lowest employment rates for rural areas — less than 60.0 % — were recorded in Italy, Greece, Spain, Croatia and Bulgaria; a more detailed analysis by sex reveals relatively low female employment rates and consequently a relatively large gender gap for each of these Member States, for example, female employment rates were more than 20.0 percentage points below male rates in the rural areas of Greece and Italy. These figures confirm the relatively strong link between female employment rates and overall employment rates in particular in the southern Member States. Such differences may be attributed, at least in part, to the role of women within families.
… whereas unemployment rates for rural areas were usually higher than those for cities in most eastern Member States
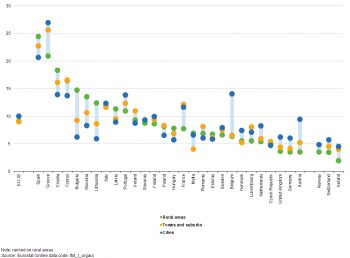
People who struggle to find work, or people who work in precarious jobs, unsocial hours or long hours for low pay are more likely to have low levels of job satisfaction which may impact on their overall quality of life. Figure 11 provides information pertaining to one of these measures, namely the unemployment rate (for people aged 15 to 74 years). In 2015, the EU-28 unemployment rate was 9.4 %: an analysis by degree of urbanisation reveals that the lowest unemployment rates were recorded in towns and suburbs (9.0 %) and rural areas (9.1 %), while the rate in cities was somewhat higher (10.0 %).
In 2015, there were nine EU Member States that recorded their highest unemployment rate, by degree of urbanisation, in rural areas; they were located in the Baltic Member States, eastern and southern Europe. By contrast, there were 12 Member States where the highest unemployment rates were recorded in cities; these were generally not in the eastern parts of the EU, although Slovenia was an exception.
Much higher unemployment rates were recorded for rural areas (compared with cities) in Bulgaria, Lithuania and Slovakia in 2015. In these Member States, the difference was more than 5.0 percentage points, with unemployment rates in rural areas systematically higher than the EU-28 average, while unemployment rates in cities were systematically below the EU-28 average. By contrast, the unemployment rates recorded in rural areas of Belgium, Greece and Austria were considerably lower than those recorded in cities, with differences of more than 5.0 percentage points. Very low unemployment rates (less than 4.0 %) were recorded in the rural areas of Austria, Germany and the United Kingdom.
Digital divide
Digital technologies play an important role in the everyday lives of most Europeans; the internet has made it possible for people, businesses and governments to transform the ways in which they communicate and engage with one another. Yet some parts of the population are excluded (sometimes out of choice) and there is a danger that the so-called digital divide becomes wider with the introduction of new technologies.
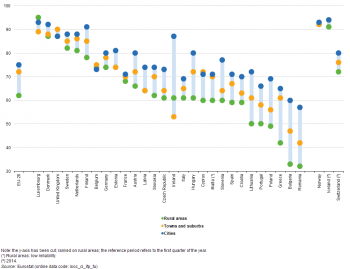
Less than two thirds (62 %) of the EU-28 population living in rural areas accessed the internet on a daily basis in 2016; this share rose to 72 % for people living in towns and suburbs and peaked at three quarters (75 %) of the population among city-dwellers.
The most popular types of broadband access to the internet are via a digital subscriber line (DSL) or cable (fibre): the first of these is almost universally available across the EU, whereas (high-speed) cable services are less widespread and are sometimes restricted to more densely populated areas — perhaps explaining, at least in part, why the use of the internet is lower in rural areas. To promote additional public funding in rural areas, the European Commission revised its guidelines for the application of EU State aid rules to the broadband sector in January 2013 and published a new broadband investment guide in September 2014 to encourage the expansion of fast and ultra-fast broadband services to rural areas.
For all but three of the EU Member States, the lowest proportion of people making use of the internet on a daily basis was recorded in rural areas
Looking in more detail at individuals’ daily use of the internet, there were widespread disparities between the EU Member States. These differences are often along geographical lines with northern and western EU Member States generally recording higher levels of internet use than those Member States located in the south or east. The highest daily use of the internet in 2016 was recorded in Luxembourg, Denmark, the United Kingdom, the Netherlands, Finland and Sweden. By contrast, the lowest daily use of the internet was recorded in Greece, Poland, Bulgaria and Romania.
A closer analysis by degree of urbanisation (see Figure 12) reveals that people living in rural areas usually recorded the lowest share of individuals accessing the internet on a daily basis; this was the case in 25 out of the 28 EU Member States in 2016. Belgium, Ireland and Luxembourg were the only EU Member States where people living in rural areas did not record the lowest daily use of the internet.
In Lithuania, Portugal and Poland, a relatively low proportion — close to half — of the rural population made use of the internet on a daily basis in 2016, with this share falling to 42 % in Greece, and close to one third of the rural population in Bulgaria and Romania. Some of these differences in the daily use of the internet may be attributed to a lack of infrastructure in rural areas, which restricts access to and the availability of digital technologies. There may be a number of other factors that also play a role, including: general levels of literacy, education, computer skills and language skills (in particular English) or cultural factors.
Data sources and availability
Eurostat’s data on rural areas forms part of a data collection exercise undertaken for statistics classified by degree of urbanisation. In 2011, the European Commission Directorates-General for Regional and Urban Policy (DG REGIO) and Agriculture and Rural Development (DG AGRI), Eurostat and the Joint Research Centre (JRC), together with the OECD revised the degree of urbanisation classification based on a common methodological approach.
The latest version of this classification is based upon the 2011 population grid and 2014 boundaries for local administrative units (LAUs). Grid cells of 1 km² are classified according to a combination of criteria linked to geographical contiguity and the share of the local population living in urban centres and in urban clusters to assign LAU level 2 (LAU2), generally municipalities, into three types of area:
- cities (densely populated areas), where at least 50 % of the population lives in urban centres;
- towns and suburbs (intermediate density areas), where at least 50 % of the population lives in urban clusters and less than 50 % of the population lives in urban centres;
- rural areas (thinly populated areas), where at least 50 % of the population lives in rural grid cells.
Note that the introductory chapter provides further background information pertaining to the degree of urbanisation, including a table detailing the spatial concepts involved; a map showing the distribution of LAU2s according to the degree of urbanisation; and a figure detailing the share of the total population by degree of urbanisation for each EU Member State.
For more information:
Typology for the degree of urbanisation
Correspondence table for LAU2–degree of urbanisation
Indicator definitions
Glossary entries on Statistics Explained are available for a wide range of concepts relating to rural areas, while additional glossary entries for specific indicators may be found under the relevant thematic headings.
For more information:
Dedicated section on the degree of urbanisation
Context
The EU’s rural areas are diverse in nature, characterised by their specific natural environments and endowments. They provide among others, food and environmental resources that are crucial to the prosperity of both rural and urban areas, while their quality of life attributes are increasingly valued.
In recent years, there has been particular policy interest in analysing the interaction between adjacent rural and urban areas, as rural areas in close proximity to urban areas are often dynamic local economies. By contrast, more remote, sparsely populated rural areas are generally characterised by weaker economic growth.
Rural development 2014–2020
The EU’s rural development policy is designed to help rural areas meet a wide range of economic, environmental and social challenges, sharing a number of objectives with other European structural and investment funds (ESIF). Rural development policy complements the system of direct payments to farmers, which is outlined in the EU’s common agricultural policy (CAP).
Regulation (EU) No 1305/2013 details the reform of the EU’s rural development policy post-2013; it is the latest in a series of developments. Three long-term strategic objectives have been identified for the period 2014–2020, in line with Europe 2020 and CAP objectives: improving the competitiveness of agriculture; safeguarding the sustainable management of natural resources and climate action; and ensuring that the territorial development of rural areas is balanced.
In keeping with other structural and investment funds, EU Member States and their regions draw up coordinated rural development programmes (RDPs), which follow a set of common priorities including ‘promoting social inclusion, poverty reduction and economic development in rural areas’. These RDPs are constructed so as to: strengthen the content of rural development measures; simplify rules and/or reduce related administrative burdens; and link rural development policy more closely to other funds. They are financed through the European Agricultural Fund for Rural Development (EAFRD) which has a budget of EUR 100 billion for the period 2014–2020. Aside from the EAFRD, several other EU funds provide support to rural areas, namely: the European Regional Development Fund (ERDF), the European Social Fund (ESF), the Cohesion Fund and the European Maritime and Fisheries Fund.
See also
- Degree of urbanisation classification — 2011 revision (background article)
- Population grids (background article)
- Statistics on regional typologies in the EU (background article)
- Territorial typologies (background article)
Further Eurostat information
Data visualisation
Publications
Database
- Health (degurb_hlth)
- Lifelong learning (degurb_trng)
- Educational attainment level and outcomes of education (degurb_edat)
- Living conditions and welfare (degurb_livcon)
- Labour market (degurb_labour)
- Tourism (degurb_tour)
- Digital economy and society (degurb_isoc)
Dedicated section
Methodology / Metadata
- A harmonised definition of cities and rural areas: the new degree of urbanisation — European Commission (2014)
- Degree of urbanisation
Source data for figures and maps (MS Excel)
External links
- European Commission — rural development policy
- European Commission — rural development legislation
- European Network for Rural Development (ENRD)
- OECD — rural development
