Archive:Hotel, restaurant and catering services statistics - NACE Rev. 1.1
This Statistics Explained article is outdated and has been archived - for recent articles on structural business statistics see here.
- Data from January 2009, most recent data: Further Eurostat information, Main tables and Database
This article introduces a set of statistical articles which analyse the structure, development and characteristics of the economic activities in the hotel, restaurant and catering sector in the European Union (EU). According to the statistical classification of economic activities in the EU (NACE Rev 1.1), this sector covers NACE Section H or Division 55. It covers activities that make up a significant part of the tourism supply, although also serving local clients, namely hotels and other provision of short-stay accommodation, restaurants, bars, canteens and catering. This sector’s activities are treated in more depth in two further articles:
Main statistical findings
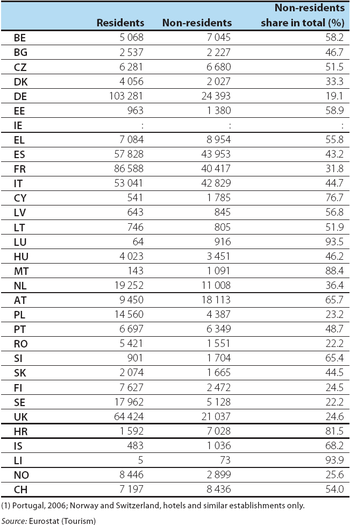
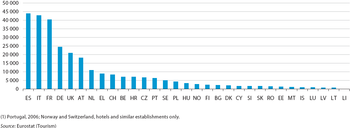
Germany and France recorded the largest number of tourists in 2007, each with just over 127 million tourist arrivals (including both residents and non-residents). Spain, Italy and France welcomed the most non-residents in absolute terms, whereas as a proportion of all tourist arrivals, non-residents were highest in the three smallest Member States (Luxembourg, Malta and Cyprus), followed by Austria.
Structural profile
Accommodation and food services (NACE Section H) recorded value added of EUR 181.9 billion in the EU-27 in 2006, which represented 3.2 % of the total for the non-financial business economy (NACE Sections C to I and K). However, it was in terms of the number of enterprises and also employment that this sector's contribution to the non-financial business economy total was greatest. In total, 1.7 million enterprises employed 9.3 million people, equal to 7.1 % of the non-financial business economy workforce and 8.3 % of the enterprise population; by these two measures the accommodation and food services sector was the sixth largest in terms of the coverage used in the structural business statistics sector articles.
This large workforce contained a relatively low share of paid employees in the EU-27, 82.1 %, indicating a large number of working proprietors and unpaid family workers. A more detailed analysis shows that the subsector concerning restaurants, bars and catering (NACE Groups 55.3 to 55.5) had a particularly low share of paid employees, just 79.6 %, while the 89.9 % share recorded for accommodation services (NACE Groups 55.1 and 55.2) was in fact above the non-financial business economy average.
Restaurants, bars and catering was the larger of these two subsectors, as it contributed about two thirds (64.0 %) of the value added in the EU-27's accommodation and food services sector in 2006, while providing around three quarters (75.3 %) of the sectoral workforce.
With EUR 41.7 billion of value added and 9.3 million persons employed in 2006, the United Kingdom was by far the largest Member State in the accommodation and food services sector, contributing more than a fifth of the EU-27 total for these two measures. In terms of the value added contribution to national non-financial business economy, Cyprus (2005) was by a very large margin the most specialised Member State [1] in accommodation and food services, with 12.2 % of its non-financial business economy value added generated in this sector. In fact, based on the coverage of the structural business statistics sector articles, accommodation and food services was the second largest sector in Cyprus in value added terms. A number of other southern European Member States figured in the list of Member States most specialised in this sector, along with Austria. It should be noted that recent data related to specialisation is not available for Malta, while older data also imply a high specialisation rate for Malta in this sector. Among all the Member States the contribution of accommodation and food services to non-financial business economy value added was lower than the equivalent contribution in terms of employment, reflecting the labour-intensive nature of these activities, although employment figures are boosted by the high degree of part-time employment in this sector (see below).
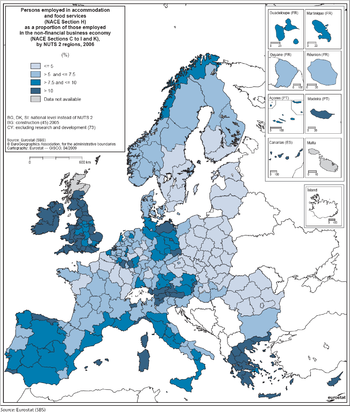
The map shows the contribution of the accommodation and food services sector to employment within the non-financial business economy (NACE Sections C to I and K) of each region. The importance of this activity in several southern Member States is clear, and the highest proportions of non-financial business economy employment in the accommodation and food services sector were recorded in Ionia Nisia (33.8 %) and Notio Aigaio (29.9 %), both in Greece, followed by regions in Portugal, Spain and Italy. Nevertheless, this sector also provided 15.0 % or more of non-financial business employment in a few regions in the United Kingdom and Austria, one Irish and one German region, as well as in Cyprus.
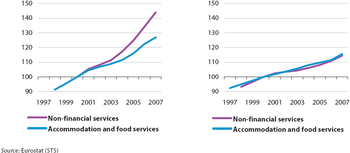
As regards the development of the accommodation and food services sector in the EU-27 over approximately ten years, in terms of turnover and employment, both of these measures posted uninterrupted growth. The index of turnover grew on average by 3.7 % per year between 1998 and 2007, with the lowest year on year growth recorded in 2003 (1.8 %) and the highest (5.6 %) in 2006. Among the Member States for which the turnover index is available from 2000 to 2007 [2], a rapid increase for accommodation and food services was observed for the three Baltic Member States, Bulgaria and Romania, all recording average growth in excess of 14 % per year.
The index of employment for accommodation and food services recorded average growth of 2.2 % per year in the EU-27 between 1998 and 2007, roughly in line with the 2.3 % average growth recorded for non-financial services (NACE Sections G to I and Divisions 72 and 74). In 2007, EU-27 employment growth of 3.7 % was recorded in this sector, the fastest rate of growth throughout this period.
In terms of enterprise size, a large proportion of wealth created in the EU-27's accommodation and food services sector was concentrated within micro and small enterprises (with less than 10 and 10 to 49 persons employed respectively): micro and small enterprises generated 62.8 % of the sector's value added in 2006, and employed 70.9 % of the workforce in 2005, approximately 20 percentage points higher than the equivalent shares for the non-financial business economy as a whole. Among the Member States [3], the United Kingdom (44.9 %) and to a lesser extent the Netherlands (34.6 %) stood out from the other countries, as large enterprises (with 250 and more persons employed) made significant contributions to the accommodation and food services sector’s value added in 2006.
Employment characteristics
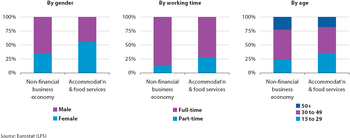
The accommodation and food services workforce was atypical, with high proportions of women, part-time workers, and younger workers in the workforce. In 2007 women made up 55.6 % of the workforce in this sector in the EU-27, a share that was 20.5 percentage points higher than the non-financial business economy average. Moreover, this pattern was widespread, as the proportion of female employment was higher than the non-financial business economy national average in every Member State.
Among the EU-27's accommodation and food services workforce in 2007 some 71.9 % worked on a full-time basis, a share that was clearly below the non-financial business economy average (85.6 %). In fact, this was the second lowest full-time employment rate among all the NACE divisions within the non-financial business economy, higher only than in retail trade (NACE Division 52). This low proportion of full-time employment reflects the need for employment flexibility in this sector, including adaptability to atypical working hours. In all of the Member States, except for Romania, the proportion of the persons working full-time in the accommodation and food services sector was below the national average for the non-financial business economy.
The workforce in this sector tended to be younger than in other activities within the non-financial business economy, a characteristic linked to the relatively low-skilled and low paid nature of many of the jobs, as well as to the flexibility and irregularity of working hours, and to the seasonal nature of work in this sector that often peaks during periods when higher education establishments are closed. In 2007, those aged 15 to 29 accounted for over one third (35.7 %) of the sector's workforce in the EU-27, the highest share of younger workers in the workforce of all of the NACE divisions within the non-financial business economy. The share of younger workers in the workforce of accommodation and food services was systematically higher than the average in the non-financial business economy in all of the Member States, except in Cyprus.
Expenditure, productivity and profitability
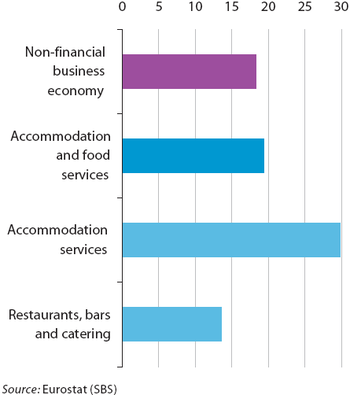
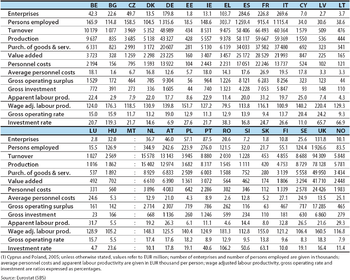
Investment by the accommodation and food services sector was relatively high in 2006, EUR 35.2 billion. This was equivalent to 3.4 % of the non-financial business economy total, slightly more than the sector's value added share and as a result the investment rate in the accommodation and food services sector (19.4 %) was above the non-financial business economy average (18.4 %). A more detailed analysis reveals that the accommodation services subsector recorded a particularly high level of investment, equivalent to 29.8 % of its own value added, while the restaurants, bars and catering subsector had an investment rate of 13.5 %. Lithuania and Greece both recorded relatively high rates of investment in the accommodation and food services sector, to the extent that the investment rate recorded here was approximately 1.7 times the rate recorded for the non-financial business economy. However, the highest investment rates were recorded in Bulgaria and Romania, and were in excess of 100 %, indicating that in this sector investment outstripped value added in 2006.
An analysis of expenditure shows that personnel costs accounted for slightly less than one third (32.7 %) of the total operating expenditure in the EU-27’s accommodation and food services sector in 2006. This share was approximately double the non-financial business economy average (16.1 %), and was the third highest share in terms of the coverage used for the structural business statistics sector articles, underlying the labour-intensive nature of accommodation and food services. In the accommodation services subsector the share of personnel costs was particularly high, reaching 37.4 %, compared with 30.7 % for restaurants, bars and catering.
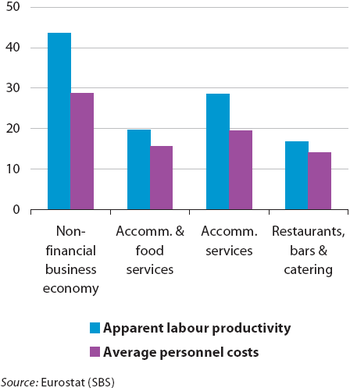
Apparent labour productivity in the EU-27's accommodation and food services sector was EUR 19.6 thousand per person employed in 2006, this low level reflecting, at least to some extent, the high use of part-time and seasonal employment. Equally, these characteristics and the relatively low or unskilled workforce have an impact on average personnel costs per employee which were EUR 15.6 thousand in the accommodation and food services sector. For both of these indicators the accommodation and food services sector recorded the lowest values among all of the sectors covered by the structural business statistics sectors; both of these indicators were even lower in the restaurants, bars and catering subsector.
The wage-adjusted labour productivity ratio is less affected by the incidence of part-time and seasonal employment. For the EU-27’s accommodation and food services sector this ratio was 126.2 % in 2006, still well below the equivalent ratio for the non-financial business economy (151.1 %). Again this ratio was lower for restaurants, bars and catering than it was for accommodation services. In all Member States [4] this ratio was lower in the accommodation and food services sector than in the non-financial business economy as a whole, although only the Greek ratio of 79.5 % was below parity (100 %).
Despite the relatively low productivity figures, the EU-27's accommodation and food services sector recorded a gross operating surplus (value added less personnel costs) equivalent to 14.6 % of turnover in 2006. Once more, a lower level for this indicator was registered for the restaurants, bars and catering subsector, but at 12.8 % it was still above the non-financial business economy average of 10.8 %.
Data sources and availability
The main part of the analysis in this article is derived from structural business statistics (SBS), including core, business statistics which are disseminated regularly, as well as information compiled on a multi-yearly basis, and the latest results from development projects.
Other data sources include short-term statistics (STS), the Labour force survey (LFS) and Eurostat tourism statistics.
Context
One of the main characteristics of tourism is the high income elasticity of demand, which increases or reduces more easily than for many other products or services. As such, spending on tourism generally decreases proportionally faster than consumers' income during times of economic slowdown. Moreover, political or economic uncertainties tend to lead to a diversion of tourism demand, leading for example to shifts between outbound tourism and domestic tourism, for example when exchange rates change rapidly. Furthermore, a downturn in economic fortunes is also likely to result in reduced business activity; likely to be reflected in fewer business trips and nights spent in hotels, as well as less business lunches and dinners.
Further Eurostat information
Publications
- European Business: Facts and figures - 2009 edition
Main tables
Database
Dedicated section
Other information
See also
- Seasonality in the tourist accommodation sector
- Tourism statistics
- Tourism statistics at regional level
- Tourism statistics
Notes
- ↑ Bulgaria, Cyprus, Poland and Romania, 2005; Malta and the Netherlands, not available.
- ↑ Greece, France and Italy, not available; Portugal, unadjusted data rather than working-day adjusted.
- ↑ Cyprus, Poland and Slovakia, 2005; Malta, not available.
- ↑ Bulgaria, Cyprus, Poland and Romania, 2005; Ireland, Malta and the Netherlands, not available.
