This Statistics Explained article is outdated and has been archived - for recent articles on population see here.
- Data from November 2012. Most recent data: Further Eurostat information, Main tables and Database.


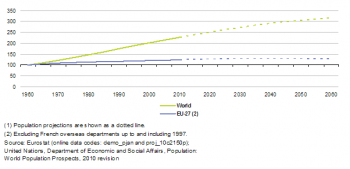
(1960=100) - Source: Eurostat (demo_pjan) and (proj_10c2150p); United Nations, Department of Economic and Social Affairs, Population: World Population Prospects, 2010 revision


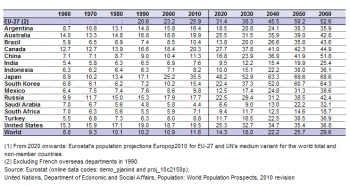
(population aged 65 years and over as % of population aged 15-64) - Source: Eurostat (demo_pjanind) and (proj_10c2150p); United Nations, Department of Economic and Social Affairs, Population: World Population Prospects, 2010 revision
This article gives an overview of the European Union's (EU's) population in relation to the rest of the world by looking at several key demographic indicators; it includes information on population levels, population density, fertility, life expectancy and old-age dependency ratios. The figures presented portray a diverse range of developments: with slow or even diminishing population numbers in some developed economies in contrast to rapid population increases in certain developing countries.
Main statistical findings
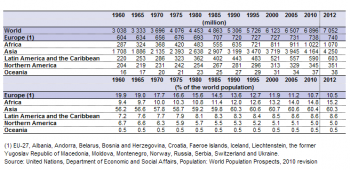
By 1 July 2012 the world’s population had reached 7 100 million inhabitants, according to United Nations’ (UN’s) World Population Prospects, 2010 revision. Most population scenarios project that population numbers will continue to grow in the coming decades. Asia accounted for the majority of the world’s population (just over 60 % in 2012) with 4 250 million inhabitants, while Africa was the next most populous continent with 1 070 million inhabitants, or 15.2 % of the global total. In comparison, there were 504 million inhabitants in the EU-27 in 2012, accounting for just over 7 % of the world’s population.
Global population more than doubled between 1960 and 2000, rising from just over 3 000 million. From the turn of the millennium to 2012, the world’s population grew by a further 929 million persons – although the rate of growth was somewhat slower than the rates experienced during the previous four decades (1960–2000). The overall increase in global population between 1960 and 2012 can be largely attributed to growth in Asia, Africa and Latin America.
The most populous countries in the world in 2012 were China (19.2 % of world's population) and India (17.8 %) – see Table 2 – followed at some distance by the United States (4.5 %), Indonesia (3.5 %) and Brazil (2.8 %).
Population density within the EU-27 was estimated at 117 persons per km² in 2012 (see Table 2), more than 3.5 times as high as in the United States, but below the values recorded for Indonesia, China, Japan, India and South Korea. The highest absolute changes in population density between 1960 and 2012 – among those countries covered by Table 2 – were recorded in the two countries with the highest population densities, namely, India and South Korea. However, the rate at which population density was growing was higher in Saudi Arabia, Mexico and South Africa.
The latest UN population projections (see Figure 2) suggest that the pace at which the world’s population is expanding will slow somewhat in the coming decades; nevertheless, the total number of inhabitants is projected to reach more than 9 600 million by 2060. According to these projections (the medium variant), the world’s population will also be relatively older (in other words, with a higher median age) in 2060. At the same time, according to Eurostat's population projections, the EU-27’s population is predicted to grow at a slower rate before peaking in 2040–45, contracting thereafter.
Ageing societies
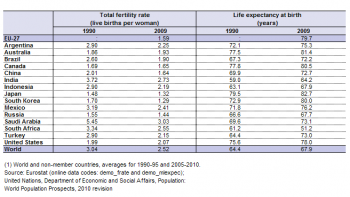
Ageing society represents a major demographic challenge and is linked to several issues, including, persistently low fertility rates and significant increases in life expectancy during recent decades (see Table 3). Improvements in the quality and availability of healthcare are likely, at least in part, to explain the latter, alongside other factors such as increased awareness of health issues, higher standards of living, or changes in workplace occupations from predominantly manual labour to tertiary activities. The average life expectancy of a new-born baby in the world was estimated at 67.9 years (for the period 2005 to 2010): the value of this indicator increased by 3.5 years compared with the period 1990 to 1995. In the EU-27, life expectancy at birth is generally higher than in most other regions of the world and stood at 79.7 years in 2009.
The old-age dependency ratio is used as indicator of the level of support of the old population (aged 65 years and over) by the working age population (those aged between 15 to 64 years). Both the UN's and Eurostat's population projections suggest that the number of older persons in the EU-27 will increase to such an extent that there will be fewer than two persons of working age for each person aged 65 or more by the year 2060 – see Table 4. UN projections suggest that the proportion of elderly persons within the total population will become particularly acute in Japan and South Korea.
Data sources and availability
The data in this article is based on information from two sources: Eurostat and the United Nations (UN) Population Division (World Population Prospects, 2010 revision).
The UN is involved in several multi-national survey programmes whose results provide key information about fertility, mortality, maternal and child health. UN population data is often based on registers or estimates of mid-year population; this may be contrasted with Eurostat’s data that generally reflect the situation as of 1 January in each reference year.
UN population projections are used in this article to provide comparisons between EU and non-member countries; within this article use was made of the medium variant projections. Eurostat regularly produces population projections at a national level for the EU Member States. The latest Eurostat population projections were made in 2010 (EUROPOP2010).
Context
Europe’s ageing society and its relatively static number of inhabitants may be contrasted against a rapid expansion in the world’s population, driven largely by population growth in developing countries. However, the demographic challenge that the EU-27 is confronted with is by no means unique. Most developed, and also some emerging economies, will undergo considerable changes in their demographic composition in the next five decades. Shrinking working age populations, a higher proportion of elderly persons, and increasing old-age dependency rates suggest that there will be a considerable burden to provide for social expenditure related to population ageing (pensions, healthcare, institutional care). The challenges associated with an ageing society are likely to be even more acute in countries such as Japan and South Korea where the old-age dependency ratio will rise rapidly and to a very high level, while the share of older persons in the total population is also expected to increase at a rapid pace in China.
See also
- Population and population change statistics
- Population structure and ageing
- Fertility statistics
- Mortality and life expectancy statistics
- Population projections
Further Eurostat information
Publications
- Population grows in twenty EU Member States - Issue number 38/2011
- The greying of baby boomers - Statistics in focus 23/2011
- Demography report 2010 - Older, more numerous and diverse Europeans
Database
- Population (populat), see:
- Demography (pop)
- Demography - National data
- Population (demo_pop)
- Fertility (demo_fer)
- Mortality (demo_mor)
- Marriage and divorce (demo_nup)
- Demography - National data
- Population projections (proj)
- EUROPOP2010 - Convergence scenario, national level (proj_10c)
Dedicated section
Methodology / Metadata
- EUROPOP2010 - Convergence scenario, national level (ESMS metadata file — proj_10c_esms)
- Fertility (ESMS metadata file — demo_fer_esms)
- Marriage and divorce (ESMS metadata file — demo_nup_esms)
- Mortality (ESMS metadata file — demo_mor_esms)
- Population (ESMS metadata file — demo_pop_esms)
Source data for tables and figures (MS Excel)


