Data extracted in June 2024
Planned update: 4 July 2025
Highlights
In 2022, 8.9 million tonnes of nitrogen fertiliser were used in agriculture across the EU, 9.4 % less than in 2021.
In 2022, 0.9 million tonnes of phosphorus fertiliser were used in agriculture across the EU, 17.9 % less than in 2021.
This article provides a fact sheet of the European Union (EU) agri-environmental indicator mineral fertiliser consumption. It consists of an overview of data, complemented by information needed to interpret these data. This article on mineral fertiliser consumption in the EU is part of a set of similar fact sheets, providing a comprehensive picture of the integration of environmental concerns into the Common Agricultural Policy (CAP).
Analysis at EU level
Sharp decrease in mineral fertiliser consumption in 2022
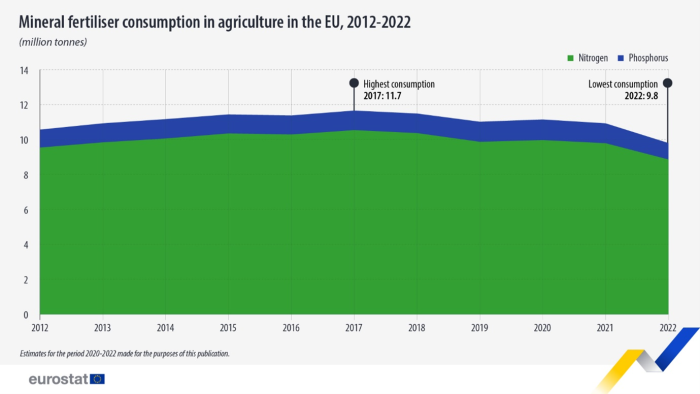
The quantity of mineral fertilisers - nitrogen (N) and phosphorus (P) – used in the process of agricultural production across the EU (hereafter termed 'consumption') was 9.8 million tonnes in 2022 (see Figure 1). This represented a 10.3 % year-on-year reduction and a cumulative decline of 15.9 % from the relative peak in consumption of 2017.
Nitrogenous fertilisers (ammonia, urea, ammonium nitrate) are produced with energy input from natural gas, the price of which is strongly linked to oil prices. The EU's nitrogen-based fertiliser industry has traditionally been heavily dependent on gas of Russian origin. Phosphates are mainly mined outside of the EU and, therefore, incur high transportation costs. Russia and Belarus are key players in the world production of rock-based fertilisers (phosphates and particularly potassium). The military aggression in Ukraine and application of sanctions on Russia led to sharply higher fertiliser prices throughout 2022, likely a driver to the decrease in the use of fertilisers in the EU (Communication on ensuring availability and affordability of fertilisers, European Commission, 2022).

Source: Eurostat (aei_fm_usefert)
At EU level, nitrogen fertiliser consumption in agriculture in 2022 was an estimated 8.9 million tonnes, a year-on-year decrease of 9.4 %, in line with (albeit more accentuated than) the short-term trend noted since 2017.
The introduction of the Nitrates Directive (ND) in 1991, of the national action programmes for designated nitrate vulnerable zones (NVZs) and the CAP reforms decoupling payments from production levels (Fertilisers in the EU - Prices, trade and use, DG AGRI, 2019) all led to steep declines in nitrogenous fertilisers in the 1990s and early 2000s. In the past ten years the consumption levels were relatively stable, slightly increasing from 2012 to 2017 and moderately decreasing since then. The year 2022, in great part for the reasons described above, was marked by a very significant reduction in historical terms.

Source: Eurostat (aei_fm_usefert)
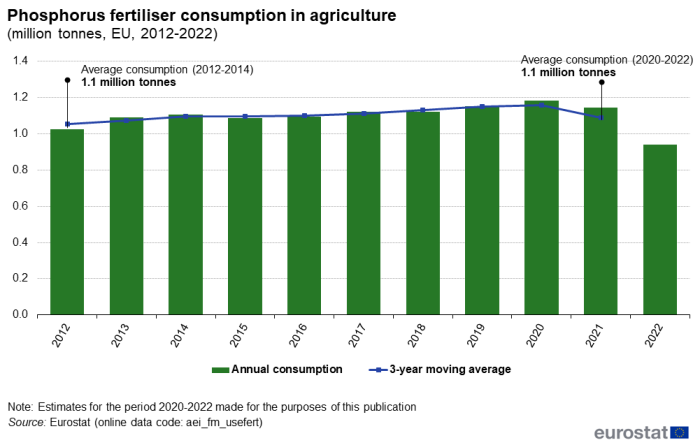
At EU level in 2022, there was also a sharp decline in the consumption of phosphorus fertilisers in agriculture to 0.9 million tonnes, representing a decline of 17.9 % compared with the level of consumption in 2021 (see Figure 3).

Source: Eurostat (aei_fm_usefert)
Analysis at country level
Note: Levels of mineral fertiliser use in agriculture are also influenced by prevailing agro-meteorological conditions, among other factors. For example, fertiliser application may be adjusted in the expectation of lower yields particularly during sustained and severe droughts, such as those experienced in 2012 and 2019. For this reason, three-year moving averages are used to better understand the trends in mineral fertiliser use. Whenever these averages are used in this publication, the years are represented in quotation marks (i.e. "2013" represents the average period 2012-2014).
Countries that are among the EU's highest agricultural producers and have the largest utilised agricultural areas tend to use the most nitrogen fertiliser in agricultural production (see Table 1): France (2.0 million tonnes in 2022) and Germany (1.1 million tonnes in 2022).

Source: Eurostat (aei_fm_usefert)
Between "2013" and "2021" there was growth in the amounts of nitrogen fertilisers used in agriculture in a majority of EU countries (see Figure 4). The sharpest rate of increase was in Romania, but this largely reflects starting from a relatively low absolute level compared with the EU average (Fertilisers in the EU - Prices, trade and use, DG AGRI, 2019).
These increases were offset by the reductions in the other EU countries, which crucially included the largest agricultural producers. In particular, there was a sharp decline in the use of nitrogen fertiliser in Germany (-24.8 %), while there were also declines in France and Poland that were sharper than the EU average. Among all EU countries, the sharpest rate of decline in the use of nitrogen fertilisers was in Portugal (-27.2 %).
At EU level, the consumption of nitrogen fertilisers in "2021" was similar to but slightly down (-2.8 %) on the level in "2013".

Source: Eurostat (aei_fm_usefert)
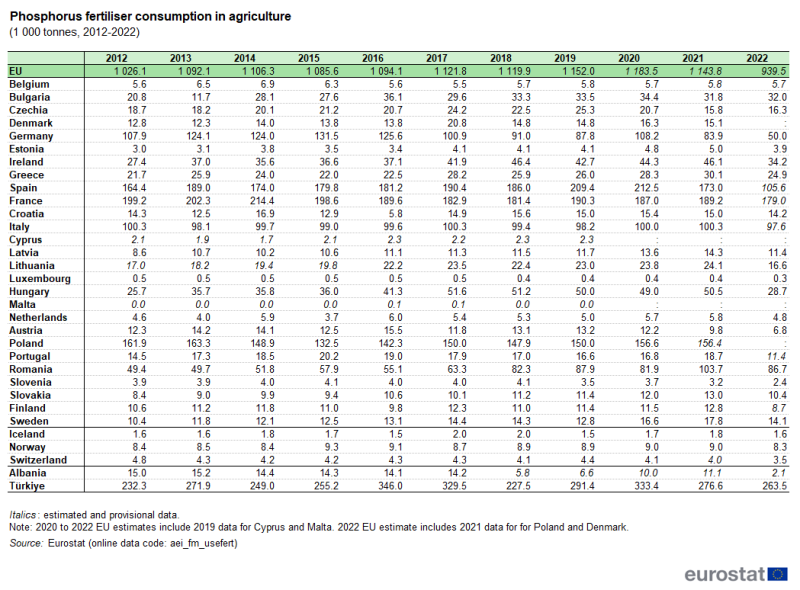
The total consumption of phosphorus in 2022 was also highest among the EU's largest agricultural producers (see Table 2): France (179 000 tonnes), Poland (156 400 tonnes in 2021), Spain (105 000 tonnes), Italy (97 600 tonnes), Romania (86 700 tonnes) and Germany (50 000 tonnes).

Source: Eurostat (aei_fm_usefert)
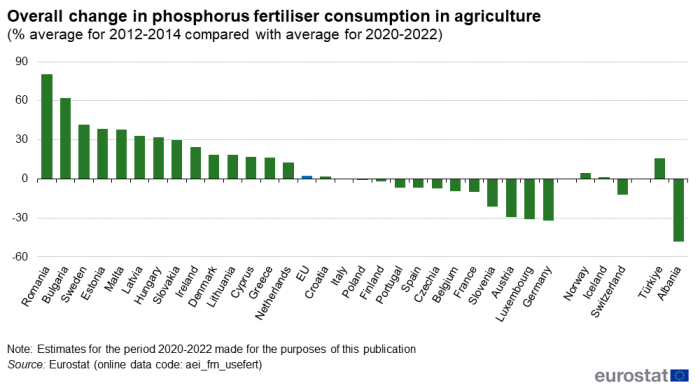
Between "2013" and "2021", there was growth in the use of phosphorus fertiliser in agriculture for a clear majority of EU countries. The sharpest rates of growth were in Romania (where the quantity used in "2021" was almost double that of "2013"), Bulgaria and Sweden. However, there were also some EU countries that used less phosphorus fertilisers in agriculture: in particular, it was about 30 % lower in Germany, Luxembourg and Austria.

Source: Eurostat (aei_fm_usefert)
Source data for tables, graphs and maps
Data sources
Indicator definition
Mineral fertiliser consumption refers to the quantity of nutrients - nitrogen (N) and phosphorus (P) - in mineral fertilisers used in agriculture over a calendar year. Main indicator:
- Absolute volumes (tonnes) of N and P
Links with other indicators
The consumptions of nitrogen and phosphorus fertilisers are linked to the gross nutrient balances, as nutrient inputs to the soil, as well as other agri-environmental indicators. Data used
Eurostat publishes data on consumption of inorganic fertilisers in agriculture (aei_fm_usefert). Methodology
The data source used in the assessment of this indicator is national data. Tonnes of N and P inorganic fertiliser consumption for year t are transmitted annually each t + 1, at NUTS 0 level and (for 11 countries) at NUTS 2 level.
It has to be noted that data sources on fertiliser consumption are not harmonised in the Member States (i.e. countries use different sources such as farm surveys, production/trade statistics, sales statistics or administrative records). Therefore, in some countries, official statistics on mineral fertiliser use as such are estimated based on different types of available data.
The reference period is the calendar year, however, in some cases countries report data based on the crop year. In such cases, no corrections are currently made. Limitations of data
The comparability of the data is weakened by the lack of harmonization of data sources and (in some cases) of the reference year. Data from production/sales statistics may also overestimate the use of mineral fertilisers due to the inclusion of intermediary goods and of non-agricultural use of fertilisers.
Eurostat is working together with Member States to improve the data collection on mineral fertiliser used in agriculture.
Context
Nutrients, such as nitrogen (N) and phosphorus (P), are absorbed from the soil by plants, for their growth. They mainly come in the form of mineral – inorganic – fertilisers, which are widely used in agriculture to optimise production, and organic fertilisers such as manure.
Nitrogen and phosphorus fertilisers greatly enhance crop production, but excessive use may lead to losses of these nutrients to the environment, contributing to environmental pollution. N and P behave differently in terms of their availability for loss from the agricultural system. N is highly soluble with limited build-up in the soils, and research shows a positive relationship between application rate and nitrate loss from the soil root zone. P losses from land occur due to soil erosion and agricultural run-off. Historic over-fertilisation of P can build up soil P saturation, in which case even negligible new fertiliser inputs may increase pollution.
The intensity of fertiliser use has implications for agricultural production and the potential environmental impacts of nutrient run-off from farmland. Agricultural research shows that nutrient requirements (and hence consumption) vary for different crop types and yield expectations and are influenced by previous land management, soil type and climatic factors.
Food production has become highly dependent on mineral P fertilisers. For example, some 80 % of phosphorus use is in agriculture. The main source of P in the world is phosphate rock - a non-renewable resource. The majority of phosphate rock reserves in the world are concentrated in a few countries, none of them EU Member States, making the EU highly dependent on imports. Phosphate rock is on the list of critical raw materials for the EU. It means that phosphate rock is a high supply-risk and of a high economic importance.
Increasing the effectiveness of organic fertiliser use will contribute to decreased use of mineral fertiliser since organic farmers do not apply synthetic mineral fertilisers. Organic fertilisers may consist of manure, composts and sewage sludge. These organic fertilisers are important sources of N and P, especially on livestock farms and farms near urban areas.
This indicator is strongly linked to the agri-environmental indicators: Gross nitrogen balance, risk of phosphorus pollution, ammonia emissions, GHG emissions and water quality - nitrate pollution.
Policy relevance and context
Application of fertilisers is a major factor contributing to losses of nutrients such as nitrate and phosphate from agricultural soils into ground and surface water bodies. This loss can occur via run-off along the soil surface or as sub-surface loss via leaching and drainflow.
Consequently, legislative initiatives through the Nitrates Directive and the Water Framework Directive have sought to limit nutrient losses to water bodies through more careful management of agricultural land.
The Nitrates Directive included the designation of nitrate vulnerable zones (NVZs), establishment of Code(s) of Good Agricultural Practice to be implemented by farmers on a voluntary basis, establishment of Action Programs to be implemented by farmers within NVZs on a compulsory basis, and national monitoring and reporting. In the Water Framework Directive, an indicative list of pollutants includes organophosphorus compounds and substances that contribute to eutrophication (in particular nitrates and phosphates). Measures suggested in this context aim at reducing the influx of nutrients, such as nitrogen and phosphorus to the groundwater and surface waters and include the reduction of nutrient application, the modification of cultivation techniques, proper handling of fertilisers, and the prevention of soil erosion through erosion minimising soil cultivation.
Other agri-environmental policies and initiatives that affect the consumption of nitrogen and phosphorus fertilisers:
- In its Farm to Fork strategy, the Commission pledged to act to reduce nutrient losses by 50 % and to reduce the use of fertilisers by at least 20 % by 2030. This is to be achieved, among other actions, through implementing in full the environmental and climate legislation and through developing with the Member States an integrated nutrient management action plan.
- United Nations Framework Convention on Climate Change (UNFCCC). Countries report on their progress in limiting greenhouse-gas emissions by submitting annual emission inventories and national reports. The application of mineral nitrogen fertilisers by agriculture is one of the items to be reported.
- National Emissions Ceiling Directive (NEC Directive). This Directive sets national reduction commitments for the five pollutants (sulphur dioxide, nitrogen oxides, volatile organic compounds, ammonia and fine particulate matter) responsible for acidification, eutrophication and ground-level ozone pollution which leads to significant negative impacts on human health and the environment. Targets are set for the years 2020 and 2030. Each EU Member State is required to produce a National Air Pollution Control Programme by 31 March 2019 setting out the measures it will take to ensure compliance with the 2020 and 2030 reduction commitments. The inventory data can be viewed in the EEA National Emission Ceilings Directive emissions data viewer.
- UNECE Convention on Long-range Transboundary Air Pollution Gothenburg protocol. For the EU Member States, the emission ceilings in the protocol are transposed into the NEC Directive (see above).
- Common Agricultural Policy (CAP). The EUs agriculture policy encourages environmentally friendly farming practices through greening, rural development payments, and cross-compliance.
- Natura 2000, the Birds Directive and the Habitats Directive. The main purpose of the Habitats Directive is to ensure biological diversity through the conservation of natural habitats and of wild flora and fauna within the European territory, while taking into account economic, social, cultural and regional requirements. Depending on the specific conditions of a certain area, these include measures to reduce the use of pesticides and fertilisers, measures to mitigate the effects of soil compaction, e.g. limitations on the use of machinery or the setting of stocking limits, or measures aiming to regulate the irrigation of agricultural land. Farmers who have agricultural land in Natura 2000 sites and face restrictions due to the requirements of the Habitat-Directive are eligible to receive payments for the management of these sites by the Rural Development Regulation, which helps promote environmental-friendly farming.
Explore further
Other articles
Database
- Agriculture (agr), see:
- Agriculture and environment (aei)
- Consumption of inorganic fertilisers (aei_fm_usefert)
- Agriculture and environment (aei)
- Farm structure (ef)
- Main farm indicators by NUTS 2 regions (ef_mainfarm)
- Farm indicators by agricultural area, type of farm, standard output, legal form and NUTS 2 regions (ef_m_farmleg)
- Main farm indicators by NUTS 2 regions (ef_mainfarm)
- Farm structure (ef)
- Farm structure (ef)
- Farm land use by NUTS 2 regions (ef_landuse)
- Arable crops farms by NUTS 2 regions (ef_lac)
- Plants harvested green and fallow land by NUTS 2 regions (ef_lac_greenfal)
- Arable crops farms by NUTS 2 regions (ef_lac)
- Farm land use by NUTS 2 regions (ef_landuse)
- Farm structure (ef)
- Farm structure (ef)
- Farm land use by NUTS 2 regions (ef_landuse)
- Permanent grassland by NUTS 2 regions (ef_lus_pegrass)
- Farm land use by NUTS 2 regions (ef_landuse)
- Farm structure (ef)
- Organic farming (org)
- Organic crop area by agricultural production methods and crops (from 2012 onwards) (org_cropar)
- Organic farming (org)
Thematic section
Publications
- Agriculture, forestry and fishery statistics - 2020 edition
Methodology
- Consumption of inorganic fertilisers (aei_fm_usefert_esms)
- Farm structure (ef_sims)
- Crop production (org_cropar_esms)
External links
- European Commission - Common Agricultural Policy (CAP)
- European Commission - Reduction of national emissions of atmospheric pollutants
- European Environment Agency (EEA) - Agricultural land: Nitrogen balance
- United Nations Framework Convention on Climate Change (UNFCCC)
- EU Nitrogen Expert Panel
Legislation
- Commission Communication COM(2006)508 final - Development of agri-environmental indicators for monitoring the integration of environmental concerns into the common agricultural policy
- Commission Staff working document accompanying COM(2006)508 final

