Migrant integration statistics - active citizenship
Data from September 2023 (section on naturalisation rate), October 2023 (sections on long-term residence permits).
Planned article update: 27 November 2024.
Highlights
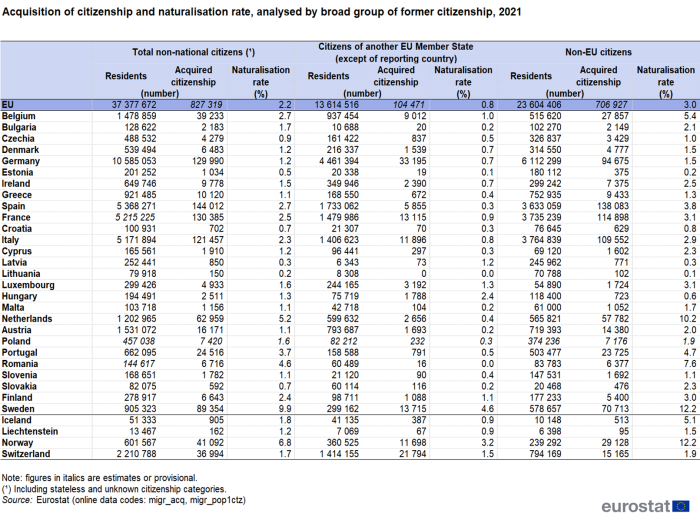
In 2021, the number of people who acquired citizenship of the EU Member State where they lived was 827 300, representing a 2.2 % naturalisation rate for the non-nationals.
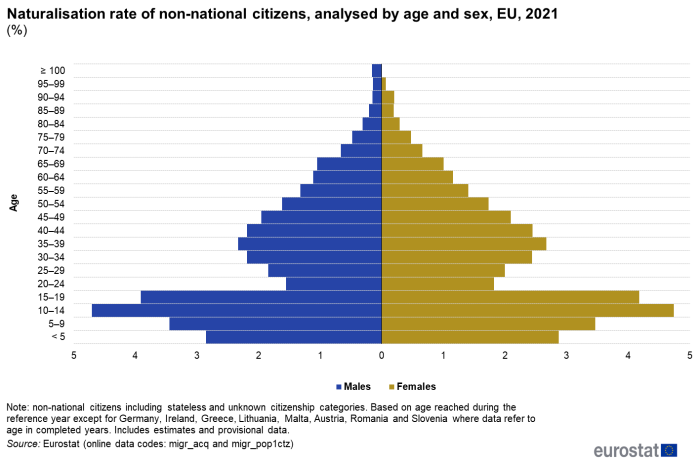
In 2021, the highest naturalisation rates in the EU were recorded for children aged 10–14 years having their usual residence in the EU: 4.7 % both for boys and for girls.
At the end of 2022, more than 12 million non-EU citizens living in the EU held long-term residency permits representing more than 50% of all residency rights held by non-EU citizens.
Naturalisation rate of non-national citizens, 2021 (%)
Active citizenship covers civic and political participation by migrants and the acquisition of equal rights and responsibilities by migrants. This article presents information for two key indicators. Both are positive indications of migrant integration and they form part of a set of Zaragoza indicators that were agreed by European Union (EU) Member States in Zaragoza (Spain) in April 2010. More specifically, the article presents Eurostat statistics on:
- the naturalisation rate, calculated as the ratio of the total number of citizenships granted over the stock of non-national population in a country at the beginning of the year;
- the share of non-EU citizens – also known as third-country citizens – having long-term residency status, calculated as the number of long-term (at least 5 years) residents who are non-EU citizens relative to the total number of non-EU citizens holding residency rights.
This article forms part of an online Eurostat publication – Migrant integration statistics - facts and figures.
Full article
Naturalisation rate
EU Member States granted citizenship to 827 300 persons having their usual residence on the EU in 2021, representing a 2.2 % naturalisation rate for the non-nationals
In 2021, some 827 300 non-national citizens acquired the citizenship of an EU Member State where they lived. This figure covers persons residing in the EU who are:
- non-EU citizens;
- citizens of another EU Member State than the Member State of residence;
- stateless persons, and;
- persons with unknown citizenship.
Citizens of non-EU Member States accounted for the overwhelming majority (85.4 %) of the total number of people granted the citizenship of an EU Member State in 2021.
In order to put these figures into context, the total number of non-national citizens living across the EU in 2021 numbered 37.4 million. Among these, 23.6 million were non-EU citizens and 13.6 million were citizens of other EU Member States. Out of the total number of non-national citizens living across the EU, 158 800 persons were either stateless or their citizenship was unknown.
Source: Eurostat (migr_acq) and (migr_pop1ctz)
The naturalisation rate is the ratio between the number of persons who acquired the citizenship of a country during a calendar year and the stock of non-national residents in the same country at the beginning of the year.
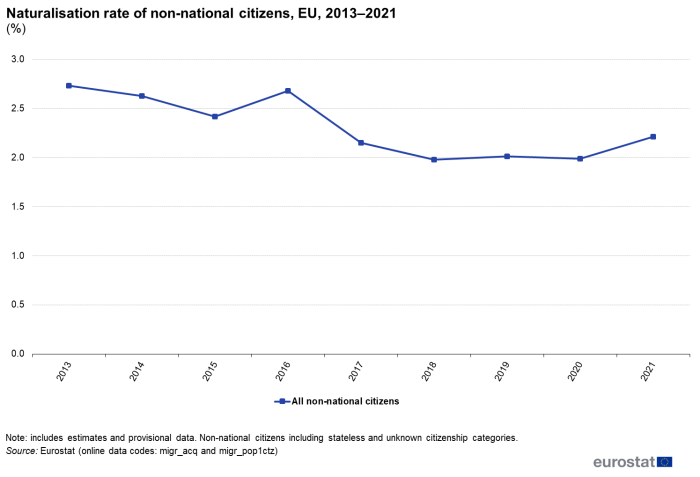
A longer analysis over time is shown in Figure 1. During the period 2013–2021, the naturalisation rate of non-national citizens in the EU (including stateless and unknown citizenship categories) ranged between 2.0 % and 2.7 %. Relative peaks were recorded in 2013 and 2016. The lowest rates were recorded in the latest years for which data are available, as the naturalisation rate fell between 2017 and 2018 from 2.1 % to 2.0 % and remained there in 2019 and 2020. In 2021, this rate rose to 2.2 %.
(%)
Source: Eurostat (migr_acq) and (migr_pop1ctz)
In absolute terms, Spain recorded the highest number of migrants being granted citizenship in 2021, with 144 000 non-nationals becoming Spaniard, while 130 400 non-nationals acquired the citizenship of France, 130 000 non-nationals acquired the citizenship of Germany and 121 500 the citizenship of Italy. The only other EU Member States that granted citizenship to more than 50 000 non-national citizens were Sweden (89 400) and the Netherlands (63 000). At the other end of the range, Cyprus, Slovenia, Malta, Croatia, the three Baltic Member States and Slovakia each granted their citizenship to fewer than 2 000 people. Lithuania granted citizenship to the lowest number (150) of non-national citizens in 2021.
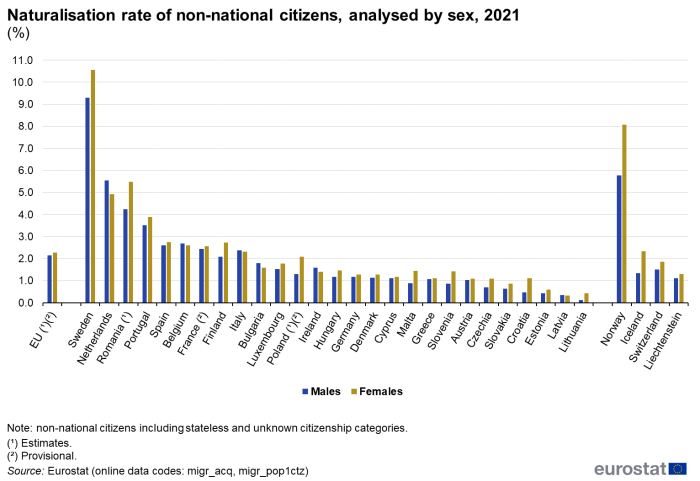
In relative terms, the highest naturalisation rates of all non-national citizens in the EU in 2021 were recorded in Sweden (9.9 %), the Netherlands (5.2 %) and Romania (4.6 %). By contrast, there were six EU Member States where the naturalisation rate of non-nationals was less than 1.0 %: Czechia, Slovakia, Croatia and the three Baltic Member States; the lowest rate was recorded in Lithuania (0.2 %).
The naturalisation rate of non-EU citizens was 3.0 %, considerably higher than the rate of citizens of other EU Member States which stood at 0.8 %
In 2021, some 85.4 % of people who acquired the citizenship of an EU Member State were formerly non-EU citizens, while 12.6 % were formerly citizens of another EU Member State; the residual share of 1.9 % was composed of stateless persons and people whose former citizenship was unknown.
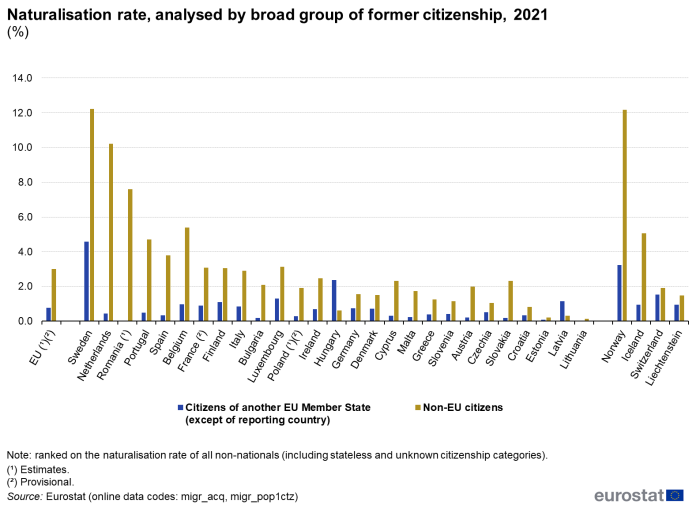
The naturalisation rate of people who were formerly non-EU citizens was 3.0 % in the EU in 2021, which was approximately four times as high as the rate recorded for people who were formerly citizens of another EU Member State (0.8 %).
Figure 2 provides a more detailed analysis and reveals that Hungary and Latvia were the only EU Member States in 2021 to record a higher naturalisation rate among people who were formerly citizens of another Member State than for people who were formerly non-EU citizens. In five of the Member States, the naturalisation rate of people who were formerly non-EU citizens was at least 10 times as high as the rate of citizens of another EU Member State, with this difference particularly large in Romania.
Hungary (2.4 %) and Latvia (1.2 %) also recorded the second and fourth highest naturalisation rates of former citizens of another EU Member State, with Sweden (4.6 %) above and Luxembourg (1.3 %) between them. Finland (1.1 %) also recorded naturalisation rates of former citizens of other Member States that were just above 1.0 %, with the remaining 22 EU Member States for which data are available below this level.
In 2021, naturalisation rates of former non-EU citizens were highest in Sweden (12.2 %), the Netherlands (10.2 %) and Romania (7.6 %), while they were lowest – below 1.0 % – in Croatia, Hungary and the Baltic Member States.
(%)
Source: Eurostat (migr_acq) and (migr_pop1ctz)
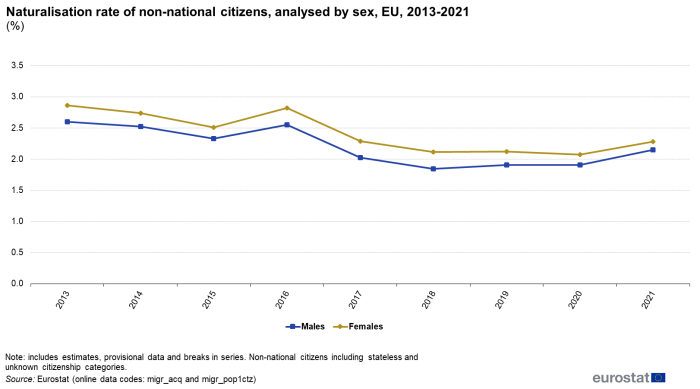
The naturalisation rate of females was slightly higher than the respective rate of males in the EU
In 2021, the naturalisation rate of non-national citizens in the EU was 0.1 percentage points (pp) higher for women (2.3 %) than it was for men (2.2 %). Looking at developments during the period 2013–2021 (see Figure 3) a slightly higher female naturalisation rate was recorded each year; the gender gap in favour of women fluctuated between 0.13 pp and 0.27 pp during this period.
(%)
Source: Eurostat (migr_acq) and (migr_pop1ctz)
A more detailed analysis of the situation in 2021 is presented in Figure 4, which confirms the results observed for the EU insofar as the naturalisation rate of all non-national females was higher than the respective rate of males in most of the EU Member States. By contrast, higher naturalisation rates of males were recorded in the Netherlands, Bulgaria, Ireland, Belgium and Italy, while in Latvia the rates of the two sexes were almost identical. Sweden and Romania recorded a gender gap that was wider than 1.0 pp. The rate of females was 1.3 pp higher than the rate of males in both countries.
(%)
Source: Eurostat (migr_acq) and (migr_pop1ctz)
The highest naturalisation rates were generally recorded among young people
Figure 5 presents an analysis of the naturalisation rates of non-national citizens by age. In 2021, the highest naturalisation rates in the EU were recorded for people aged 10–14 years, with female and male naturalisation rates of this age group equal to 4.7 %. The next highest rates were recorded in the following age groups:
- 15–19 years, with rates of 4.2 % for females and 3.9 % for males;
- 5–9 years, with rates of 3.5 % for girls and 3.4 % for boys.
While children tended to record the highest naturalisation rates, this does not necessarily mean that they accounted for the largest absolute number of people acquiring EU citizenship. A more detailed analysis of the absolute figures reveals that of the 827 300 non-nationals who acquired the citizenship of one of the EU Member States in 2021, the largest group was composed of people aged 35–39 years (96 500), followed by people aged 30–34 years (93 100) or 40–44 years (82 800). The largest five-year age group relating to children, people aged 10–14 years, accounted for the fourth highest number of non-EU citizens acquiring the citizenship of an EU Member State (79 400).
(%)
Source: Eurostat (migr_acq) and (migr_pop1ctz)
Long-term residence permits for non-EU citizens
The data presented in the rest of this article refer exclusively to non-EU citizens (as opposed to non-nationals from another EU Member State). The focus is on non-EU citizens who received a long-term residence permit for a minimum period of at least five years validity, thereby providing them with a more robust level of protection as regards their status.
The data presented cover two categories of individuals:
- non-EU citizens who held a long-term residence permit that was valid at the end of the year, in other words, the stock of long-term residence permits;
- non-EU citizens who received a new long-term residence permit issued during the course of the reference year (that was not a renewal), in other words, the flow of new long-term residence permits.
Long-term residence permits valid at the end of the year
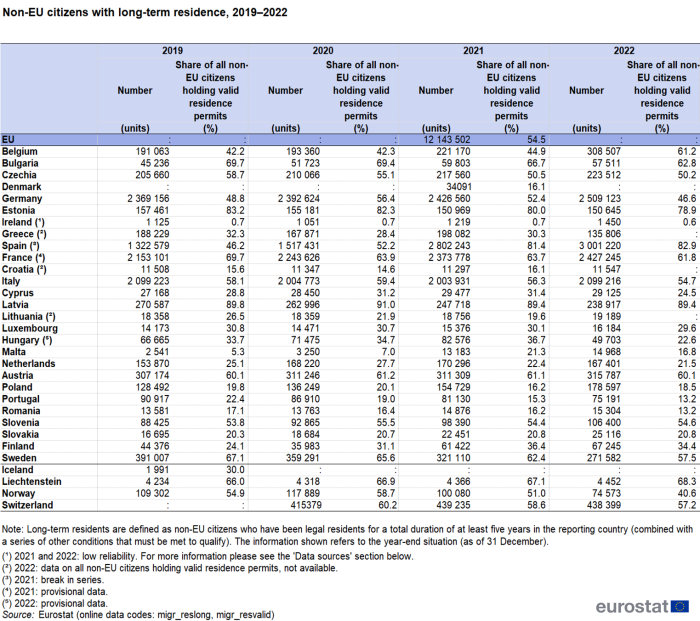
At least three out of four non-EU citizens resident in Latvia, Spain and Estonia had long-term residency
At the end of 2022, there was a noticeable difference between EU Member States concerning the share of resident non-EU citizens with long-term residence permits. Long-term residents accounted for more than three-fifths of the total number of non-EU citizens holding a residence permit in seven among 23 EU Member States with the available data, with this share reaching 78.9 % in Estonia, 82.9 % in Spain and 89.4 % in Latvia. Most long-term residents in Latvia and Estonia were classified as 'recognised non-EU citizens', a category that covers people who were neither citizens of the reporting country nor any other country, but who had established links to the country where they lived including some but not all of the rights and obligations of full citizenship. In Spain, the highest numbers of long-term residents were observed for citizens of Morocco (25.4% of all long-term residents living in Spain) and the citizens of the United Kingdom (13.5%).
By contrast, in 12 of the remaining 16 EU Member States for which data are available, less than half of all non-EU citizens had long-term residency rights. This share was particularly low in Ireland, where the smallest proportion (0.6 %) of non-EU citizens had the benefits associated with long-term residency.
Source: Eurostat (migr_reslong), (migr_resvalid) and (migr_resshare)
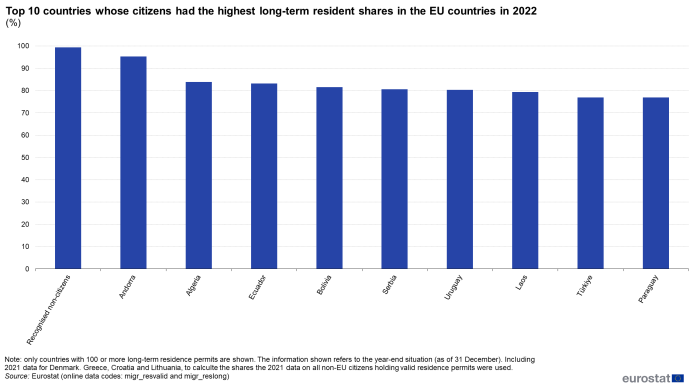
At the end of 2022, almost all 'recognised non-citizens' in the EU held long-term residence status
The focus of Figure 6 is citizenship categories with the highest shares of long-term residency rights in the EU. Note that the information presented includes 2021 data for Denmark, Greece, Croatia and Lithuania. The figure shows information on the top 10 countries whose citizens had the highest long-term resident shares in the EU countries.
(%)
Source: Eurostat (migr_resvalid) and (migr_reslong)
Almost all (99.4 %) recognised non-citizens – most of whom were living in Estonia and Latvia and originated from the former Soviet Union – had long-term residency rights. At least four out of every five citizens living in the EU from Uruguay, Serbia, Bolivia, Ecuador, Algeria and Andorra had long-term residency rights. The non-EU citizens presented within this ranking were from a disparate set of countries, some being relatively close neighbours to the EU (for example, citizens of Türkiye, Andorra or Serbia), whereas others were from much further afield (for example, citizens of Ecquador, Bolivia or Laos).
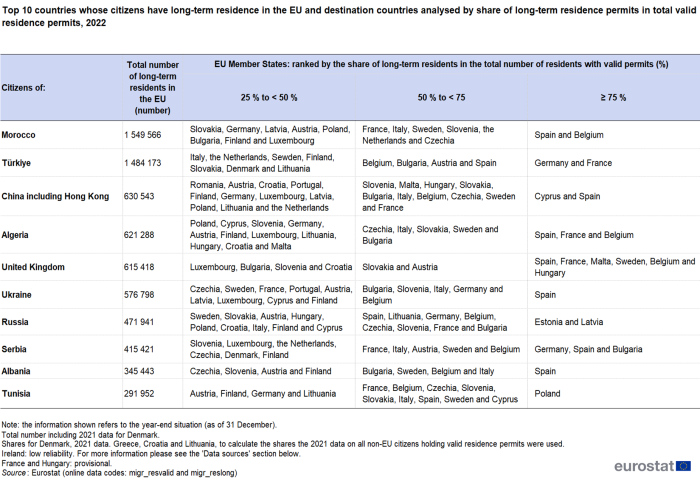
While the information presented in Figure 6 is based on a ranking of the share of non-EU citizens with long-term residency, Table 3 shows the absolute number of non-EU citizens holding long-term residency status in the EU. It shows the 10 most common groups of non-EU citizens with long-term residency status at the end of 2022. Note that the information presented includes 2021 data for Denmark, Greece, Croatia and Lithuania.
The highest number of non-EU citizens holding long-term residency rights in the EU at the end of 2022 was recorded among citizens of Morocco, followed by citizens of Türkiye (1.5 million each), while there were over 600 000 citizens from China (including Hong Kong) Algeria and the United Kingdom and over 550,000 from Ukraine with such rights. In 2022, the United Kingdom appeared in the top 10 for the second time, following its withdrawal from the EU.
Source: Eurostat (migr_resvalid), (migr_reslong) and (migr_resshare)
Table 3 also provides more information on where, among the EU Member States, the share of long-term residents in the total number of residents with valid permits from each of these groups of citizens was highest. For example, at the end of 2022, at least three-quarters of all Moroccan citizens resident in Spain and Belgium held long-term residency status. The same was true for at least three-quarters of Turkish citizens living in Germany and France. For British citizens the share of long-term residents in the total number of residents with valid permits accounted for at least three-quarters in Spain, France, Malta, Sweden, Belgium and Hungary.
By contrast, in Ireland at most 3.2 % of citizens from each of the 10 groups of citizens featured in Table 3 were considered as long-term residents.
Long-term residence permits issued during the year
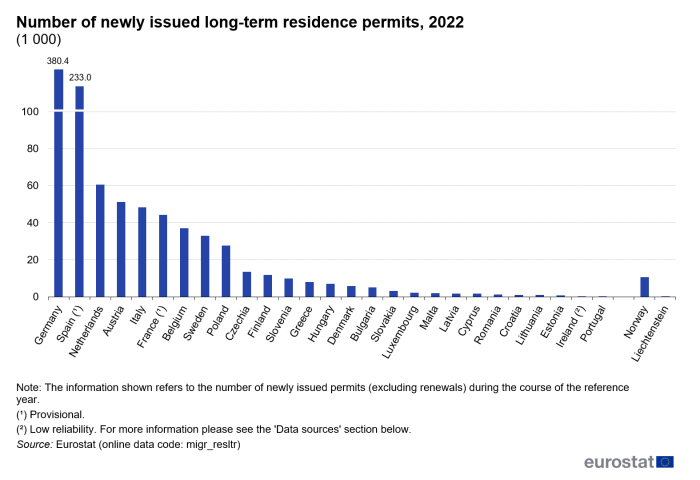
Looking at the data for 2022, Figure 7 shows that in the EU, there were 991 100 new long-term residence permits issued during 2022. To give some context to this figure, it was equivalent to 7.9 % of the total number of non-EU citizens who enjoyed long-term residency status in the same Member States (excluding Denmark).
Among the 27 EU Member States, Germany issued the highest number of long-term residence permits to non-EU citizens in 2022, some 380 000. Spain issued 233 000 long-term residence permits and two other Member States – the Netherlands and Austria – issued at least 50 000. By contrast, fewer than one thousand long-term residence permits were issued to non-EU citizens in each of Lithuania, Estonia, Ireland and Portugal.
(1 000)
Source: Eurostat (migr_resltr)
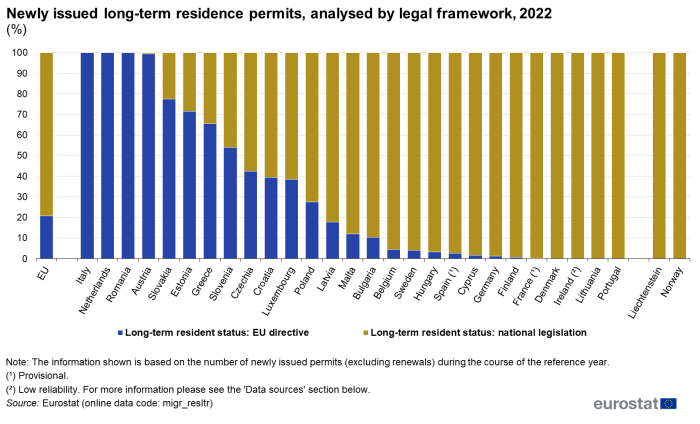
Figure 8 provides an analysis by legal framework [1] of the number of newly issued long-term residence permits.
In the EU, 20.7% of the new long-term residence permits issued in 2022 were issued under the EU's legislative framework while 79.3 % were obtained according to national legislation.
Among the EU countries, all of the new long-term residence permits in Italy, the Netherlands and Romania were issued under the EU's legislative framework. In Austria, the observed share was 99.4 %.
By contrast, the opposite was observed in Denmark, Ireland, Lithuania and Portugal, where all permits were issued according to national legislation [2], as was nearly the case in France and Finland.
(%)
Source: Eurostat (migr_resltr)
Source data for tables, figures and maps (MS Excel)
![]() Migrant integration statistics – active citizenship: tables and figures
Migrant integration statistics – active citizenship: tables and figures
Data sources
The data presented in this article are from three datasets that are received on an annual basis by Eurostat from reporting countries, having been compiled from administrative records. Note that the indicators are based on different reference periods and that the reference population varies. For example, the naturalisation rate is based on all non-nationals (including citizens of another EU Member State), while the data for long-term residency rights refer only to non-EU citizens.
Acquisition of citizenship data for the naturalisation rate
Data on the acquisition of citizenship, available from 1998 onwards, are collected from EU Member States, EFTA and candidate countries, and cover persons who were previously citizens of another country or who were stateless. From 2008 onwards, acquisition of citizenship data analysed by sex, age group and previous citizenship are collected under Article 3 of Regulation (EC) No 862/2007. Conditions for acquiring the citizenship of an EU Member State differ between countries, but often the requirements concern a period of (legally registered) residence combined with other factors such as evidence of social and economic integration, or an aptitude to speak the national language(s). The online metadata related to this data collection provides more information.
Naturalisation is one of the most common ways of acquiring citizenship. It is a formal act of granting citizenship to a non-national who applies to be a citizen. International law does not set out detailed rules on naturalisation but recognises the competence of every state to naturalise non-nationals.
The naturalisation rate is defined as the total number of non-national citizens resident in each EU Member State who acquired citizenship of that Member State during the calendar year, expressed as a ratio between the number of persons who acquired the citizenship of a country during a calendar year and the stock of non-national residents in the same country at the beginning of the year. Note this rate should be analysed with some caution, as its numerator includes all modes of acquisition (and not just the naturalisation of eligible residing non-nationals), while the denominator includes all resident non-nationals (and not just resident non-nationals who are eligible for naturalisation).
Share of long-term residence permits
Long-term residence status refers to permits issued under Directive 2003/109 concerning the status of non-EU citizens who are long-term residents. The definition concerns non-EU citizens who legally reside in an EU Member State for a period of at least 5 years; this is often combined with a series of other conditions that must be met.
From the 2008 reference year, data on residence permits are collected under Article 6 of Regulation (EC) No 862/2007, which refers to statistics on residence permits for non-EU citizens. Data are available for the EU Member States and EFTA countries. These data refer exclusively to non-EU citizens (rather than citizens of other EU Member States) who were issued with a residence permit. The statistics relate to the stock (total number) of non-EU citizens in possession of a long-term residence permit.
More information and country-specific issues are presented in the online metadata for this data collection.
Long-term residence permits issued during the year
Data on the number of new residence permits that were issued to non-EU citizens during the course of a year (the flow of new permits) are collected on a voluntary basis within the context of Article 6 of Regulation (EC) No 862/2007. This dataset is designed to complement the data collected on the stock of non-EU citizens having long-term residence status at the end of the reference period. Note that the information presented relates only to non-EU citizens who received a new long-term residence permit; the statistics shown do not take account of non-EU citizens already in possession of a permit, nor of non-EU citizens whose permits were renewed.
Note for Ireland
The "u" flag in Irish residence permit data highlights limited data quality reported by the Irish authorities. For the process of generating resident permits data that involves both the Irish Police and the Department of Justice an old information system is currently being used. The current system's limitations, which misses unique identifier of persons, require manual data checks, which may lead to potential quality issues. According to Irish authorities a comprehensive modernization programme of the information systems to ensure more accurate data management is in progress.
Symbols
Tables in this article use the following notation:
- a colon ':' is used to show where data are not available (including confidential and unreliable values).
Context
The EU is a relatively diverse area and several of its Member States have traditionally been a destination for migrants, whether from elsewhere within the EU or elsewhere in the world. The flow of migrants can lead to a range of new skills and talents being introduced into local labour markets and can increase cultural diversity, while also raising concerns about integration.
Immigrant integration policies are a national competence across the EU. However, since the signature of the Treaty of Lisbon in 2007, European institutions have the mandate to 'provide incentives and support for the action of Member States with a view to promoting the integration of third-country nationals'. In June 2016, the European Commission launched an action plan for the integration of non-EU citizens. Among other actions, the plan seeks to address active participation and social inclusion in order to promote intercultural dialogue, cultural diversity and social inclusion.
A new pact on migration and asylum was presented by the European Commission in September 2020. This sought to provide tools for faster and more integrated procedures, a better management of the Schengen area and borders, as well as flexibility and crisis resilience. The new pact on migration and asylum sets out what is intended to be a fairer, more European approach to managing migration and asylum. It aims to put in place a comprehensive and sustainable policy, providing a humane and effective long-term response to the current challenges of irregular migration, developing legal migration pathways, better integrating refugees and other newcomers, and deepening migration partnerships with countries of origin and transit for mutual benefit.
In November 2020, an Action plan on Integration and Inclusion 2021–2027 (COM(2016) 377 final) was adopted. It seeks to detail targeted and tailored support to reflect the individual characteristics that may present specific challenges to people with a migrant background, such as gender or religious background.
This article presents EU statistics in the area of active citizenship, covering the acquisition and exercising of equal rights/responsibilities for migrants, which are recognised as positive indications of migrant integration. The information presented is based on: a set of Council conclusions from 2010 on migrant integration; a subsequent study Indicators of immigrant integration – a pilot study from 2011; a report Using EU indicators of immigrant integration from 2013; and more recent data collection exercises, focusing on the naturalisation rate and the share of non-EU citizens having long-term residency status. The first of these indicators allows an analysis of migrant integration and/or recognition of the magnitude of the role that migrants play in host economies, while the second may be used to analyse the share of the migrant population living with a more protected residence status, with similar socioeconomic rights and responsibilities to those enjoyed by citizens of the host country.
For detailed information about EU policies on migrant integration, refer to migrant integration statistics introduced.
Notes
- ↑ Non-EU citizens holding long-term residency rights can be divided into two subcategories according to the legal framework under which they received their permit:
- long-term residency permits issued under the EU's legislative framework concerning the status of non-EU citizens who are long-term residents (Directive 2003/109); and
- long-term residence status as provided by national legislation.
- ↑ As Denmark and Ireland do not implement Directive 2003/109, these Member States report statistics on long-term residents under the category for national long-term resident status.
Direct access to
Online publication
Other statistical articles
- Population (national level) (demo_pop)
- Population on 1 January by age group, sex and citizenship (migr_pop1ctz)
- Acquisition and loss of citizenship (migr_acqn)
- Acquisition of citizenship by age group, sex and former citizenship (migr_acq)
- Residence permits (migr_res)
- Residence permits by reason, length of validity and citizenship (migr_resval)
- All valid permits by reason, length of validity and citizenship on 31 December of each year [migr_resvalid]
- Long-term residents by citizenship on 31 December of each year (migr_reslong)
- Long-term residents among all non-EU citizens holding residence permits by citizenship on 31 December (%) (migr_resshare)
- Long-term residence permits issued during the year (migr_resltr)
- Residence permits by reason, length of validity and citizenship (migr_resval)
- Active citizenship (mii_actctz)
- Long-term residents among all non-EU citizens holding residence permits by citizenship on 31 December (%) (migr_resshare)
- Acquisition and loss of citizenship (ESMS metadata file – migr_acqn_esms)
- Population (national level) (demo_pop) (ESMS metadata file – demo_pop_esms)
- Residence permits (ESMS metadata file – migr_res_esms)
- Council Directive 2003/86/EC of 22 September 2003 on the right to family reunification
- Council Directive 2003/109/EC of 25 November 2003 concerning the status of third-country nationals who are long-term residents
- European Commission, see
- Directorate General for migration and home affairs – legal migration and integration
- EU Immigration Portal (EUIP) (also available in Spanish, French, Portuguese and Arabic)
- European Migration Network (EMN)
- European website on integration (also available in German and French)
- New pact on migration and asylum (also available in all official EU languages)
- The 2010 Zaragoza declaration
- Using EU indicators of immigrant integration, final report by European Services Network (ESN) and the Migration Policy Group (MPG)
- International Labour Organization (ILO) – Migrant integration policy index (MIPEX)
- OECD – Migration, see: