Seasonality in tourism demand
Data extracted in November 2023.
Planned article update: 11 December 2024.
Highlights
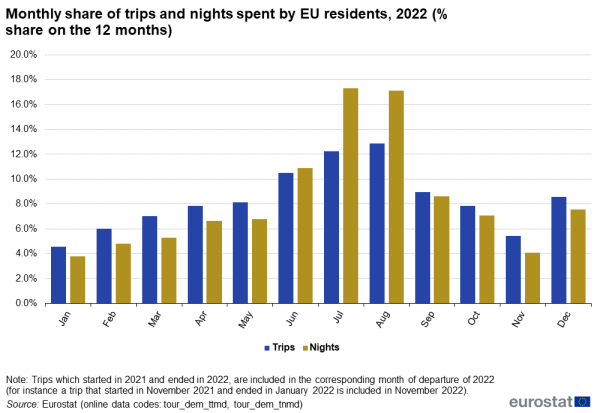
Monthly share of trips and nights spent by EU residents, 2022 (% share on the 12 months)
This article is part of the Eurostat online publication Tourism trips of Europeans, which provides statistics on tourism demand in the European Union (EU) and EFTA countries.
The article focuses on the seasonal pattern of tourism demand in the European Union (EU): trips made by EU residents and the number of nights spent on those trips (data on same-day visits is not available). Tourism demand includes all trips made, regardless of whether they were spent in tourist accommodation (such as hotels or campsites) or in less formal and often unpaid types of accommodation (such as owned dwellings or accommodation provided for free by friends or relatives).
This analysis from the point of view of the demand side complements another article on seasonality, in which the seasonal bias in the tourist accommodation sector is discussed (see article Seasonality in the tourist accommodation sector).
Full article
One in four trips of EU residents made in July or August
In 2022, tourism demand of EU residents was concentrated in the third quarter, mainly in August followed by July, when respectively 12.9 % and 12.3 % of the entire year's trips were made (see Figure 1). The number of trips in the peak month (August) was 2.8 times higher than the number of trips in the lowest month (January). Over 270 million tourism trips started in July or in August, meaning that on an average day in these months, 4.4 million Europeans were packing to leave on a trip.
Considering that the main (longest) trip in the year is often taken in summer, the seasonal pattern was even more pronounced when looking at the number of nights spent. EU residents spent more than one in three nights away in these two months, July (17.3 %) and August (17.1 %). The number of nights spent in the peak month (July) was 4.6 times higher than the number of nights spent in the lowest month (January).
Source: Eurostat (tour_dem_ttmd) (tour_dem_tnmd)
Long trips: the seasonal pattern more pronounced than for short trips
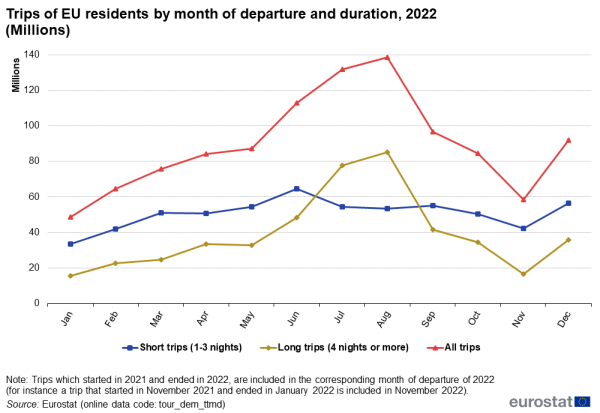
In August 2022, EU residents made 85 million long trips of at least four overnight stays. This represents 18 % of all long trips made through the entire year. Looking at the summer season from June to September, more than 50 % of all long trips in 2022 were made during these four months (see Figure 2).
The distribution of short trips over the 12 months was more evenly spread. June was the most popular month for trips between one and three overnight stays, followed by December.
Source: Eurostat (tour_dem_ttmd)
Summer and Christmas peaks more significant for domestic trips
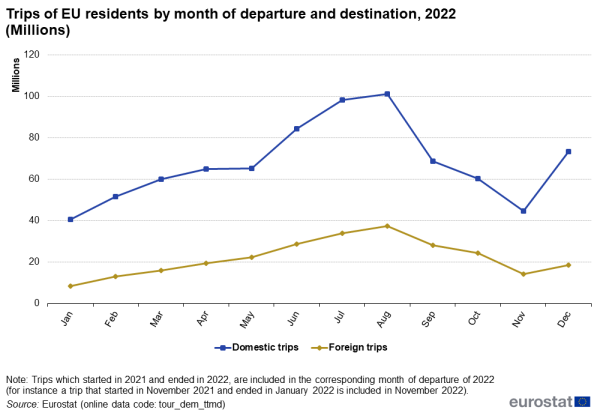
In 2022, EU residents made 812 million trips inside their own country (domestic trips) and 264 million trips abroad. The spread over the 12 months of the year is relatively comparable for domestic and foreign trips (see Figure 3) although the summer and Christmas peaks are more pronounced for the domestic ones.
The number of domestic and foreign trips made during the peak month (August) were respectively 2.5 and 4.5 times higher than those made in the lowest month (January).
Source: Eurostat (tour_dem_ttmd)
Business trips partly compensate for the lowest periods of personal trips
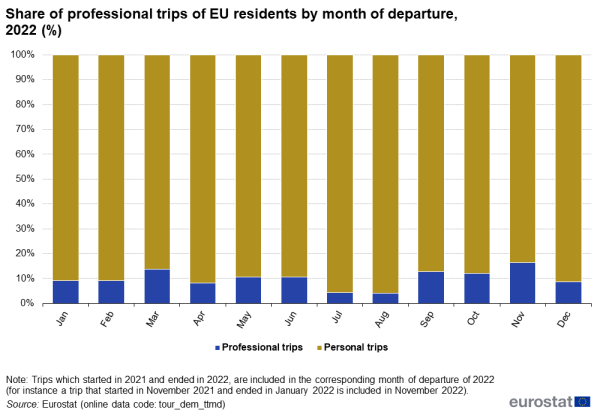
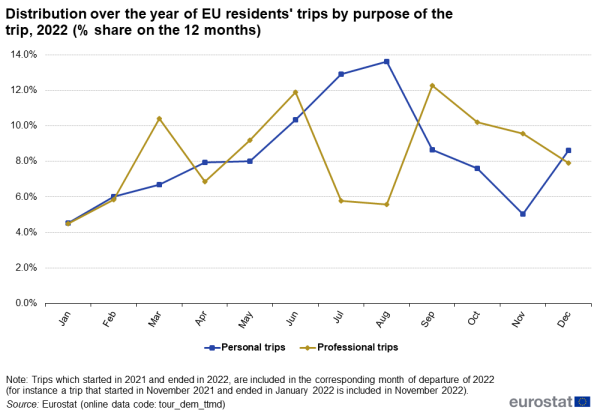
On average over the year, business trips represented 9 % of all trips made by EU residents. As shown in Figure 4, this share ranged from 16 % in November to 4 % in July and August.
Business trips showed a substantially different distribution over the year compared to personal trips, with peaks in June and September (see Figure 5), the months just before and after the main holiday season. The monthly variation ranged from 4.5 million business trips in January to 12.3 million business trips in September.
Source: Eurostat (tour_dem_ttmd)
Source: Eurostat (tour_dem_ttmd)
Europeans spend more than one third of their tourism nights in July or August
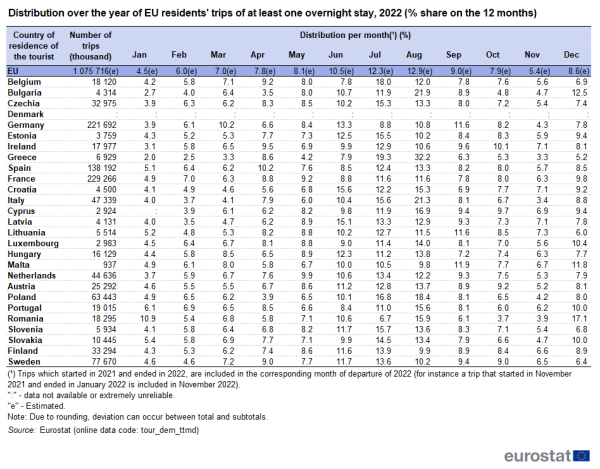
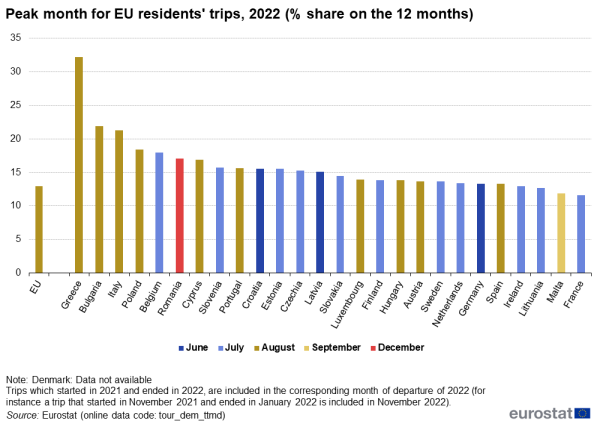
Looking at national data, July or August were the most popular months for going on holidays for residents of all but five EU Member States: Germany, Croatia, Latvia, Malta and Romania, where the peak month was June, September or December (see Table 1 and Figure 6). At EU level, one in eight trips were concentrated in just one month (August). This peak was even more pronounced in 10 EU Member States, with Greece in the top, where the residents preferred August for 32 % of their trips, followed by Bulgaria (22 %) and Italy (21 %).
Source: Eurostat (tour_dem_ttmd)
Source: Eurostat (tour_dem_ttmd)
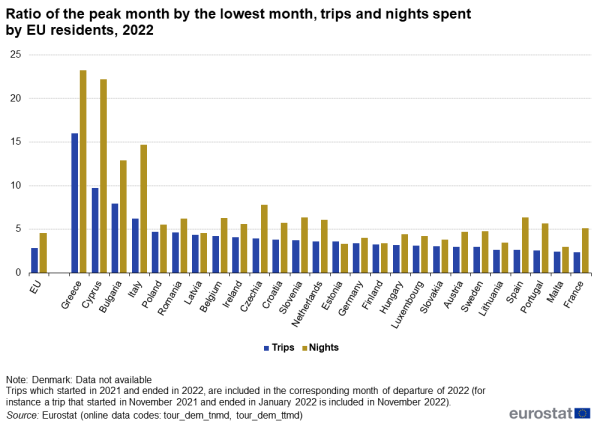
Seasonality can also be evaluated by looking at the ratio of the number of trips made during the peak month by those made during the lowest month (see Figure 7). In 2022, when Covid-19 restrictions were fully lifted, Greece came on top with the number of trips in August 16 times higher than in January (the lowest month). The lowest seasonality was found in France and Malta, where this ratio was only 2.4.
Source: Eurostat (tour_dem_tnmd) (tour_dem_ttmd)
When taking into account the duration (nights spent) rather than the number of trips, seasonality was more pronounced: the peak month for tourism nights of residents of all but two EU countries was either July or August. The only exceptions were Germany and Malta, where the peak months were June and September respectively (see Table 2 and Figure 8).
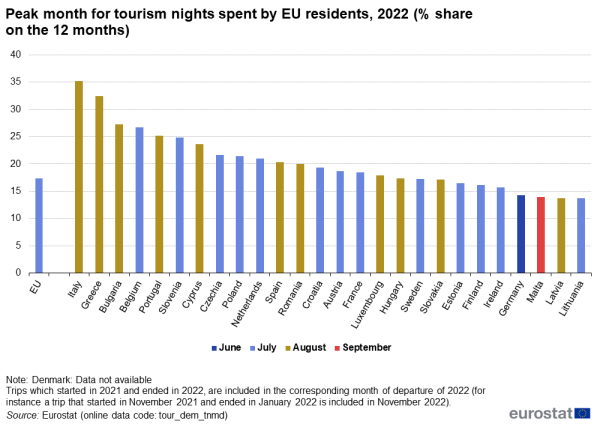
Source: Eurostat (tour_dem_tnmd)
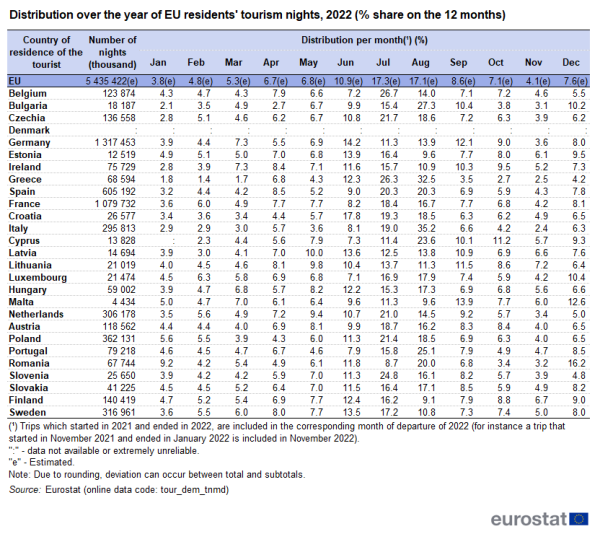
Source: Eurostat (tour_dem_tnmd)
During the two summer months of July and August, EU residents spent more than one third of all tourism nights spent in 2022. For the Greek tourists this share was 59 %, followed by Italians (54 %) and Bulgarians (43 %).
By dividing the number of nights spent by the number of trips that were made each month, the average length of stay of the trips is calculated. In 2022, EU residents made the longest trips (7.1 nights on average) in July, followed by August with 6.7 nights on average (see Table 3).
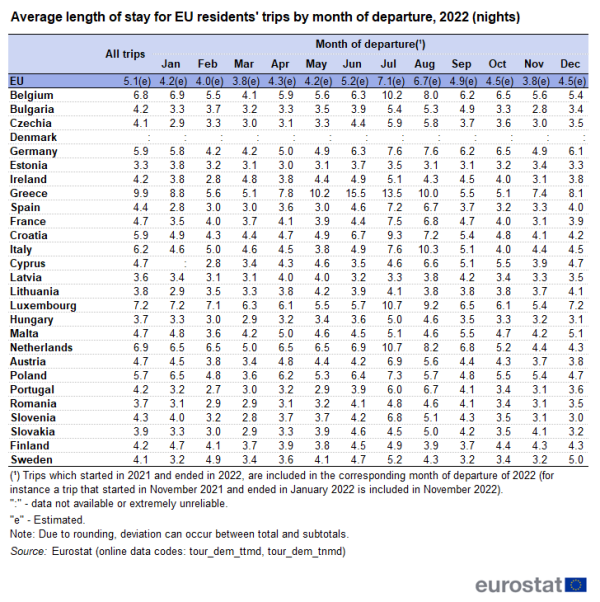
Source: Eurostat (tour_dem_ttmd) (tour_dem_tnmd)
More than one in four EU residents' tourism nights in the months in between the bottom and peak season are spent by older people aged 65 years and over
Looking at the age of the tourist, 23 % of all tourism nights in 2022 were spent by Europeans aged 65 years and over. Compared with the seasonal pattern of nights spent by the other age groups, these nights were more evenly spread throughout the year. The July and August peak was a bit less pronounced, representing 29 % of the entire year's tourism nights, while for the other age groups this share was on average 36 % (see Figure 9). People aged 65 years and over were more likely to travel during the shoulder season (March to June and September to November, i.e. the months in between the bottom and peak season).
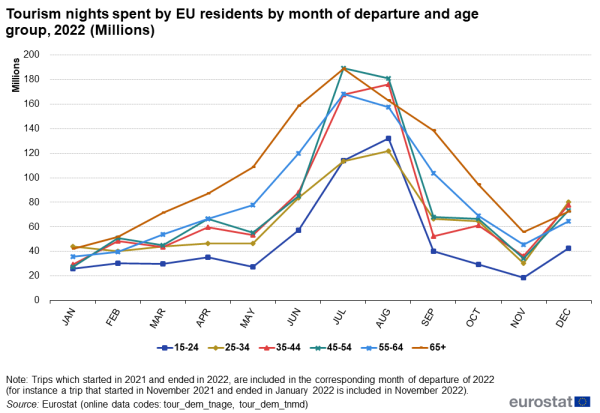
Source: Eurostat (tour_dem_tnage) (tour_dem_tnmd)
At least 25 % of all the nights spent in March, May, June, September, October and November were spent by older tourists aged 65 years and over, with May and September reaching 29 % (see Figure 10).
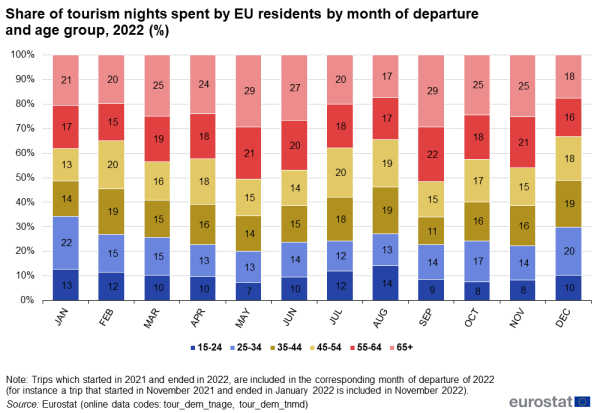
Source: Eurostat (tour_dem_tnage) (tour_dem_tnmd)
Participation of children
On average in 2022, for 22 % of the trips made by Europeans aged 15 or more, the travel group included children aged less than 15 years (see Figure 11).
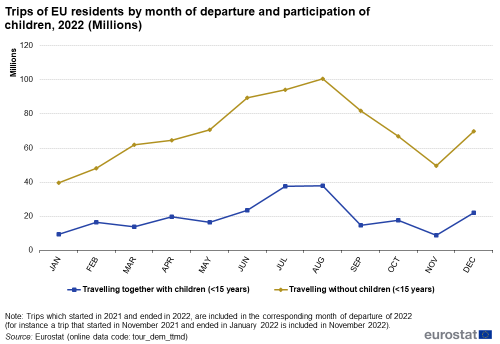
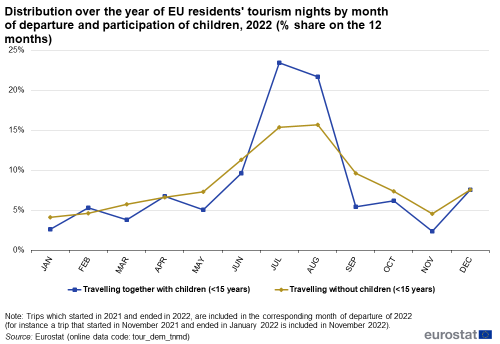
Such trips had a significant impact on the overall seasonality of tourism. Figure 12 shows their high concentration, in terms of nights spent, in July and August, the main school summer holiday months: nearly half (45 %) of these nights were spent during these two months while for trips where no children were participating, this share was 31 %.
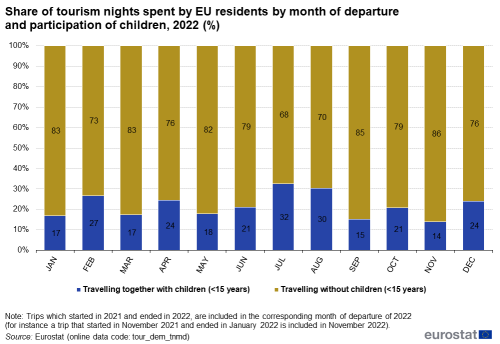
Nearly one in three tourism nights spent by Europeans in July and August (32 % and 30 %, respectively), were spent by tourists whose travel group included children aged less than 15 years (see Figure 13).
Source data for tables and graphs
Data sources
Collection of annual data on trips of EU residents
The collection consists of harmonised data collected by the Member States in the frame of the Regulation (EU) No 692/2011 of the European Parliament and of the Council concerning European statistics on tourism.
The scope of observation for data on tourism trips are all tourism trips with at least one overnight stay, made by the resident population aged 15 and over. It includes trips made for private or professional purpose, outside the usual environment.
Context
The EU is a major tourist destination, with four Member States among the world's top ten destinations for holidaymakers, according to UNWTO[1] data. Tourism is an important activity in the EU which has the potential to contribute towards employment and economic growth, as well as to development in rural, peripheral or less-developed areas. These characteristics drive the demand for reliable and harmonised statistics within this field, as well as within the wider context of regional policy and sustainable development policy areas.
Direct access to
- Tourism (t_tour), see: "Annual data on trips of EU residents (t_tour_dem)".
- Tourism (tour), see "Trips of EU residents - annual data".
- Trips of EU residents - annual data (ESMS metadata file — tour_dem_esms)
- With 2012 as reference year:
- Regulation (EU) No 692/2011 of 6 July 2011 concerning European statistics on tourism and repealing Council Directive 95/57/EC. (Summary)
- Regulation (EU) No 1051/2011 of 20 October 2011 implementing Regulation (EU) No 692/2011 concerning European statistics on tourism, as regards the structure of the quality reports and the transmission of the data.
- Previous legal acts (concerning reference periods before 2012):
- Directive 95/57/EC of 23 November 1995 on the collection of statistical information in the field of tourism.
- Commission Decision 1999/35/CE of 9 December 1998 on the procedures for implementing Council Directive 95/57/EC on the collection of statistical information in the field of tourism.
- Commission Decision 2004/883/CE of 10 December 2004 adjusting the Annex to Council Directive 95/57/EC on the collection of statistical information in the field of tourism as regards country lists.
- Directive 2006/110/EC of 20 November 2006 adapting Directives 95/57/EC and 2001/109/EC in the field of statistics, by reason of the accession of Bulgaria and Romania.
- Agenda for a sustainable and competitive European tourism (Communication from the European Commission, October 2007)
- European Commission - Directorate-General for Internal Market, Industry, Entrepreneurship and SMEs - Tourism