Archive:Statistics on European cities
Data extracted in March 2019.
Planned article update: September 2022.
Highlights
The highest young-age dependency ratio for cities in the EU was recorded in the Communauté d’agglomération Val de France, near Paris (58.4 %).
The highest old-age dependency ratio for cities in the EU was recorded in the French resort of Fréjus (63.7 %).
More than half the world’s population resides in urban areas: cities continue to attract an increasing share of people in search of a job and an improved quality of life. Indeed, cities are often seen as centres of economic growth, providing opportunities for study, innovation and employment; poles of economic activity that attract a broad spectrum of people (be they national or international migrants). This is particularly true for capital cities, which are often characterised by particularly high concentrations of economic activity, employment and wealth. Yet, there is often a paradox insofar as some cities also display very high levels of social exclusion, unemployment and income disparity, while some cities may be confronted by issues such as crime, traffic congestion or pollution. Furthermore, within individual cities it is possible to find people who enjoy a very comfortable lifestyle who are living in close proximity to others who face considerable challenges.
This expansion of population numbers both within and around some of the metropolises in the European Union (EU) — sometimes referred to as urban sprawl — is accompanied by a range of complex challenges, such as issues relating to sustainability, social cohesion, an ample supply of housing, or the provision of efficient transport services. After looking at the size and age structure of the population of cities, this chapter subsequently focuses on two areas: living conditions (including information on the risk of poverty or social exclusion and housing costs) and labour markets.
Full article
Population
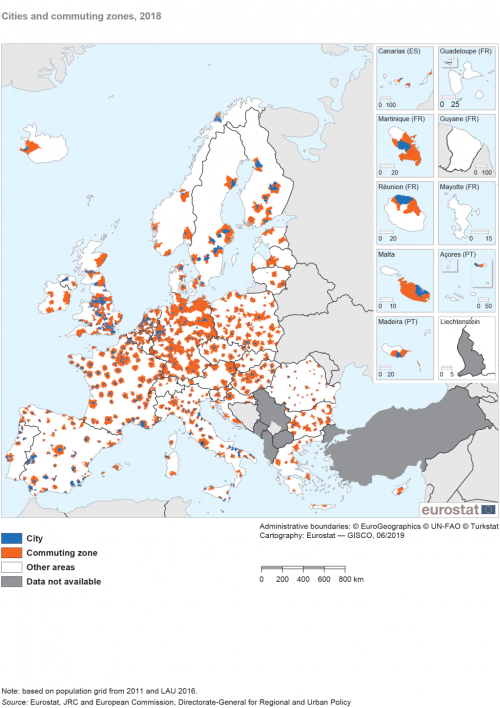
Population statistics presented in this chapter are principally based on cities, with some additional information for commuting zones — these are shown in Map 1. Statistics for cities refer to the total number of inhabitants according to their usual residence, in other words, the place where a person normally lives, regardless of temporary absences; this is generally their place of legal or registered residence. Population numbers are a reference for measuring the general size of an urban entity and are used as a denominator for many derived indicators. Detailed information concerning the definition of concepts for cities and other urban entities is provided in Chapter 3 of a methodological manual on territorial typologies.
Although population numbers in and around some of the EU’s largest cities are often growing at a fast pace, there are other cities in the EU, for example, those characterised by their location in former industrial heartlands, where population numbers are in decline.
The EU has a diverse mix of cities: at one end of the scale are the global metropolises of London in the United Kingdom and Paris in France, while approximately half of the cities in the EU had a relatively small urban centre of between 50 000 and 100 000 inhabitants. Many of the EU’s largest cities (especially capital cities) attract both national and international migrants and their population numbers therefore tend to increase at a faster pace than national averages.
Cities in Belgium, the Netherlands, western parts of Germany, northern Italy and the southern half of the United Kingdom are often close together
One of the most striking aspects of the distribution of cities across some parts of the EU is their close proximity to each other: this can be seen over much of Belgium, the Netherlands, western parts of Germany, northern Italy and the southern half of the United Kingdom. By contrast, the Nordic EU Member States, France and the interior of Spain and Portugal are characterised by a more sparse distribution of cities over a greater area.
These differences in spatial distribution may reflect levels of centralisation. On one hand, there are EU Member States like France which appear to have a relatively monocentric structure based on Paris. This may be contrasted with the polycentric structure of cities that is observed in Germany, where there is no single dominant city and many administrative and/or legislative functions are undertaken at the level of regional Länder.
Figure 1 compares the overall size of the 20 largest functional urban areas in the EU, as well as presenting the relative importance — in population terms — between cities and their surrounding commuting zones.
Milano in northern Italy was the largest functional urban area in the EU that did not contain a capital city
In 2017, 9 of these 20 functional urban areas contained capital cities: the largest area that was not centred upon a capital city was Milano in northern Italy. Six of the top 20 functional urban areas were in Germany, four in the United Kingdom, three in Italy and two in Spain. Budapest in Hungary was the only functional urban area from the eastern EU Member States that figured in the list and there were none from the northern Member States.
The largest populations in functional urban areas of the EU in 2017 were recorded in Paris (12.8 million; 2015 data) and London (12.1 million), followed — at some distance — by Madrid (Spain; 6.6 million). The next largest concentrations of population — all with 5.1 million inhabitants — were in Berlin (Germany), Milano (Italy) and the German urban agglomeration of the Ruhrgebiet (which includes, among others, Bochum, Dortmund, Duisburg, Essen and Oberhausen).

(million inhabitants)
Source: Eurostat (urb_cpop1) and (urb_lpop1)
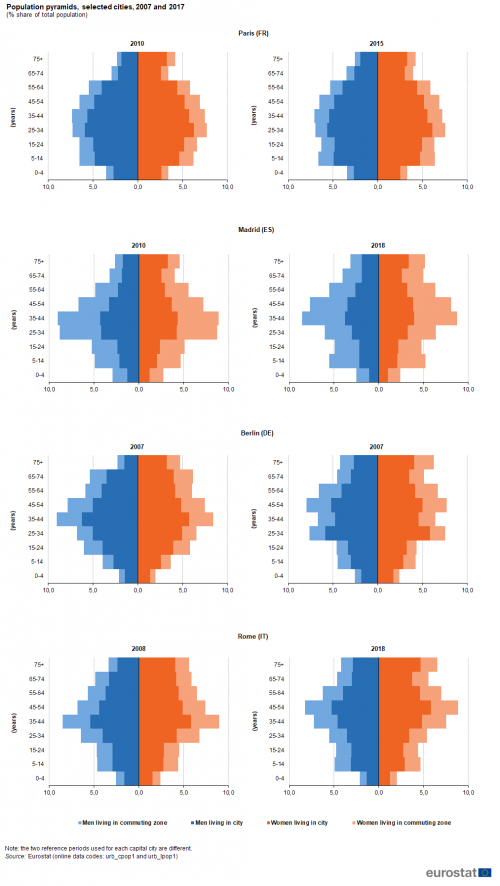
Figure 2 shows examples of how the age structure of the population varies across four capitals in the EU. Looking at developments for the total number of residents living in these four capitals, the fastest growth was recorded in Roma, with the number of inhabitants living within the city boundaries rising overall by 11.7 % between 2008 and 2018, while an even higher rate of change (14.4 %) was recorded among those living in the neighbouring commuting zone. The number of residents living in the commuting zone around the Spanish capital of Madrid also grew at a rapid pace, up by 9.8 % overall between 2010 and 2018 (note that the time interval is shorter than for Roma); this was in stark contrast to the situation within the city boundaries, where the number of residents fell by 1.5 %. The populations of the French and German capitals of Paris and Berlin grew at a more modest pace — with an increase in the number of residents living both within their city boundaries and their neighbouring commuting zones.
In Madrid, the share of the population aged 15-44 years fell between 2010 and 2018, while the share of older age groups increased
The statistics presented in Figure 2 cover two reference years for each city: the darker colours — next to the central axis — show the share of the resident population in each functional urban area that was living within city boundaries, while the lighter colours show the share of the resident population living within the commuting zone.
- In Paris: the commuting zone accounted for a relatively small part of the total population. The population grew older between 2010 and 2015, with the share of the population aged 65-74 increasing notably; this increase was observed both within the city and the commuting zone.
- In Madrid: there was a particularly large fall in the share of the population aged 25-34 years; this age group accounted for 17.6 % of the population in 2010 but just 12.4 % in 2018. The neighbouring age groups — 15-24 years and 35-44 years — also recorded a fall in their shares, with all of the older age groups (from 45-54 years upwards) recording an increase in their shares.
- In Berlin: the share of the population aged 15-24 years, 35-44 years and 65-74 years all fell between 2007 and 2017, while the shares of all other age groups increased, most strongly in the age groups 75 years and over and 25-34 years.
- In Roma: the share of the population aged 25-34 years and 35-44 years fell, as did the shares of the youngest age group (0-4 years) and one of the older age groups (65-74 years). The largest increase was recorded for the share of those aged 45-54 years.
(% share of total population)
Source: Eurostat (urb_cpop1) and (urb_lpop1)
Cities with the highest young-age dependency ratios were often characterised by relatively large populations of manual workers and/or migrant populations …
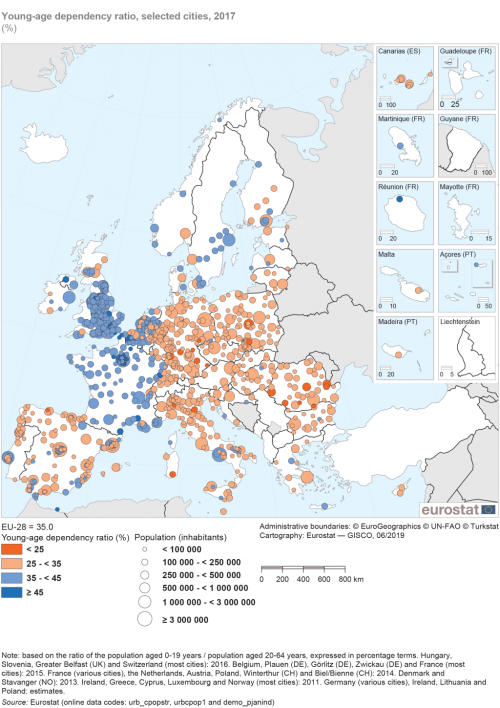
Map 2 provides information on the age structure of 919 cities in the EU and a further 16 cities in Norway and Switzerland. The size of the circles shows how large each city is in terms of its overall number of inhabitants, while the shading reflects the young-age dependency ratio, in other words the ratio between the number of young people aged 0-19 years and the number of working-age people (defined here as persons aged 20-64 years).
Across the EU-28 as a whole, the young-age dependency ratio was 35.0 % in 2017. The highest ratio was 58.4 % (2014 data) in Communauté d’agglomération Val de France, near Paris (France), while the joint lowest ratio was 22.6 % in Würzburg (Germany), Cagliari (Italy) and Braila (Romania).
The age structure of EU cities was somewhat skewed insofar as 556 recorded ratios that were below the EU-28 average, compared with 358 that had higher than average young-age dependency ratios; five cities had the same ratio. These figures are influenced, at least to some degree, by fertility patterns, with falling crude birth and fertility rates often associated with a decision to delay parenthood, have smaller families, or have no children. This pattern may be particularly common in cities which are characterised by large student populations or cities which attract graduate labour, as these young people are more likely to choose to delay parenthood in order to first establish a career.
Young-age dependency ratios were highest in a large number of cities in France (2014 or 2015 data) and the United Kingdom. The only city with a ratio of 45.0 % or higher that was not in these two EU Member States was the atypical case of the autonomous Spanish city of Melilla.
… while many of the cities with low shares of young people were in Germany or Romania
In Germany, Cyprus (2011 data), Lithuania, Luxembourg (2011 data), Malta, Austria, Poland (2014 data), Romania, Slovenia (2016 data) and Slovakia — every city had a young-age dependency ratio that was below the EU-28 average. Around two thirds of the 19 cities with the lowest ratios (below 25.0 %) were in Romania or Germany.
(%)
Source: Eurostat (urb_cpopstr), (urbcpop1) and (demo_pjanind)
Map 3 complements Map 2, providing information on the old-age dependency ratio, in other words the ratio between the number of people aged 65 years and over and the number of people aged 20 to 64 years. Across the EU-28 as a whole, the old-age dependency ratio was 32.5 % in 2017.
The existence of greater opportunities for higher education and employment offered by many large cities might lead to a lower old-age dependency ratio. Equally, it is conceivable that older persons (aged 65 and over) might be tempted to move away from capital and other large cities for their retirement, in order to avoid some of the perceived disadvantages often associated with living in big cities, such as congestion, crime and a higher cost of living. Furthermore, in many countries coastal destinations attract older people. However, some cities in the EU have a relatively high proportion of older people because of an outflow of younger people, reflecting in some cases the high cost of property (for rent or to buy) in many city centre locations and in other cases limited educational and/or employment opportunities.
A majority of cities across the EU with an old-age dependency ratio of at least 45 % were in Italy, Germany or France, with the highest rates often in coastal cities or in eastern Germany
The highest old-age dependency ratio was recorded in the French resort of Fréjus (63.7 %; 2015 data). There were seven other cities where this rate reached or exceeded 50.0 %:
- the coastal cities of Cannes (2014 data) in France, Savona, Genova and Trieste in Italy, and Waveney (which includes Lowestoft) in the United Kingdom;
- Dessau-Roßlau and Görlitz in eastern Germany, the former between Leipzig and Berlin and the latter on the border between Germany and Poland.
In 2017, the majority (26 from 34) of the EU cities with an old-age dependency rate of 45.0 % or more (as shown by the darkest shade of blue in Map 3) were located in Italy (12 cities), Germany (eight cities) or France (six cities; 2014 or 2015 data). The other cities were in Spain, the United Kingdom (three each), Belgium (2015 data) and Portugal (one each).
Aside from in Germany (where all but one of these cities were in eastern Germany), the cities with relatively high old-age dependency ratios were often located close to a coastline — including popular retirement destinations — with several on the Italian Adriatic coast or the Mediterranean coast in an area running from southern France into northern Italy. Among some of the largest cities in the EU — those with a population of at least 500 000 inhabitants —old-age dependency ratios of at least 45.0 % were recorded in Genova (north-west of Italy) and Nice (2015 data; south-east France).
Relatively few old persons living in satellite cities around the Spanish and French capitals
In 2017, there were 57 cities across the EU with an old-age dependency ratio that was less than 20 % (as shown by the lightest shade in Map 3). The two lowest old-age dependency ratios were in Rivas-Vaciamadrid and Valdemoro (9.9 % and 13.6 % respectively), both close to Madrid; there were several other cities with relatively low old-age dependency ratios around the Spanish capital. A similar situation was observed in a number of smaller cities around Paris. Several reasons may underlie these patterns: young people may be unable to afford to buy or rent in city centres (especially in capital cities) and instead live in the surrounding areas; families may move to the suburbs to have additional (and more affordable) living space; older people may move out of the suburbs to retire to the countryside or coast.
These 57 cities with the lowest old-age dependency ratios were concentrated principally in Spain (14 cities), Romania (13 cities), France (11 cities), the Netherlands (2014 data), Poland (2014 data) and the United Kingdom (four cities each).

(%)
Source: Eurostat (urb_cpopstr), (urbcpop1) and (demo_pjanind)
Socioeconomic conditions
The remaining analyses in this chapter — based on Figures 3 to 7 — present several indicators concerning living conditions and the labour market, each presented by degree of urbanisation. Detailed information concerning the definition of concepts used for assessing the degree of urbanisation is provided in Chapter 2 of a methodological manual on territorial typologies.
In western Member States, the risk of poverty or social exclusion tended to be higher in cities, whereas in eastern Member States it was usually higher in rural areas
One of the five headline targets for the Europe 2020 strategy is to lift at least 20 million people in the EU out of the risk of poverty or social exclusion by 2020 (compared with the number in 2008). The same indicator is also used within the sustainable development goals (SDGs) and to track the progress being made in relation to the European pillar of social rights, which aims to build a more inclusive and fairer EU.
People at risk of poverty or social exclusion are in at least one of the following situations:
- at risk of poverty after social transfers (income poverty);
- severely materially deprived; or
- living in households with very low work intensity.
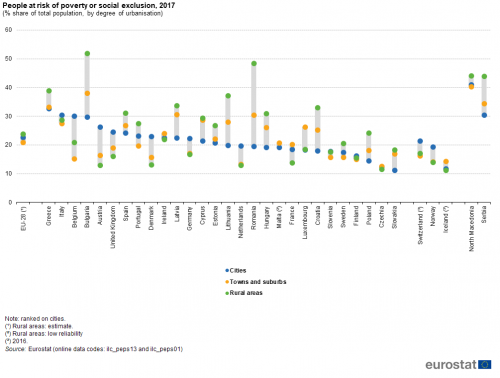
In 2017, almost one quarter (22.4 %) of the EU-28 population was living at risk of poverty or social exclusion. An analysis by degree of urbanisation (see Figure 3) reveals that people living in towns and suburbs had the lowest risk of poverty or social exclusion (21.0 %), a share which was 22.6 % for city-dwellers and peaked at 23.9 % among people living in rural areas.
In half (14) of the EU Member States, the highest proportion of people living at risk of poverty or social exclusion in 2017 was recorded in rural areas; these 14 Member States were located in eastern (six), southern (four) or northern (four) parts of the EU. A closer examination reveals that more than half of the rural population was at risk of poverty or social exclusion in Bulgaria (51.9 %), while the share was only slightly lower in Romania (48.5 %).
In nine EU Member States the proportion of people at risk of poverty or social exclusion in 2017 was higher in cities than elsewhere: a majority of these were located in western parts of the EU —Belgium, Austria, the United Kingdom, Germany and the Netherlands. As such, western European cities were often characterised by an urban paradox, insofar as while they generated high levels of wealth, they also commonly reported that relatively large shares of their populations were living with the risk of poverty or social exclusion.
(% share of total population, by degree of urbanisation)
Source: Eurostat (ilc_peps13) and (ilc_peps01)
People living in cities often paid a premium for living centrally or in a particular borough/district; this meant they were more likely to face a considerable burden from the cost of their housing
Housing is often the largest single item in a household budget, irrespective of whether the occupants are paying off a mortgage/loan or renting a property. While housing costs are not directly a component of the risk of poverty or social exclusion, they may indirectly play a role: high housing costs can result in households having only a limited budget available for other expenditure, leading to material deprivation. Real estate prices and rents vary considerably, not just between and within EU Member States, but also at a more local level.
The housing cost overburden rate is defined as the share of the population that is living in a household where total net housing costs were greater than 40 % of disposable income. The EU-28 housing cost overburden rate averaged 10.4 % in 2017: an analysis by degree of urbanisation reveals that this burden was lowest in rural areas (7.8 %), with a slightly higher rate recorded for people living in towns and suburbs (9.8 %) and a peak among those living in cities (12.5 %) — see Figure 4. Note that people living in cities are often prepared to pay more for less space in order to live centrally or in a location with particular amenities or transport connections. This pattern has led to the gentrification (displacement of lower-income families as a result of rising property prices) of some inner city areas and considerable changes in their demographic and social make-up. In a similar vein, popular rural or coastal locations may also experience high property prices, especially when supply is constrained by local planning authorities seeking to maintain the original character of an area.
In five EU Member States — Greece, Bulgaria, Romania, Germany and the United Kingdom — the share of the rural population in 2017 that was overburdened by the cost of housing was in double-digits; particularly high rates were observed in Greece (31.9 %) and Bulgaria (20.4 %). Furthermore, there were seven Member States where a double-digit share of the population living in towns and suburbs was overburdened by housing costs, with Greece (42.2 %) and Bulgaria (19.2 %) again recording particularly high shares.
By contrast, the share of the population living in cities that was overburdened by housing costs exceeded 10.0 % in half (14) of the EU Member States in 2017. Again, Greece had the highest share (43.7 %), approximately double the next highest in Denmark (22.4 %), which was followed by Germany (17.9 %) and Bulgaria (17.7 %).
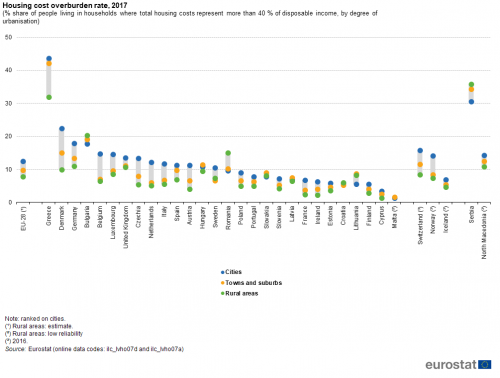
(% share of people living in households where total housing costs represent more than 40 % of disposable income, by degree of urbanisation)
Source: Eurostat (ilc_lvho07d) and (ilc_lvho07a)
Within cities, all northern Member States reported relatively high employment rates and all southern Member States relatively low ones
In a majority of the eastern EU Member States, cities tended to outperform rural areas economically and record some of the highest rates of economic growth. By contrast, in some western Member States — for example, Belgium, France or the United Kingdom — it was common to find a number of cities had been ‘left behind’ by globalisation; places that developed rapidly during the industrial revolution but which subsequently did not adapt when their traditional activities moved elsewhere or were replaced by new technologies. These differences are often reflected in labour market indicators such as the employment and unemployment rates.
The Europe 2020 target for the employment rate (the ratio of employed persons compared with the population of the same age group) is to ensure that 75 % of people aged 20-64 years are employed by 2020. This age range provides some compatibility taking account of different practices concerning the proportion of young persons remaining within education systems as well (statutory) retirement or pension ages across the EU.
Across the EU-28, the employment rate for people aged 20-64 years stood at 72.1 % in 2017. There was very little difference between the rates recorded for the three different degrees of urbanisation: they ranged from 72.0 % in cities and 72.1 % in towns and suburbs to 72.6 % in rural areas. Northern EU Member States reported employment rates that were above the average for the whole of the EU-28 (72.1 %), with Sweden reporting the highest rate of all (81.8 %). Equally, most southern Member States reported below average employment rates, with Italy (62.3 %) and Greece (57.8 %) recording the lowest.
Considering just the data for cities, a similar pattern emerges, with all northern Member States reporting relatively high employment rates in 2017 (74.3 % in Finland was the lowest) and all southern Member States reporting relatively low rates (72.9 % in Portugal was the highest). The highest employment rate for people living in cities was 82.0 % for Lithuania while in Greece the rate was 25.7 percentage points (pp) lower, at 56.3 %.
In most of the western Member States the lowest employment rates were recorded in cities, while in eastern Member States the highest rates were in cities
In 2017, 12 of the EU Member States recorded their highest employment rate within rural areas: these included most of the western Member States (neither Luxembourg nor the United Kingdom), the three Nordic Member States [1], Greece, Malta and Slovenia. In Belgium, the employment rate for cities was 8.5 pp lower than for either of the other two degrees of urbanisation, while in Austria the difference was 7.4 pp.
By contrast, in nearly all of the eastern Member States, as well as in two of the Baltic Member States and three southern Member States (Cyprus, Spain and Italy) the highest employment rates in 2017 were recorded for cities. In Luxembourg, the employment rate for cities was 6.8 pp higher than for either of the other two degrees of urbanisation, while in Croatia, Lithuania and Romania the difference was also more than 5.0 pp.
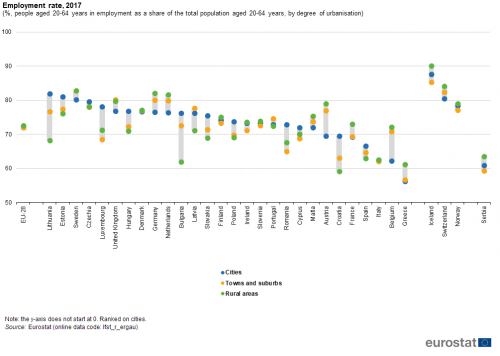
(%, people aged 20-64 years in employment as a share of the total population aged 20-64 years, by degree of urbanisation)
Source: Eurostat (lfst_r_ergau)
In all of the eastern Member States, except for Czechia, the lowest shares of people living in households with very low work intensity were in cities
An issue closely related to the employment rate is work intensity: this refers to the ratio between the number of months that household members of working age (18-59 years, not being a student aged 18-24) were employed during the income reference year and the total number of months that the same household members could theoretically have worked. People living in households with very low work intensity are defined as persons aged 0-59 years living in households where the adults worked 20 % or less of their total potential during the previous 12 months. Households composed only of children, of students aged less than 25 years and/or people aged 60 years or more are completely excluded from the calculation.
Just less than one tenth (9.5 %) of the EU-28 population aged 0-59 years lived in households with very low work intensity in 2017. In rural areas the rate was 8.2 %, in towns and suburbs it was 9.0 % and in cities it was 10.8 % (see Figure 6). As such, cities combined the lowest employment rate with the highest share of people living in households with low work intensity, while the reverse was true for rural areas.
Among the EU Member States, the lowest shares of people living in households with very low work intensity in 2017 were recorded in several eastern Member States, Estonia and Luxembourg. The lowest shares were 5.4 % in Slovakia and 5.5 % in Czechia, while the highest shares were 15.6 % in Greece and 16.2 % in Ireland. Focusing on the part of the population living in cities, Slovakia again recorded the lowest share of people living in households with low work intensity (1.9 %), while Greece and Ireland (both 16.2 %) again recorded high shares, although these were notably smaller than in Belgium (20.9 %).
Rural areas had the highest shares of people living in households with very low work intensity in 2017 in 13 EU Member States, including all of the eastern and northern Member States except for Czechia, Denmark, Romania and Finland, as well as three southern Member States (Spain, Cyprus and Portugal), but none of the western Member States. Cities recorded the highest shares of people living in households with very low work intensity in most of the western EU Member States (not France, Ireland or Luxembourg), as well as in two of the southern and Nordic Member States (Italy, Malta, Denmark and Finland). Aside from Belgium (mentioned above), the share of people living in households with very low work intensity was more than 5.0 pp higher for cities than for either of the other two degrees of urbanisation in Austria, the Netherlands, the United Kingdom and Germany.
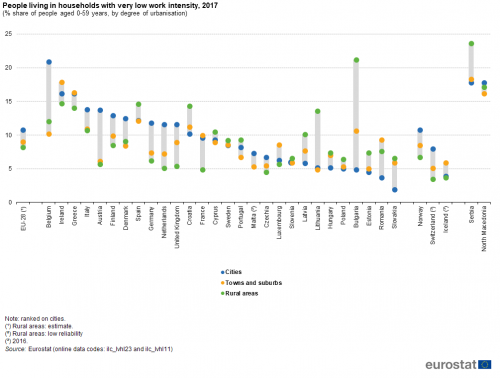
(% share of people aged 0-59 years, by degree of urbanisation)
Source: Eurostat (ilc_lvhl23) and (ilc_lvhl11)
The four largest Member States — in population terms — all recorded their lowest unemployment rates among people living in rural areas and their highest among people living in cities
Unemployed persons are defined on the basis of guidelines provided by the International Labour Organisation (ILO), as:
- someone aged 15-74 years;
- without work during the reference week;
- available to start work within the next two weeks (or has already found a job to start within the next three months); and,
- actively having sought employment at some time during the previous four weeks.
The unemployment rate is the number of unemployed people as a percentage of the labour force (those employed or unemployed). Note that the unemployment rate takes into account people who would like to (or have to) work after the age of 64 but are unable to find a job. As such, the upper age limit is usually set to 74 years (in contrast to the upper age range for the employment rate, which is generally set to 64 years).
In 2017, the EU-28 unemployment rate stood at 7.6 %. The highest unemployment rate, by degree of urbanisation, was recorded for people living in cities (8.3 %), while somewhat lower rates were registered for those living in towns and suburbs (7.5 %) and rural areas (6.6 %). This pattern was consistent with what was observed for the share of people living in households with very low work intensity (also highest in cities).
In 2017, the overall unemployment rates in Greece (21.5 %) and Spain (17.2 %) were clearly above those in other EU Member States, with Italy, Croatia and Cyprus recording the next highest rates, just over 11 %. With the exception of Malta (4.0 %), all of the southern Member States had unemployment rates above the EU-28 average.
When considering just the population living in cities: Greece (23.0 %), Spain (16.6 %) and Italy (11.9 %) had the highest unemployment rates in 2017, closely followed by Belgium (11.7 %). All five of the lowest unemployment rates for people living in cities were in eastern EU Member States, with the lowest rate in Czechia (2.8 %); Croatia was the only eastern Member State to report an unemployment rate for people living in cities that was above the EU-28 average. As for the overall unemployment rate, Malta was the only southern Member State to report a rate for people living in cities that was below the EU-28 average.
Latvia was the only EU Member State where the lowest unemployment rate in 2017 was in towns and suburbs. There were 16 Member States where the unemployment rate was lowest among people living in rural areas:
- all of the western Member States;
- all three Nordic Member States and Lithuania from the north of the EU;
- Greece , Italy and Portugal from the south of the EU;
- Slovenia from the east of the EU.
In 2017, people living in cities had the lowest unemployment rates in all of the eastern EU Member States (except for Slovenia), as well as in two of the southern and one of the Baltic Member States (Spain, Cyprus and Lithuania). By contrast, the four largest EU Member States in population terms — Germany, France, Italy and the United Kingdom — all recorded their lowest unemployment rates among people living in rural areas and their highest rates among people living in cities, thereby collectively greatly influencing the overall EU-28 figures. In Belgium, the unemployment rate for people living in cities was 6.3 pp higher than for either of the other two degrees of urbanisation, while in Austria the difference was 4.4 pp.
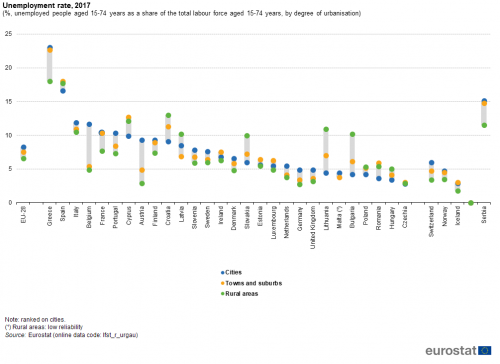
(%, unemployed people aged 15-74 years as a share of the total labour force aged 15-74 years, by degree of urbanisation)
Source: Eurostat (lfst_r_urgau)
Source data for figures and maps
Data sources
Eurostat’s data collection on cities is undertaken by national statistical authorities, the Directorate-General for Regional and Urban Policy (DG REGIO) and Eurostat. It provides statistics on a wide range of socioeconomic indicators that cover many aspects that relate to the quality of urban life: demography, housing, health, economic activity, the labour market, income disparities, educational qualifications, the environment, climate, travel patterns, tourism and cultural infrastructure. The latest data collection exercise sought information from almost one thousand different European cities (across EU Member States, Norway, Switzerland and Turkey; note that there may be considerable differences in relation to the latest reference period available for each city).
The urban statistics presented in this chapter relate to two different concepts: cities and the degree of urbanisation.
The population data refer principally to cities (one or more local administrative units (LAUs) where the majority of the population lives in an urban centre) — information for some cities is presented together with data covering their surrounding commuting zone; together these two entities form a functional urban area. In simple terms, for statistical purposes:
- a city is one or more LAUs where a majority of the population lives in an urban centre of at least 50 000 inhabitants;
- a commuting zone contains the surrounding travel-to-work areas of a city where at least 15 % of employed residents are working in the city;
- a functional urban area consists of a city and its surrounding commuting zone — as shown in Map 1.
Detailed information concerning the definition of concepts for urban entities is provided in Chapter 3 of a methodological manual on territorial typologies.
The classification by degree of urbanisation is based on identifying urban centres (high population density), urban clusters (moderate population density) and rural cells starting from 1 km² population grid cells. These are then assessed for each LAU to identify:
- cities (densely populated areas) — where at least 50 % of the population lives in one or more urban centres;
- towns and suburbs (intermediate density areas) — where less than 50 % of the population lives in an urban centre, but at least 50 % of the population lives in an urban cluster;
- rural areas (thinly populated areas) — where more than 50 % of the population lives in rural grid cells.
For more information:
Context
The Europe 2020 strategy is the EU’s growth strategy for the period through to 2020: it aims to support the recovery from the global financial and economic crisis through smart, sustainable and inclusive growth. To deliver the Europe 2020 targets through economic, social and environmental initiatives in cities and urban areas, policymakers have acknowledged the need to mobilise multi-level governance structures whereby local and regional actors are involved in policy design and delivery alongside central government. The Europe 2020 monitoring platform is a network of 178 cities and regions coordinated by the European Committee of the Regions, which monitors the involvement of EU local and regional authorities in the European semester and the Europe 2020 strategy.
The European Commission’s Directorate-General for Environment (DG Environment) works on a range of issues with the goal of improving urban environments, for example:
- the United Nations (UN) sustainable development goals, in particular goal 11, which seeks to ensure that all cities are inclusive, safe, resilient and sustainable;
- EU environmental legislation which aims to guarantee that EU residents may live and work in cities that provide clean air and water, avoid exposure to excessive noise, and deal properly with waste, while protecting nature and biodiversity, and promoting green infrastructure;
- the European green capital initiative, which allows cities to showcase their environmental performance, recognising and rewarding local efforts to improve the environment, the economy and the quality of life in cities (the Norwegian city of Oslo was the winner of the 2019 award);
- the European green leaf initiative, which allows towns and cities (of between 20 000 and 100 000 inhabitants; note the definition is based purely on a population count) to be recognised for their commitment to better environmental outcomes, with a particular accent on efforts that generate green growth and new jobs (the Spanish city of Cornellà de Llobregat and Horst aan de Maas in the Netherlands were jointly named as winners of the 2019 award).
The urban environment is included in the 7th environmental action programme under priority objective 8 ‘Sustainable cities: working together for common solutions’. Its objective is to improve the sustainability of EU cities such that — by 2050 — all Europeans are ‘living well, within the limits of the planet’.
Cities and urban areas are at the heart of the EU’s cohesion policy. At least half of the resources associated with the European Regional Development Fund (ERDF) during the period 2014-2020 will be invested in urban areas. One of the main areas concerns integrated strategies for sustainable urban development (allocated around EUR 10 billion), whereby around 750 cities across the EU will be empowered to implement strategies that touch upon various dimensions of urban life, including: urban renewal, education, economic development, social inclusion and environmental protection. These initiatives are intended to provide a stimulus for tackling issues such as demographic challenges, job creation, social inclusion or the impact of climate change, all of which are critical for achieving the smart, sustainable, inclusive society envisaged in the Europe 2020 strategy.
The EU’s urban agenda was launched in May 2016 through the Pact of Amsterdam. It is based on three pillars, namely, to deliver better regulation, better funding and better knowledge. The urban agenda is founded on cooperation between cities, EU Member States, the European Commission and other stakeholders to stimulate growth, living standards, the quality of life and innovation in European cities. To deliver these goals, 12 different partnerships have been identified to coordinate actions; within the context of this chapter the most relevant concern:
- the inclusion of migrants and refugees (to propose and implement ways for better managing the integration of migrants and refugees, with particular importance given to the challenges and needs of cities);
- jobs and skills in the local economy (to deal with economic performance and business development at a local level, essential components for sustainable development and social cohesion);
- urban poverty (to contribute to better policies which impact on the inclusion of vulnerable groups and the regeneration of deprived neighbourhoods);
- housing (as affordable housing is a basic human right and fosters social cohesion, this partnership aims to contribute better policies and frameworks to stimulate access to adequate housing).
Notes
- ↑ In Sweden the employment rate for rural areas was the same as that for towns and suburbs.
Direct access to
- Territorial typologies for European cities and metropolitan regions (background article)
- City statistics (urb), see:
- Cities and greater cities (urb_cgc)
- Functional urban areas (urb_luz)
- Population (demo_pop)
- Population: Structure indicators (demo_pjanind)
- LFS series - Specific topics (lfst)
- LFS regional series (lfst_r)
- People at risk of poverty or social exclusion (Europe 2020 strategy) (ilc_pe)
- Main indicator - Europe 2020 target on poverty and social exclusion (ilc_peps)
- Living conditions (ilc_lv)
- Health and labour conditions (ilc_lvhl)
- Housing conditions (ilc_lvho)
- Housing cost burden (ilc_lvho_hc)
- Methodological manual on territorial typologies — Eurostat — 2018 edition
- Degree of urbanisation classification — 2011 edition
- City statistics (ESMS metadata file — urb_esms)
- Methodological manual on city statistics — Eurostat — 2017 edition
- Quality of life in European cities 2015 — Perception survey in 79 European cities — European Commission, Flash Eurobarometer 419, January 2016
- Quality of life in cities 2012 — Perception survey in 79 European cities — European Commission, Flash Eurobarometer 366, October 2013
- A harmonised definition of cities and rural areas: the new degree of urbanisation — European Commission — 2014
- Cities in Europe — The new OECD-EC definition — European Commission — 2012
- European Commission — Environment — Sustainable development
- European Commission — Regional and urban development — Cities and urban development
- European Commission — Regional policy — Urban development
- European Commission — Urban agenda for the EU
- United Nations — Sustainable development goals (SDGs)
Maps can be explored interactively using Eurostat’s statistical atlas (see user manual).
More recent regional statistics on environment are available in Eurostat’s annual flagship publication, the Eurostat regional yearbook.

