Archive:Enlargement countries - tourism statistics
Data extracted in May 2022.
Planned article update: May 2023.
Highlights
There were more than 1.8 million bed places in hotels and similar establishments across the EU candidate countries and potential candidates in 2020, with 1.6 million in Turkey alone. In comparison, there were 11.9 million in the EU.
Aside from Montenegro, the number of hotel bed places grew in all of the EU candidate countries and potential candidates from 2010 to 2020. However, from 2019 to 2020, the number decreased by 39% in Montenegro and 20% in Bosnia and Herzegovina.
In 2020, almost 14.0 million tourists arrived at hotels in the candidate countries and potential candidates. This was more than two thirds (-69%) less than the 44.4 million arrivals in 2019, due to the Covid-19 pandemic and associated travel restrictions, with sharp falls in all of these countries.
Arrivals of non-residents at hotels and similar establishments, 2019 and 2020 (arrivals per thousand inhabitants)
This article is part of an online publication and provides information on a range of tourism statistics for the European Union (EU) and candidate countries and potential candidates, otherwise known as the enlargement countries. Montenegro, North Macedonia, Albania, Serbia and Turkey currently have candidate status, while Bosnia and Herzegovina as well as Kosovo* are potential candidates.
This article highlights recent developments concerning the capacity of the tourism sector in these countries, in terms of the number of bed places available in hotels and similar accommodation establishments, the number of arrivals of non-residents at tourist accommodation establishments and the number of trips made by outbound tourists. It also provides data on different aspects of employment in the tourism sector, more specifically within the ‘Accommodation’ sub-sector.
Tourism plays an important role because of its economic and employment potential, as well as its social and environmental implications. Tourism statistics are not only used to monitor tourism policies but also regional and sustainable development policies.
Full article
Tourism infrastructure
There were more than 1.8 million bed places in hotels and similar establishments across the candidate countries and potential candidates in 2020; almost 88 % of these were in Turkey
The number of bed places available in hotels and similar tourist accommodation establishments provides one measure of a country’s capacity to attract tourists. In this context, it should be noted that official tourism statistics include business travellers as tourists, alongside individuals travelling for pleasure or other reasons. In 2020, the tourism sector in the seven candidate countries and potential candidates offered a combined total of more than 1.8 million bed places. By comparison, there were 11.9 million bed places in hotels and similar establishments across the EU in 2020. In Turkey alone, there were 1.6 million bed places available, 88 % of the total among these countries. The second largest capacity was found in Albania with 82 000 bed places, corresponding to 5 % of the total, and the third highest found in Serbia (57 000; 3 %). The capacity of bed places was roughly at the same level in Bosnia and Herzegovina (28 000), North Macedonia (24 000) and Montenegro (23 000), with Kosovo* at around half of this level (12 000).
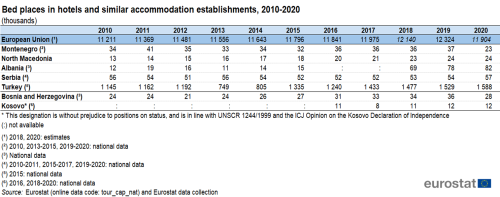
(thousands)
Source: Eurostat (tour_cap_nat) and national data (see the section on Data sources)
Aside from in Montenegro, the number of hotel bed places offered increased in all of the candidate countries and potential candidates in the decade from 2010 to 2020.
Throughout the decade from 2010 to 2020, Turkey was by far the largest supplier of tourism capacity, in terms of the number of bed places available in hotels and similar accommodation, among the candidate countries and potential candidates. However, Turkey is also a much larger country than the others. As can be seen in Figure 1, in 2020 the tourism sector was much more important in Montenegro (36.2 bed places per thousand inhabitants) and Albania (28.9) than in Turkey (19.0), when the capacity in bed places in hotels are measured relative to the population size. Measured like this, the tourism sector also had higher importance in the EU (26.6) than in Turkey. All of these countries, as the EU, can offer tourism in mountain regions as well as in coastal regions with beaches, in addition to sites of historical and cultural interest, thus offering a wide range of tourism types. The relative capacity of bed places was at a lower level in North Macedonia (11.7), Serbia and Bosnia and Herzegovina (both 8.2) as well as Kosovo (6.4).
Compared to 2010, the number of bed places relative to the population size had increased in all of the candidate countries and potential candidates by 2020, with Montenegro the only exception with a decrease by one third (-34 %) from 54.6 bed places per thousand inhabitants in 2010 to 36.2 in 2020.
In contrast, the bed place capacity in Albania increased by 601 % from 4.1 in 2010 to 28.9 in 2020. Thus, from having the lowest capacity of bed places relative to the population in 2010, Albania had the second highest capacity among these countries (both relative to the population and in absolute numbers) in 2020. In addition to an increased interest in Albania as a tourist destination, this apparent increase reflected efforts by the government to formalise the economy and stimulate the tourist accommodation sector. A value added tax reform in November 2017 reduced the VAT rate applicable to tourist accommodation services from the standard 20 % VAT rate to 6 %. However, in order to benefit from the reduced rate, the tourist accommodation services had to be registered in separate companies without other economic activities. The threshold for compulsory VAT registration was also lowered from ALL 5 million to ALL 2 million turnover per calendar year. As a result, many bed places not previously captured by the statistics were registered from 2018, creating a break in the time series.
In comparison, the relative capacity in the EU increased by 5 % from 25.4 to 26.6 over the same period.
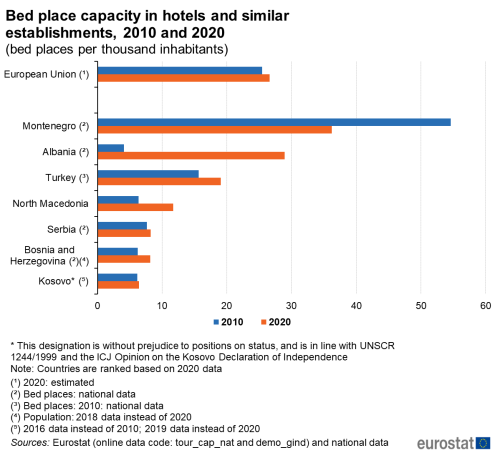
(bed places per thousand inhabitants)
Source: Eurostat (tour_cap_nat), (demo_gind) and national data (see the section on Data sources)
Figure 2 shows that the number of bed places in the candidate countries and potential candidates followed quite different development paths throughout the decade 2010-2020. As the only one, the number of bed places in North Macedonia increased each year of the period. All the others experienced years in which the number of bed places declined, in particular in the early years of this period.
In Montenegro, an initial sharp rise by 20.4 index points from 2010 to 2011 was followed by an almost equally sharp fall by -18.0 points from 2011 to 2012. In the following period 2013 to 2019, the bed places index fluctuated, with year-on-year changes ranging between -5.8 points (2013) and 9.5 (2016).
In particular, the number of bed places offered decreased compared with the previous year in both 2012 and 2013 in Albania and Montenegro; the same applied to Serbia and Bosnia and Herzegovina in 2012, Turkey in 2013 and 2016, Montenegro and Serbia also in 2015 and Kosovo in 2017 (data only available from 2016 onwards). A striking feature is the sharp drop in the number of bed places offered in Montenegro from 2019 to 2020, by -42.6 points, which may reflect the first effects of the Covid-19 pandemic on accommodation capacity.
As mentioned above, in 2010 Albania had the lowest number of tourist accommodation bed places among the candidate countries and potential candidates, both in the direct (absolute) number and relative to its population size. Thus, relative moderate year-on-year changes in the number of bed places resulted in relatively large year-on-year swings in the index based on the 2010 number. In 2011, the index rose sharply by 58.3 points compared to the previous year, before falling by -25.0 points in 2012 and -41.6 points in 2013, before rising again by 25.0 points in 2014. Following a break in data availability in 2016-2017, the November 2017 tourism accommodation-specific VAT tax reform had a profound effect on the registration of tourist accommodation bed places, implying a sharp break in the index time series. The index value jumped from 125.0 in 2015 to 575.0 in 2018, which is 4.6 times higher. The index value continued to grow rapidly, up 75.0 points from 2018 to 2019 and a further 33.3 points from 2019 to 2020. These index values (575.0 in 2018; 675.0 in 2019; and 683.3 in 2020) are too high to be presented in Figure 2.
The number of bed places in hotel accommodation remained relatively stable in Serbia throughout the decade 2010-2020, with the index value moving within the range 91.1 (2012) to 102.0 (2020). The year-on-year changes were negative in 2011, 2012, 2014, 2015 and 2017 and positive in the other years. The most substantial changes were a fall by -6.9 from 2011 to 2012, which was countered by-a rise by 9.3 point in the following year.
In Turkey, the index of bed places offered recorded small increases between 2010 and 2012, before dropping by -38.7 points in 2013. The recovery started slowly with a year-on-year increase by 4.9 points in 2014, before a steep increase by 46.3 points in 2015. Following a more moderate decrease by -8.3 points in 2016, the index rose again by 16.9 points in 2017 and continued to increase at a more moderate pace in the following years.
The index on bed places remained unchanged at 100.0 from 2010 to 2011 for Bosnia and Herzegovina, but then fell by -12.5 points from 2011 to 2012. In the following years, the offer of tourist accommodation bed places grew steadily, with year-on-year rises each year, with two-digit increases in 2013 (10.5 points), 2016 (14.2) and 2017 (10.6). However, from 2019 to 2020, a sharp drop was recorded in the index (-29.6 points), possibly reflecting the first effects of the Covid-19 pandemic on the supply of tourist accommodation.
For Kosovo, data on the number of bed places available in tourist accommodation establishments are available from 2016 onwards. These were even lower than the numbers recorded for Albania in 2010. As a result, relatively moderate changes in the absolute number of bed places were reflected in major swings in the index, which is based on 2016 for Kosovo (2016 = 100.0). The index fell year-on-year by -29.9 points from 2016 to 2017, before rising by almost as much (27.3 points) the following year. This increase slowed down to 7.3 points the following year, before flatlining and remaining unchanged in 2020.
The number of tourist accommodation bed places offered in the EU grew slowly throughout the period 2010 to 2019, with the index value increasing by between 0.4 points (2016) and 1.6 points (2019) year-on-year. However, from 2019 to 2020, the index fell by -3.7 points; again, this could be an early sign of a negative effect of the Covid-19 pandemic on tourism.
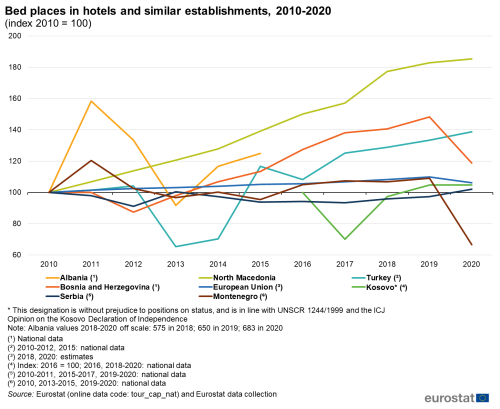
(index 2010 = 100)
Source: Eurostat (tour_cap_nat) and national data (see the section on Data sources)
Non-resident arrivals
Almost 14.0 million non-residents arrived at hotels and similar establishments in the candidate and potential candidate countries in 2020, down 69 % compared to the year before due to the Covid-19 pandemic
In 2020, there were 14.0 million arrivals of non-residents at hotels and similar establishments across the candidate countries and potential candidates (see Table 2). This represented a fall by more than two-thirds (69 %) compared to 2019, when there were 44.4 million arrivals. The strict restrictions on travel and tourism introduced in most countries in 2020 to combat the spread of the Covid-19 virus had immediate effects. All of the candidate countries and potential candidates recorded a sharp decrease in the number of non-resident tourists arriving at hotels and similar establishments; Montenegro and North Macedonia both recorded decreases of -84 %, with Bosnia and Herzegovina (-83 %) and Serbia (-80 %) almost experienced equally dramatic falls. Turkey, which has the by far largest tourism sector among these countries, experienced a slightly lower fall in arrivals of non-residents, by two thirds (-67 %). Albeit slightly less dramatic, the number of arrivals fell by -62 % in Albania and -52 % in Kosovo between 2019 and 2020.
The number of arrivals of non-residents had been growing steadily in Turkey, from 14.2 million arrivals in 2016 to 38.8 million in 2019, before falling to 12.8 million in 2020. This still corresponded to 91.6 % to all arrivals of non-residents in the candidate countries and potential candidates in 2020. Serbia recorded a fall from 1.6 million arrivals in 2019 to 329 000 in 2020, Bosnia and Herzegovina from 1.1 million to 189 000 and Montenegro from 1.1 million to 179 000. Albania recorded 281 000 arrivals in 2020 (down from 736 000 in 2019), North Macedonia 115 000 (from 725 000) and Kosovo 85 000 (down from 177 000).
In comparison, there was a total of 316 million arrivals of non-residents at hotels and similar establishments in the EU in 2019; 2020 data are not yet available.
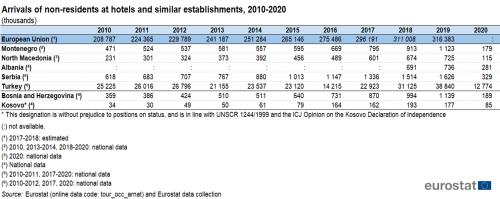
(thousands)
Source: Eurostat (tour_occ_arnat) and national data (see the section on Data sources)
Figure 3 compares the number of arrivals of non-residents at hotels and similar establishments relative to the number of (resident) inhabitants between 2010 and 2020. In order to better reflect the extraordinary effects of the Covid-19 pandemic on tourism in 2020, Figure 3 also includes 2019 data for direct comparison. Relative to the population, the tourism sector had the highest importance in Montenegro with 287 arrivals per thousand inhabitants in 2020. This was sharply down from 1 805 in 2019, and also far lower than the 760 arrivals per thousand inhabitants registered a decade earlier in 2010. Turkey also recorded a dramatic fall from 2019 to 2020, from 470 to 153, respectively; the 2020 figure was lower than the 2010 figure (345) also for Turkey. The arrivals of non-residents declined strongly from 2019 to 2020 also in Albania (from 258 to 99), North Macedonia (from 349 to 55), Bosnia and Herzegovina (from 326 to 54), Serbia (from 234 to 48) and Kosovo (from 99 to 48). Kosovo was the only one where the number of non-resident arrivals per thousand inhabitants was higher in 2020 (48) than it had been in 2010 (17). However, 2010 data are not available for Albania.
In the EU, there were 708 arrivals of non-residents per thousand inhabitants in 2019; 2020 data are not yet available. In 2010, the EU had welcomed 473 arrivals of non-residents per thousand inhabitants.
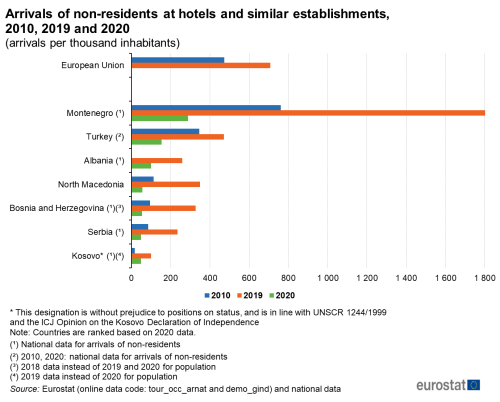
(arrivals per thousand inhabitants)
Source: Eurostat (tour_occ_arnat), (demo_gind) and national data (see the section on Data sources)
The index based on 2010 data on the number of arrivals of non-resident at hotels and similar, presented in Figure 4, shows the development in the candidate countries and potential candidates from 2010 to 2020. Generally, the trend was upwards year-on-year, with only some instances of decline compared to the previous year.
The sharp falls in arrivals from 2019 to 2020, a direct effect of the Covid-19 pandemic through the restrictions imposed on travelling and on accommodation of tourists and other travellers, can be clearly seen for all the candidate countries and potential candidates, with large chutes for all. Particular stark falls can be seen for Montenegro and North Macedonia (both -84 %), Bosnia and Herzegovina (-83 %) and Serbia (-80 %). There were also dramatic falls in tourist arrivals, although not quite as sharp, in Turkey (-67 %), Albania (-62 %) and Kosovo (-52 %). However, it should be noted that the number of arrivals in Kosovo already fell in 2019; thus, there may have been additional factors contributing to the sharp decline for Kosovo.
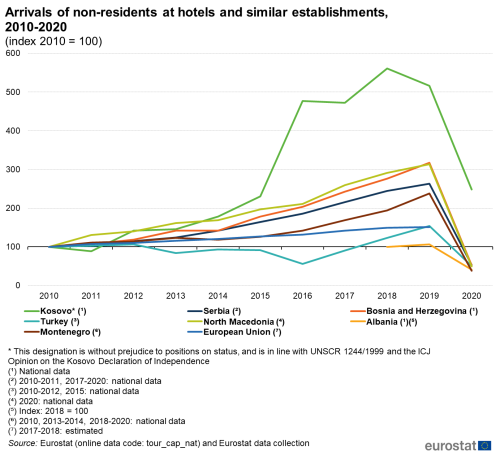
(index 2010 = 100)
Source: Eurostat (tour_occ_arnat) and national data (see the section on Data sources)
Outbound tourism
Tourists and other travellers from Turkey made almost 9.7 million outbound trips in 2019
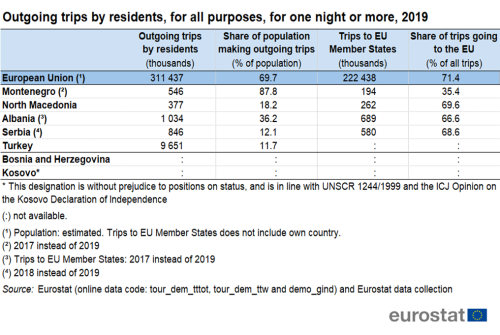
Table 3 presents the most recent available data on the outward flow of tourists travelling abroad from the candidate countries and potential candidates and from the EU. Data are not available for the potential candidates Bosnia and Herzegovina and Kosovo.
Among the five candidate countries, the highest number of outbound tourist trips was recorded for Turkey, the most populous of these countries, with 9.7 million in 2019. There were 1.0 million outbound trips made by tourists from Albania (2017 data), 846 000 from Serbia (2018 data), 546 000 from Montenegro (2017 data) and 377 000 from North Macedonia.
Considering the share of the population that went on outbound tourism trips shows a quite different picture. By far the highest share of the population going abroad on tourism trip was recorded in Montenegro (2017 data) with 87.8 % of the population going on such trips. At a far lower level was Albania, with 36.2 % (2017 data). The population of North Macedonia (18.2 %), Serbia (12.1 %; 2018 data) and Turkey (11.7 %) went abroad to a much lower degree.
The EU was the destination for around two thirds of the outbound trips made by the inhabitants of most of these countries. Tourists from North Macedonia travelled to an EU Member States on 70 % of their outbound trips; in Serbia this share was 69 % (2018 data) and in Albania 67 % (2017 data). Data on where the trips were going, whether to the EU or to other parts of the world, are not available for Turkey.
EU tourists made 311 million non-domestic trips in 2019; 71 % of these trips, or 222 million trips, went to other EU Member States. Note that EU data for this particular indicator are estimates and only refer to persons aged 15 years or older.
Source: Eurostat (tour_dem_tttot), (tour_dem_ttw), (demo_gind) and national data (see the section on Data sources)
Employment in the tourism sector
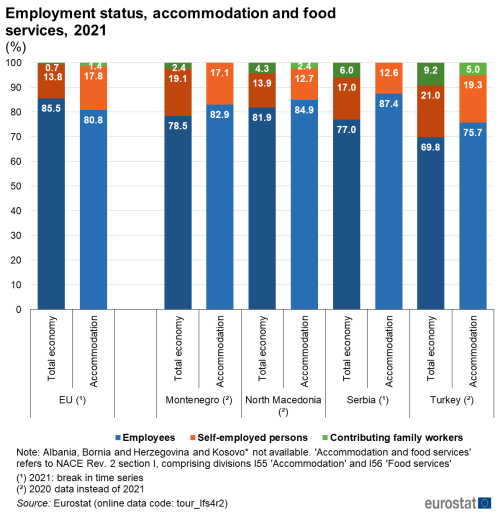
In Montenegro, North Macedonia, Serbia and Turkey, there were fewer self-employed persons in accommodation and food services than in the general economy. In the EU, the opposite was the case.
The tourism sector is an important source of employment in many regions, also within the candidate countries and potential candidates. Figure 5 shows the different categories of persons employed (employees; self-employed persons; contributing family workers) in the overall economy and compares this with a key section of the tourism sector: accommodation and food services activities (NACE Rev. 2 Section I). This section comprises accommodation (NACE Rev. 2 division I.55), covering hotels and similar establishments as well as other holiday and short-stay accommodation and camping grounds and recreational vehicle parks, and food services activities (NACE Rev. 2 division I.56), covering restaurants and mobile food services, event catering and other food services, as well as serving of beverages.
Data on the characteristics of the persons employed in the tourism sector are available for the EU and EU Member States as well as for the candidate countries Montenegro, North Macedonia, Serbia and Turkey through the Labour force survey (LFS).
In all four candidate countries for which data are available, the rate of self-employed persons and of contributing family members are lower in accommodation and food services than in the general economy.
Turkey had the highest share of self-employed persons in accommodation and food services among these countries. However, the share of 19.3 % was lower than in Turkey’s general economy (21.0 %; 2020 data). The same was the case for contributing family members; the share in accommodation and food services of 5.0 % in 2020 was the highest among these four candidate countries, but lower than the share of 9.2 % in the economy as a whole. It should be noted that data on contributing family members in accommodation and food services are available only for North Macedonia and Turkey, but not for Montenegro and Serbia.
The second highest rate of self-employed persons in accommodation and food services was recorded in Montenegro, with 17.1 % in 2020, 2.0 percentage points (pp) lower than in the general economy (19.1 %). Data on contributing family members are not available for accommodation and food services, but stood at 2.4 % in the economy as a whole (2020 data).
North Macedonia and Serbia had very similar levels of self-employed persons in accommodation and food services, with 12.7 % (2020 data) and 12.6 % (2021 data), respectively. In comparison, these rates stood at 13.9 % in the general economy of North Macedonia and at 17.0 % in the Serbian economy. In North Macedonia, 2.4 % of the persons employed in accommodation and foodservices were contributing family members, compared to 4.3 % in the economy as a whole (2020 data). In Serbia, 6.0 % of the employed were family members in 2021; however, data in this aspect are not available for accommodation and food services.
In contrast, in the EU there were a higher rate of self-employed persons and a higher rate contributing family members in accommodation and food services than in the general economy. In 2021, 17.8 % of the employed in accommodation and food services in the EU were self-employed, while 1.4 % were family members. In the general economy in the EU, these rates stood at 13.8 % and 0.7 %, respectively.
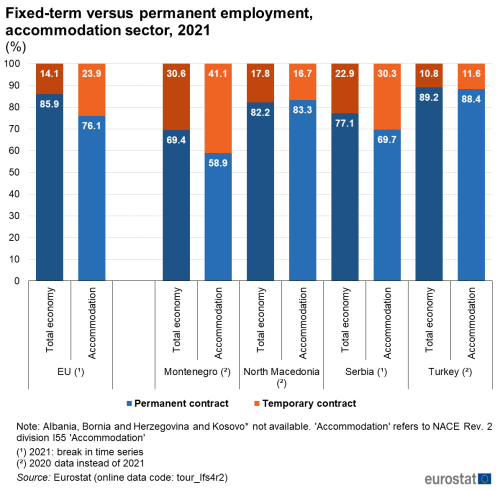
The tourism sector is often characterised by high seasonality, with the level of employment varying over the year. This may lead to a relatively high share of temporary employment contracts (also known as fixed-term contracts or limited contracts) for the persons employed in this sector. From the LFS, data are available on this aspect for the accommodation sector for Montenegro, North Macedonia, Serbia and Turkey, as well as for the EU.
In Turkey and North Macedonia (both 2020 data), only a small minority of the persons employed in the accommodation sector has a temporary (limited) employment contract. In both cases, the share of temporary contracts was close to the overall shares in the economy. In Turkey, the share with a temporary contract was 11.6 %, compared to 10.8 % in the economy as a whole, while in North Macedonia the shares were 16.7 % in the accommodation sector and 17.8 % in the general economy.
In contrast, in Serbia the share of the employed with only a temporary contract was almost one third (30.3 %) in the accommodation sector in 2021. This was substantially higher than in the economy as a whole, where the share of temporary contracts was 7.4 pp less at 22.9 %. However, the largest difference in the prevalence of temporary contracts were recorded in Montenegro, where 41.1 % of the employed in the accommodation sector had only a limited employment contract in 2020, 10.5 pp higher than in the general economy (30.6 %).
In the EU, almost one quarter (23.9 %) of the employed in the accommodation sector did only have a temporary employment contract in 2021. In comparison, only 14.1 % of the employed in the general economy had to cope with a temporary employment contract, a difference of 9.8 pp.
(%)
Source: Eurostat (tour_lfs4r2)
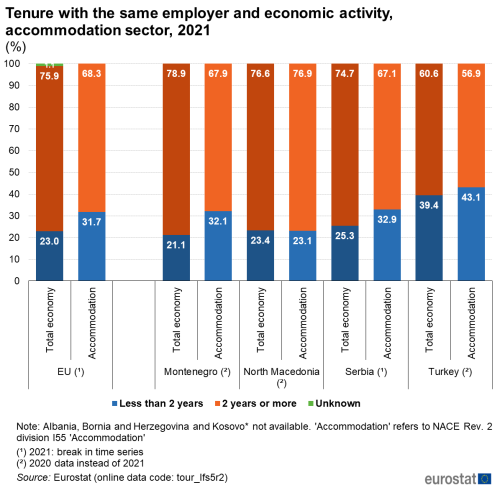
In the tourism sector, there is in many cases a quite high turnover of the persons employed, reflected in a relatively large share of persons employed that have stayed less than two years in their current job, with the same employer and within the same NACE Rev. 2 economic activity. There may be different reasons for this, including the salary level, the extent of limited contracts, the seasonality of the work, or job security in cases of external shocks such as the Covid-19 pandemic. Figure 7 presents data on the tenure, i.e. the length of time an employee has been with the same employer, in the accommodation sector and compares this to the corresponding data for the whole economy.
Turkey stands out among these countries, with 43.1 % of the persons employed in the accommodation sector having spent less than 2 years at their current work place (2020 data). However, this is a general feature of the Turkish economy; 39.4 % of persons employed had stayed less than 2 years in their current job, a difference of just 3.7 pp.
The difference between the accommodation sector and the general economy was much more profound in Serbia and Montenegro. In both countries, almost a third of the persons employed in the accommodation sector had less than 2 years tenure with their current employer, considerably higher than the average in their respective economies: while a tenure of less than 2 years concerned 32.9 % of the employees in the accommodation sector in Serbia in 2021, this share was 25.3 % in the general economy, a difference of 7.6 pp. In Montenegro, the difference was even larger; the rate in the accommodation sector (32.1 %; 2020 data) was 11.0 pp higher than in the economy as a whole (21.1 %).
In North Macedonia, there was little difference between the accommodation sector and the general economy: while 23.4 % of the employed has stayed less than 2 years with their current employer in general, it was 23.1 in the accommodation sector (2020 data).
In 2021, one third (31.7 %) of the employed in the accommodation sector in the EU had worked less than 2 years in the same activity for the same employer, while this was case for almost one quarter (23.0 %) of the employed in general.
(%)
Source: Eurostat (tour_lfs5r2)
Source data for tables and graphs
Data sources
The enlargement countries are expected to increase the volume and quality of their data progressively, and to transmit these data to Eurostat and the wider ESS in the context of the EU accession process. The final objective of the EU in relation to official statistics is to obtain harmonised, high-quality data that conforms to both European and international standards. More details on the statistical aspects of the accession process can be found in the article Enlargement policy and statistical cooperation.
The enlargement countries are not at the same level of development and are progressing towards an efficient and modern statistical system at different speeds. In a number of areas, candidate countries (and sometimes also potential candidates) are in a position to provide harmonised data in accordance with the EU acquis with respect to methodology, classifications and procedures for data collection and the principles of official statistics as laid down in the European statistics Code of Practice. In these cases, the candidate countries (and potential candidates) concerned report their data to Eurostat following the same procedures and under the same quality criteria as the EU Member States and the EFTA countries. Data from the enlargement countries that meet these quality requirements are published along with data for EU Member States and EFTA countries.
In addition, the enlargement countries provide data for a wide range of indicators for which they do not yet fully adhere to the quality requirements specified in the EU acquis and the methodology, classifications and procedures for data collection specified in the relevant Regulations, Directives and other legal documents. These data are collected on an annual basis through a questionnaire sent by Eurostat to the candidate countries or potential candidates. A network of contacts has been established for updating these questionnaires, generally within the national statistical offices, but potentially including representatives of other data-producing organisations (for example, central banks or government ministries). This annual exercise also offers an opportunity to provide methodological recommendations to the enlargement countries. Data collected through this specific data collection from the candidate countries or potential candidates are signified as ‘"national data"’ in the tables and figures of this article.
Tourism, in a statistical context, refers to the activity of visitors taking a trip to a destination outside their usual environment, for less than a year. It can be for any main purpose, including business, leisure or other personal reasons other than to be employed in the place visited. A tourist is a visitor that stays overnight (at least one night).
Within the EU, a system of tourism statistics was established through Council Directive 95/57/EC of 23 November 1995 on the collection of statistical information in the field of tourism. This legal basis required EU Member States to provide a regular set of comparable tourism statistics. The Directive was amended in 2004 and 2006, before being repealed in 2011 when the European Parliament and the Council of the European Union adopted Regulation (EU) No 692/2011 concerning European statistics on tourism. The 2011 Regulation on tourism statistics was amended in 2013, in 2019 and again in 2020; the current consolidated version of Regulation (EU) No 692/2011 incorporate all these amendments.
Information concerning the current statistical legislation on tourism can be found here.
Tourism statistics in the EU consist of two main components: on the one hand, statistics relating to capacity and occupancy (supply-side tourism statistics); on the other, statistics relating to tourism demand. In most EU Member States, the former are collected via surveys filled in by accommodation establishments, while the latter are mainly collected via traveller surveys at border crossings or through household surveys. Statistics on tourism demand refer to tourist participation, in other words, trips of at least one overnight stay during the reference period.
Although the candidate countries and potential candidates produce some of these statistics on tourism capacity, occupancy and tourism demand and provide these to Eurostat, tourism data availability is still quite limited compared to that of the EU Member States.
Within the European Statistical System, statistics on the capacity of collective tourist accommodation include the number of establishments, the number of bedrooms and the number of bed places. These statistics are available by establishment type or by region and are compiled annually. Statistics on the occupancy of collective tourist accommodation refer to the number of arrivals (at accommodation establishments) and the number of nights spent by residents and non-residents, by establishment type or region; annual and monthly statistical series are available. In addition, statistics on the use of bedrooms and bed places (occupancy rates) are compiled.
Statistics on tourism demand in the EU are collected in relation to the number of tourism trips made (and the number of nights spent on those trips). The data are also analysed by the socio-demographic characteristics of the tourist.
Data from a range of other official sources may be used to study tourism. These statistics include:
- structural business statistics (SBS) and short-term business statistics (STS) which may be used to provide additional information on tourism flows and on the economic performance of certain tourism-related sectors;
- data on employment in the tourism accommodation sector from the labour force survey (LFS), analysed by working time (full/part-time), working status, age, level of education, sex, permanency and seniority of work with the same employer (annual and quarterly data);
- data on personal travel receipts and expenditure from the balance of payments;
- transport statistics (for example, air passenger transport).
Tables in this article use the following notation:
| Value in italics | data value is forecasted, provisional or estimated and is therefore likely to change; |
| : | not available, confidential or unreliable value. |
As explained at the beginning of this section, data specified as ‘"national data"’ in the footnotes of the tables and figures of this article have been collected through the specific annual questionnaires sent to the enlargement countries, covering indicators for which they do not yet fully adhere to the quality requirements specified in the EU acquis.
Context
Tourism has the potential to contribute towards employment and economic growth, as well as to the development of rural, coastal, peripheral or less-developed areas. Infrastructure created for tourism purposes contributes to local development, while jobs that are created or maintained can help counteract industrial or rural decline. Sustainable tourism involves the preservation and enhancement of cultural and natural heritage, ranging from the arts to local gastronomy or the preservation of biodiversity.
While basic principles and institutional frameworks for producing statistics are already in place, the candidate countries and potential candidates are expected to increase progressively the volume and quality of their data and to transmit these data to Eurostat in the context of the EU enlargement process. EU standards in the field of statistics require the existence of a statistical infrastructure based on principles such as professional independence, impartiality, relevance, confidentiality of individual data and easy access to official statistics; they cover methodology, classifications and standards for production.
Eurostat has the responsibility to ensure that statistical production of the candidate countries and potential candidates complies with the EU acquis in the field of statistics. To do so, Eurostat supports the national statistical offices and other producers of official statistics through a range of initiatives, such as pilot surveys, training courses, traineeships, study visits, workshops and seminars, and participation in meetings within the European Statistical System (ESS). The ultimate goal is the provision of harmonised, high-quality data that conforms to European and international standards.
Additional information on statistical cooperation with the enlargement countries is provided here.
Notes
* This designation is without prejudice to positions on status, and is in line with UNSCR 1244/1999 and the ICJ Opinion on the Kosovo Declaration of Independence.
Direct access to
- Enlargement countries — statistical overview — online publication
- Statistical cooperation — online publication
- All articles on non-EU countries
- Tourism statistics
- Tourism statistics at regional level
- Tourism trips of Europeans (online publication)
- All articles on tourism statistics
Statistical books/pocketbooks
- Key figures on enlargement countries — 2019 edition
- Key figures on enlargement countries — 2017 edition
- Key figures on the enlargement countries — 2014 edition
- Key figures on the enlargement countries — 2013 edition
- Pocketbook on the enlargement countries — 2012 edition
- Pocketbook on the enlargement countries — 2011 edition
'Factsheets
- Basic figures on Western Balkans and Turkey — Factsheets — 2022 edition
- Basic figures on enlargement countries — Factsheets — 2021 edition
Leaflets
- Statistics on tourism for the enlargement countries — 2020 edition
- Basic figures on enlargement countries — 2020 edition
- Basic figures on enlargement countries — 2019 edition
- Basic figures on enlargement countries — 2018 edition
- Basic figures on enlargement countries — 2016 edition
- Basic figures on enlargement countries — 2015 edition
- Basic figures on enlargement countries — 2014 edition
'Tourism in the EU
- Occupancy of tourist accommodation establishments (ESMS metadata file — tour_occ_esms)
- Annual data on trips of EU residents (ESMS metadata file — tour_dem_esms)
- Methodological manual for tourism statistics — version 3.1 — 2014 edition
- Projects and studies, see Methodology for tourism statistics and Tourism Satellite Accounts (TSA)
- Regulation (EU) No 692/2011 of the European Parliament and of the Council of 6 July 2011 concerning European statistics on tourism and repealing Council Directive 95/57/EC
- A renewed EU tourism policy: towards a stronger partnership for European tourism (Communication from the European Commission COM(2006) 134 final, March 2006)
- Agenda for a sustainable and competitive European tourism (Communication from the European Commission COM(2007) 621 final, October 2007)
Europe, the world’s No 1 tourist destination — a new political framework for tourism in Europe (Communication from the European Commission COM(2010) 352 final, June 2010)
