Eurostatistics - data for short-term economic analysis
Data extracted on 19 July 2024.
Planned article update: 27 August 2024.
Latest macroeconomic developments
Highlights
In June 2024, euro area annual inflation, economic sentiment and employment expectations all fell (compared with the previous month).
In May 2024, industrial production in the euro area decreased (compared with the previous month), while retail trade increased marginally.
In the 1st quarter of 2024, GDP in the euro area expanded (when compared with the previous quarter).
Click on the picture to access the interactive data visualisation
This monthly article gives a picture of the macroeconomic situation in the euro area, the European Union (EU) and the EU countries, showing relevant indicators of production, demand, labour and prices, as well as interest and exchange rates. These are based on the principal European economic indicators (PEEIs). Note that rates of change for all monetary indicators (such as gross domestic product (GDP), industrial production and retail sales) are presented in real terms, in other words, after removing the impact of price changes.
The article is complemented by a data visualisation offering additional indicators and interactive graphs; it also includes links to source data. Looking for the freshest information? Real-time updates of data can be found in the form of graphs and tables in the Euro indicators dashboard with advanced functionalities to explore and download them.
Based on the figures available on 19 July 2024, the economic situation in the euro area and the EU is characterised by
- a decrease in inflation (as measured by the all-items harmonised index of consumer prices (HICP)) in June 2024
- an increase in GDP in the 1st quarter of 2024
- a decrease in industrial production in May 2024
- a decrease in production in construction in May 2024
- a marginal increase in retail trade sales in May 2024
- an unchanged unemployment rate in May 2024
- decreases in economic sentiment and the level of employment expectations in June 2024.
The economic situation in both the euro area and the EU showed some mixed signals. Positive developments are expanding GDP, the fall in inflation and the stable unemployment rate. By contrast, there were decreases in industrial production, construction production, retail trade sales, economic sentiment and employment expectations.
Full article
Situation in the euro area and the EU
In the 1st quarter of 2024, seasonally adjusted GDP increased by 0.3% quarter-on-quarter in both the euro area and the EU. For comparison, in the 4th quarter of 2023, GDP had been stable in both the euro area and the EU. Compared with the 1st quarter of the previous year, GDP was 0.5% higher in the 1st quarter of 2024 in the euro area and 0.6% higher in the EU.
In May 2024, seasonally adjusted industrial production decreased month-on-month by 0.6% in the euro area and by 0.8% in the EU. In the previous month, it had been stable in the euro area and increased by 0.5% in the EU. Compared with May 2023, industrial output was 2.9% lower in May 2024 in the euro area and 2.5% lower in the EU.
In June 2024, the economic sentiment indicator decreased by 0.2 points to 95.9 points in the euro area and by 0.2 points to 96.4 points in the EU. The decrease in the euro area resulted from decreases in confidence among retail, construction, services and industrial managers outweighing an increase in confidence among consumers.

Source: Eurostat (namq_10_gdp), (ei_isir_m) and (ei_bssi_m_r2) and DG Economic and Financial Affairs (ECFIN)
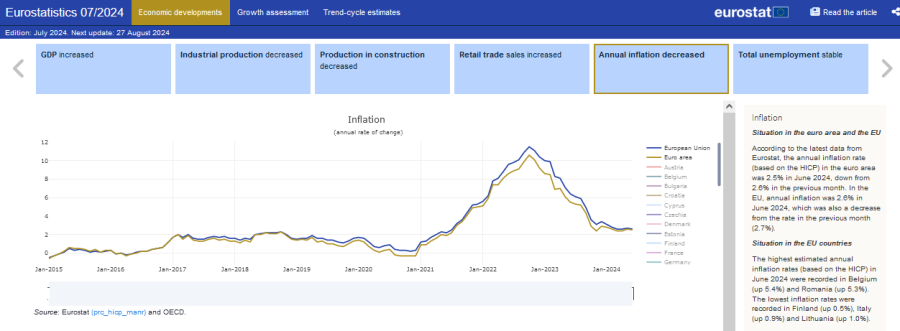
In the euro area, the annual inflation rate fell from a peak of 10.6% in October 2022 through 5.5% a year ago (June 2023) to 2.5% in June 2024; in the EU, it fell from a peak of 11.5% in October 2022 through 6.4% a year ago (June 2023) to 2.6% in June 2024. There was an upturn in euro area and EU inflation rates in December 2023 and again in May 2024.
According to the latest data from Eurostat, the annual inflation rate (based on the HICP) in the euro area was 2.5% in June 2024, down from 2.6% in the previous month. The category of services recorded the highest annual rate in June 2024 (prices were up 4.1%, the same as in the previous month), followed at some distance by food, alcohol and tobacco (up 2.4% in June 2024 after an increase of 2.6% in the previous month) and non-energy industrial goods (up 0.7%, the same as in the previous month). After a series of 12 negative rates, the annual rate for energy turned positive in May 2024 (up 0.3%) and this was followed by a second positive rate (0.2%) in June 2024. In the EU, annual inflation was 2.6% in June 2024, which was also a decrease from the rate in the previous month (2.7%).
Compared with a year earlier, industrial producer prices in May 2024 were 4.2% lower in the euro area and 4.0% lower in the EU; in April 2024, they had been, respectively, 5.7% and 5.4% lower than a year earlier. Month on month, industrial producer prices decreased in May 2024 by 0.2% in the euro area and by 0.3% in the EU; these decreases were smaller than the decreases observed in the previous month (down 1.0% in the euro area and 0.7% in the EU).
Compared with a year earlier, industrial import prices in May 2024 were 0.9% lower in the euro area. On the basis of a month-on-month comparison, industrial import prices increased marginally (up 0.1%) in May 2024 in the euro area. Compared with a year earlier, these prices in April 2024 were 2.4% lower in the EU; they were 0.5% higher on the basis of a month-on-month comparison.
_ES202407.png)
(%)
Source: Eurostat (ei_isir_m) and (ei_cphi_m)
In the 1st quarter of 2024
- private final consumption expenditure increased quarter on quarter by 0.2% in the euro area and by 0.3% in the EU (after an increase of 0.2% in both the euro area and the EU in the previous quarter)
- government final consumption expenditure decreased marginally (down 0.1%) compared with the final quarter of 2023 in the euro area and was unchanged in the EU (after increases of 0.6% in the euro area and 0.5% in the EU in the previous quarter)
- gross fixed capital formation (investment) decreased quarter on quarter by 1.4% in the euro area and by 1.3% in the EU (after increases of 0.7% in the euro area and 0.5% in the EU in the previous quarter).
In May 2024, the seasonally adjusted volume of sales in retail trade increased month-on-month by 0.1% in both the euro area and the EU, following on from decreases of 0.2% in the previous month in both the euro area and the EU.
_ES202407.png)
(%)
Source: Eurostat (namq_10_gdp) and (ei_isrr_m)
In May 2024, the seasonally adjusted unemployment rate was 6.4% in the euro area, unchanged from the previous month. In the EU, the rate remained at 6.0% as in the previous two months; the rate in the EU has been 6.0% or 6.1% since June 2022. Compared with May 2023, unemployment in May 2024 was higher by 3 000 people in the euro area, whereas it was higher by 163 000 people in the EU. In May 2024, the youth unemployment rate (for people aged 15–24 years) was 14.2% in the euro area, unchanged from the previous month. In the EU, the rate was 14.4%, down from 14.5% in the previous month. The rate for people aged 25 years or older was 5.6% in the euro area and 5.2% in the EU, both unchanged from the previous month.
In the 1st quarter of 2024, the number of people in employment increased by 0.3% in both the euro area and the EU compared with the previous quarter, following increases in the 4th quarter of 2023 of 0.3% in the euro area and 0.2% in the EU. Compared with the 1st quarter of 2023, employment in the 1st quarter of 2024 was 1.0% higher in the euro area and 0.9% higher in the EU.
Compared with the previous quarter, hourly labour costs increased by 1.2% in the euro area and 1.5% in the EU in the 1st quarter of 2024; in the 4th quarter of 2023, there had been increases of 1.1% in the euro area and 1.2% in the EU. Compared with the 1st quarter of 2023, hourly labour costs in the 1st quarter of 2024 were 5.1% higher in the euro area and 5.5% higher in the EU.
The employment expectations indicator, as measured by business and consumer surveys, decreased in the euro area in June 2024, down 1.6 points. This was due to more pessimistic employment plans among retail trade managers as well as less optimistic plans among construction and services managers outweighing less pessimistic plans among industrial managers. In the EU, the situation was similar: more pessimistic employment plans among retail trade and construction managers and less optimistic plans among services managers outweighed less pessimistic plans in industry such that the overall index decreased by 0.8 points. In June 2024, the index level (with a long-term average = 100) of the indicator was 99.7 in the euro area and 100.4 in the EU.
_ES202407.png)
(%)
Source: Eurostat (namq_10_a10_e), (ei_lmlc_q) and (ei_lmhr_m)
Interest rates
On 18 July 2024, the Governing Council of the European Central Bank (ECB) decided to keep the 3 key ECB interest rates unchanged. Accordingly, the interest rates on the main refinancing operations, the marginal lending facility and the deposit facility remained at 4.25%, 4.50% and 3.75%, respectively.
The euro area’s 3-month interest rate, the Euro Interbank Offered Rate (Euribor), decreased to 3.72% in June 2024, down from 3.81% in the previous month. Long-term interest rates (monthly average weighted 10-year government bond yields) of the euro area increased to 3.11% in June 2024 from 3.07% in the previous month. The EU’s long-term interest rates on government bonds increased to 3.43% in June 2024 from 3.40% in the previous month.
Exchange rates
In June 2024 (compared with the previous month), the monthly averages of day-to-day exchange rates were as follows
- euro-US dollar: USD 1.0759 (down from USD 1.0812)
- euro-Japanese yen: JPY 169.81 (up from JPY 168.54)
- euro-Swiss franc: CHF 0.9616 (down from CHF 0.9830).

Source: Eurostat (ei_mfir_m) and (ei_mfrt_m) and the European Central Bank (ECB)
Latest macroeconomic forecasts
The latest available forecasts by 4 international organisations – the European Commission (EC) [1], the ECB [2], the Organisation for Economic Co-operation and Development (OECD) [3] and the International Monetary Fund (IMF) confirmed for the euro area moderate economic growth in 2024, with growth forecasted to approximately double in 2025. The growth forecast for 2024 was revised upwards by the ECB, the OECD and the IMF in their latest forecasts compared with their previous ones; the European Commission left its forecast unchanged. Annual growth in the euro area is projected to be higher in 2025 than in 2024. The growth forecast for 2025 was revised downwards by the European Commission and the ECB, the IMF’s forecast was unchanged, while the OECD revised its forecast upwards. Two of these organisations – the European Commission and the OECD – revised their inflation forecasts for 2024 downwards in their latest forecasts; the IMF’s forecast was unchanged, while the ECB revised its forecast upwards. Annual inflation in the euro area is projected to be lower in 2025 than in 2024. Overall, the European Commission forecasts a gradual expansion amid high geopolitical risks.
_ES202407.png)
According to the latest information, euro area economic growth (based on real changes in GDP) is forecasted to be 0.7% (the OECD), 0.8% (the European Commission) or 0.9% (the IMF and the ECB) for 2024. For 2025, economic growth is forecasted to be 1.4% (the European Commission and the ECB) or 1.5% (the IMF and the OECD).
Compared with its previous forecast in winter 2024, the European Commission revised down its forecast for annual inflation rates in the euro area for 2024 (to 2.5% from 2.7%) and 2025 (to 2.1% from 2.2%) in its spring 2024 forecast. In June 2024, the ECB forecasted euro area annual inflation of 2.5% for 2024 (revised up from 2.3% in the previous forecast), while it also revised up its forecast for 2025 to 2.2% from 2.0%. In July 2024, the IMF forecasted an annual inflation rate for the euro area of 2.4% for 2024 (unchanged from its previous forecast), followed by a lower rate of 2.1% for 2025 (also unchanged from its previous forecast). In its report in May 2024, the OECD updated its inflation forecast for 2024 to 2.3% (revised down from 2.6% in its previous forecast) and maintained its forecast for 2025 at 2.2%.
Following a prolonged period of stagnation and a mild recession in the second half of 2023, growth returned to the euro area’s economy at the start of 2024. A gradual acceleration in growth is expected over the course of 2024 and 2025 as private consumption is supported by declining inflation, recovering purchasing power and continued employment growth. The improved outlook for global trade in goods should support external trade, helping to lift the prospects of the weakened manufacturing sector. Nevertheless, global trade and energy markets appear particularly vulnerable in the context of external risks.
Read more under Latest forecasts indicate a gradual expansion amid high geopolitical risks in the data visualisation.
Situation in the EU countries
In the 1st quarter of 2024, changes in GDP showed a generally upward development among the EU countries [4]. Based on the latest quarter-on-quarter rates of change, GDP increased in the 1st quarter of 2024 in 23 countries, remained stable in 1 and decreased in 3. Malta (up 1.3%) and Cyprus (up 1.2%) recorded the largest increases of GDP. The largest decrease was observed in Denmark (down 1.4%).
The highest estimated annual inflation rates (based on the HICP) [5] in June 2024 were recorded in Belgium (up 5.4%) and Romania (up 5.3%). The lowest inflation rates were recorded in Finland (up 0.5%), Italy (up 0.9%) and Lithuania (up 1.0%).
In May 2024, the lowest unemployment rates were recorded in Czechia (2.7%), Poland (3.0%), Malta, Slovenia (both 3.2%) and Germany (3.3%). The highest rates were in Spain (11.7%) and Greece (10.6%). Eurostat estimates that 13.2 million people in the EU were unemployed in May 2024, of which 11.1 million in the euro area.
In June 2024, the economic sentiment indicator showed a mixed development among the EU countries, increasing in 14, unchanged in 2 and decreasing in 10 (Ireland, no data available). The strongest increase was in Slovakia (up 8.0 points), while the strongest decrease was in Austria (down 4.6 points). The index level of the economic sentiment indicator (with a long-term average = 100) varied from 83.6 points in Estonia to 110.6 points in Greece.
Country in focus – Greece
The economy in Greece expanded in the 1st quarter of 2024: quarter-on-quarter, GDP increased by 0.7%, following on from an increase of 0.3% in the previous quarter. GDP was 2.1% higher in the 1st quarter of 2024 than a year earlier.
Industrial production decreased month-on-month by 3.1% in May 2024, after an increase of 7.5% in the previous month.
In June 2024, the economic sentiment indicator decreased by 0.4 points to 110.6 points, after an increase of 2.5 points in the previous month. Nevertheless, Greece had the highest economic sentiment indicator among EU countries and has had an index above 100.0 since November 2022.
Annual inflation increased marginally to 2.5% in June 2024 from 2.4% in the previous month. It was down from 2.8% a year earlier (June 2023) and from its peak of 12.1% in September 2022.
Industrial producer prices were 3.8% lower in May 2024 than a year earlier and 2.9% lower than the previous month.
The unemployment rate in May 2024 was 10.6%, the 2nd highest unemployment rate among EU countries. Approximately 505 000 people were unemployed in May 2024, of which 61 000 were young people (aged under 25 years).

Source: Eurostat (namq_10_gdp), (ei_isir_m) and (ei_bssi_m_r2) and DG Economic and Financial Affairs (ECFIN)
_ES202407.png)
(%)
Source: Eurostat (ei_isir_m) and (ei_cphi_m)
_ES202407.png)
(%)
Source: Eurostat (namq_10_gdp) and (ei_isrr_m)
_ES202407.png)
(%)
Source: Eurostat (namq_10_a10_e), (ei_lmlc_q) and (ei_lmhr_m)
Situation in the largest EU economies
- All except 1 of the 6 largest EU economies recorded quarter-on-quarter growth in GDP in the 1st quarter of 2024, with the highest growth rate at 0.8% in Spain and the lowest at 0.2% in both Germany and France. The exception was the Netherlands where a decrease (down 0.5%) was recorded in the 1st quarter of 2024.
- In June 2024, the annual inflation rate was lower than the previous month in Germany, Spain and France and higher in Italy, the Netherlands and Poland. The highest annual inflation rate among these economies was recorded in Spain (3.6%), just ahead of the Netherlands (3.4%); the lowest rate was in Italy (0.9%).
- The latest unemployment rates are for May 2024: these were the same as in the previous month in 4 of the largest EU economies, marginally higher in France and marginally lower in the Netherlands. Spain recorded the highest unemployment rate (11.7%) and Poland the lowest (3.0%).
- Economic sentiment decreased in 4 of these economies in June 2024 and increased in Spain and the Netherlands. The highest index level (with a long-term average = 100) was recorded in Spain (102.4 points).

Source: Eurostat (namq_10_gdp), (ei_cphi_m), (ei_lmhr_m) and (ei_bssi_m_r2) and DG Economic and Financial Affairs (ECFIN)
Country in focus – France
Compared with the previous quarter, GDP in France expanded by 0.2% in the 1st quarter of 2024; this followed on from an increase of 0.3% in the previous quarter. GDP was 1.3% higher in the 1st quarter of 2024 than a year earlier.
Industrial production contracted month-on-month in May 2024, down 2.1% after an increase of 0.6% in the previous month. Overall, industrial production was 3.2% lower in May 2024 than a year earlier.
In June 2024, the economic sentiment indicator decreased by 0.7 points to 97.2 points, having increased 2.2 points in the previous month.
The annual inflation rate was 2.5% in June 2024, down from 2.6% in the previous month. It was down from 5.3% a year earlier (June 2023) and from its peak of 7.3% in February 2023.
Industrial producer prices were 6.7% lower in May 2024 than a year earlier and 1.4% lower than the previous month.
The volume of retail sales decreased slightly in May 2024, down 0.2%, following on from the same decreases in each of the two previous months.
An unemployment rate of 7.4% was recorded in May 2024, up marginally from 7.3% in the previous month. In May 2024, 2.3 million people were unemployed in France, of which 611 000 were young people (aged under 25 years).

Source: Eurostat (namq_10_gdp), (ei_isir_m) and (ei_bssi_m_r2) and DG Economic and Financial Affairs (ECFIN)
_ES202407.png)
(%)
Source: Eurostat (ei_isir_m) and (ei_cphi_m)
_ES202407.png)
(%)
Source: Eurostat (namq_10_gdp) and (ei_isrr_m)
_ES202407.png)
(%)
Source: Eurostat (namq_10_a10_e), (ei_lmlc_q) and (ei_lmhr_m)
International context
Situation in the EFTA countries
- Compared with the previous quarter, GDP expanded in the 1st quarter of 2024 in Switzerland (up 0.5%) and Norway (up 0.2%), while it contracted in Iceland (down 0.9%).
- In June 2024, Iceland recorded the highest annual inflation rate (up 5.0%), followed by Norway (up 2.3%) and Switzerland (up 1.3%). These rates were all lower than those of the previous month.
- In May 2024, the unemployment rate decreased in Norway (to 4.1% from 4.3%). In March 2024, the unemployment rate was 4.1% in Switzerland, while in February 2024 it was 3.5% in Iceland.
_ES202407.png)
(%)
Source: Eurostat (namq_10_gdp), (ei_cphi_m) and (ei_lmhr_m)
Situation in other non-EU countries
- Compared with the previous quarter, GDP expanded in the 1st quarter of 2024 by 1.6% in China and by 0.3% in the United States, while it contracted in Japan by 0.5%. Compared with the 1st quarter of 2023, GDP in the 1st quarter of 2024 was 5.3% higher in China and 2.9% higher in the United States, while it was 0.3% lower in Japan.
- In June 2024, the annual inflation rate fell to 1.8% in the United States (from 2.0% in the previous month) and to 0.2% in China (from 0.3% in the previous month). In May 2024, the annual inflation rate in Japan was 2.8%.
- In May 2024, the unemployment rate was stable in Japan at 2.6%, while it increased in the United States to 4.0% (from 3.9%).
_ES202407.png)
(%)
Source: Eurostat (ei_cphi_m) and (ei_lmhr_m) and the OECD
Source data for tables and figures
Data sources
Data for non-EU countries come either from Eurostat’s datasets or from an external source, such as the OECD Data Explorer.
Data for the euro area, EU and EU countries
- GDP, quarter-on-quarter and year-on-year percentage change, seasonally and calendar adjusted (namq_10_gdp)
- Industrial production, month-on-month percentage change, seasonally and calendar adjusted, and year-on-year percentage change, calendar adjusted (ei_isir_m)
- Economic sentiment indicator, seasonally adjusted (Directorate-General for Economic and Financial Affairs (ECFIN) ei_bssi_m_r2)
- Inflation (based on the HICP), year-on-year percentage change (not adjusted) (ei_chpi_m)
- Industrial producer prices, month-on-month and year-on-year percentage change (not adjusted) (ei_isir_m)
- Import prices, month-on-month and year-on-year percentage change (not adjusted) (ei_isir_m)
- Retail trade volume of sales, month-on-month percentage change, seasonally and calendar adjusted, and year-on-year percentage change, calendar adjusted (ei_isrr_m)
- Household final consumption expenditure, quarter-on-quarter and year-on-year percentage change, seasonally and calendar adjusted (namq_10_gdp)
- Government final consumption expenditure, quarter-on-quarter and year-on-year percentage change, seasonally and calendar adjusted (namq_10_gdp)
- Gross fixed capital formation, quarter-on-quarter and year-on-year percentage change, seasonally and calendar adjusted (namq_10_gdp)
- Unemployment rate, seasonally adjusted (ei_lmhr_m) and unemployment in thousand people, seasonally adjusted (ei_lmhu_m)
- Hourly labour costs (based on the labour cost index), month-on-month, quarter-on-quarter and year-on-year percentage change, seasonally and calendar adjusted (ei_lmlc_q)
- Employment, quarter-on-quarter percentage change, seasonally adjusted, and year-on-year percentage change (not adjusted) (namq_10_a10_e)
- Employment expectations indicator, seasonally adjusted (Directorate-General for Economic and Financial Affairs (ECFIN) ei_bsee_m_r2)
- Exchange rates (not adjusted) (ei_mfrt_m)
- Interest rates (not adjusted) (ei_mfir_m)
Data for Iceland, Norway and Switzerland
- GDP, quarter-on-quarter and year-on-year percentage change, seasonally and calendar adjusted (namq_10_gdp)
- Inflation (based on the HICP), year-on-year percentage change, all items (not adjusted) (ei_cphi_m)
- Unemployment rate, seasonally adjusted (ei_lmhr_m)
Data for China, Japan and the United States
- GDP, quarter-on-quarter and year-on-year percentage change, seasonally and calendar adjusted (OECD – Quarterly real GDP growth – G20 countries)
Data for China and Japan
- Inflation, year-on-year percentage change (OECD – Consumer price indices COICOP 1999 and COICOP 2018)
Data for the United States
- Unemployment rate, seasonally adjusted (ei_lmhr_m)
- Inflation (based on the HICP), year-on-year percentage change (not adjusted) (ei_cphi_m)
Macroeconomic forecasts
- European Commission Economic Forecast, see
- ECB Macroeconomic Projections, see
- IMF World Economic Outlook, see
- OECD Economic Outlook, see
Rates of change
For monthly data, 2 rates of change are presented
- M/M-1: change compared with the previous month
- M/M-12: change compared with the same month of the previous year.
For quarterly data, 2 rates of change are presented
- Q/Q-1: change compared with the previous quarter
- Q/Q-4: change compared with the same quarter of the previous year.
Context
The principal European economic indicators (PEEIs) represent a comprehensive set of infra-annual macroeconomic statistics aiming to describe the economic and labour market situation as well as price developments in the euro area, the EU and the EU countries; these statistics are of particularly high importance for economic and monetary policy.
The Communication of the European Commission to the European Parliament and the Council on euro area statistics Towards improved methodologies for euro area statistics and indicators of November 2002 defined the list of PEEIs and their timeliness targets, amended in the 2008 Economic and Financial Committee (EFC) report.
In 2002, Eurostat produced an initial list of 19 PEEIs, which subsequently expanded to 22. Data for these indicators are published regularly and posted in the dedicated Euro indicators section on the Eurostat website. Since 2002, PEEIs have been regularly monitored and improved in terms of coverage and timeliness. The list of indicators includes, for example, GDP, private final consumption, the external trade balance and the 3-month interest rate.
The progress that has been achieved with the timeliness and availability of PEEIs and remaining challenges are constantly monitored. Each year Eurostat, in cooperation with the ECB, drafts a Status Report on Information Requirements in the Economic and Monetary Union (EMU) which is submitted to the EFC and then to the Economic and Financial Affairs Council (ECOFIN). All reports can be found in the dedicated Euro indicators section under publications.
Direct access to
Main tables
Dedicated section
Visualisations
- Previous versions of Eurostatistics data visualisation:
Notes
- ↑ Following the Council Decision (2022/1211/EU) of 12 July 2022 on the adoption by Croatia of the euro on 1 January 2023, in line with past practice, all forecast numbers (in other words for 2022–24) for the euro area aggregate include Croatia with a weight of about 0.5%.
- ↑ From December 2022 onwards, the Eurosystem staff projections for the euro area include Croatia in view of its accession to the euro area on 1 January 2023.
- ↑ The euro area aggregate includes only OECD member countries (Croatia, Cyprus and Malta are excluded from the euro area aggregate as they aren’t members of the OECD).
- ↑ For further information, see GDP main aggregates and employment estimates for the first quarter of 2024.
- ↑ For further information, see Annual inflation down to 2.5% in the euro area – June 2024.