Data extracted in March 2024.
Planned article update: 30 April 2025.
Highlights
In 2022, the life expectancy of women was higher than that of men in all European Neighbourhood Policy-South countries. The difference ranged between 4.6 years in Tunisia and 2.2 years in Palestine compared to a difference of 5.4 years in the EU.
In 2022, the unemployment rate was 19.7 percentage points higher for women than for men in Palestine which by far was the highest difference within the ENP-South region. By comparison, in the EU, the unemployment rate was just 0.8 pp higher for women than for men.
Among the European Neighbourhood Policy-South countries, the unemployment rate for young adults (aged 15-24) was on average 19.9 percentage points higher than for the rest of the working age population (aged 25-74) in 2022.
This article is part of an online publication. It provides data on gender inequalities and inequalities between age groups for nine of the countries that form the European Neighbourhood Policy-South (ENP-South) region — Algeria, Egypt, Israel, Jordan, Lebanon, Libya, Morocco, Palestine [1] and Tunisia; cooperation with Syria is currently suspended. Data for Lebanon do not account for Palestinian refugee camps.
This article presents statistics on differences between men and women with respect to life expectancy; gender and age gaps with respect to unemployment; gender disparity in long-term unemployment; and differences between the sexes in completion of primary education. These statistics highlight inequalities between men and women including between young adults and the rest of the adult population. They cover important issues with respect to equal opportunities for all and are relevant for monitoring and improving policies which aim to reduce inequalities in society. In addition to their relevance, the selection of indicators is also based on data availability. The differences in shares of the population, measured in percentages, are expressed as percentage points (pp), except differences in life expectancy which are measured in years.
Differences in life expectancy between women and men
Life expectancy at birth is the average number of years a newborn child can expect to live. The gender gap for life expectancy may reflect disparities between women and men with respect to living conditions and access to health services. The life expectancy gender gap is defined as the number of years that a woman can expect to live (at birth) less the number of years for a man.
Over the period from 2012 to 2022, the ENP-South countries consistently had tighter gender gaps for life expectancy than the EU.
In 2022, Tunisia had the highest life expectancy gender gap among the ENP-South countries, with newborn females expected to live on average 4.6 years longer than newborn males. This was an increase of 0.2 years up from 2021, when the gap stood at 4.4 years.
In Israel, the gender gap was 3.7 years in 2012 and 4.1 years in 2022. In the years between, it fluctuated between 3.5 years (2016) and 4.2 years (2020).
The life expectancy gender gap in Algeria was relatively stable over the period 2012-2019, with a gender gap of around 1.3 years, before rising to 3.6 years in 2020 (more recent data are not available).
In Morocco, the life expectancy gender gap significantly increased over the period 2012-2022, from 1.8 years in 2012 to 3.4 years in 2022, with the main increase happening in 2014.
In Jordan, there were several substantial shifts in the life expectancy gender gap over the period 2012-2022. The gap increased from 2.8 years in 2012 and 2013 to 4.0 years in 2014 and 2015, before falling to 1.5 in 2016 and 1.4 years from 2017 to 2019. It then rose back to 2.8 years in 2020 and remained stable at this level in 2021 and 2022.
The life expectancy gender gap in Egypt remained stable at 2.8 years between 2012 and 2016, before decreasing to 2.4 years in 2018 and 2019. Data are not available for 2017 or from 2020 to 2022.
In Palestine, the gap increased from 2.8 years in 2012 to 3.1 years in 2016, only interrupted by a fall to 2.6 years in 2014. It subsequently fell to 2.3 years in 2017 and remained stable until 2021, before a slight decrease to 2.2 years in 2022.
Data for Lebanon and Libya are not available.
In the EU, the life expectancy gender gap decreased from 6.0 years in 2012 to 5.4 years in 2022 (provisional data), with the gap between male and female in terms of life expectancy at birth fluctuating between 5.8 years (2013-2014) and 5.5 years (2017-2019) in-between.
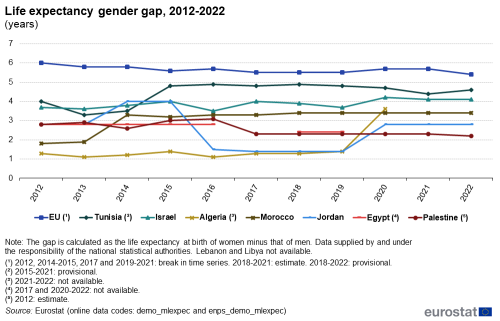
(years)
Source: Eurostat (demo_mlexpec) and (enps_demo_mlexpec)
Unemployment gender gap
The unemployment rate is the percentage of persons in the labour force that are currently unemployed but actively seeking work. As youth unemployment, i.e., unemployment among economically active young adults aged 15-24, is analysed separately later in this article, the current section is focusing on the adult population aged 25-74. A higher unemployment rate for one sex compared to the other may reflect gender-specific disparities in labour market access and opportunities. The gender gap presented in this section is calculated as the unemployment rate of women aged 25-74 minus the corresponding unemployment rate of men. Positive values indicate a higher unemployment rate for women than for men, and vice versa.
Among the ENP-South countries, Israel was the only country with higher unemployment for men than for women, with an unemployment rate gender gap of -0.2 pp in 2022. In all the other ENP-South countries, the unemployment rate of women was higher than that of men, with the unemployment gender gap ranging from 3.6 pp in Lebanon to 19.7 pp in Palestine in 2022.
The unemployment gender gap increased significantly in Palestine over the period 2012-2022, fluctuating year-on-year between 10.4 pp (2012) and 20.0 pp (2021).
In Algeria, the unemployment gender gap increased from 6.2 pp in 2012 to 10.5 pp in 2016 and 2017, thereafter decreasing to 7.8 pp in 2018 before reaching a peak at 11.0 pp in 2019 (the most recent data available).
The unemployment gender gap in Jordan fluctuated between 6.5 pp at the beginning of the period in 2012, and 9.7 pp at the end in 2022, except in 2017 when it peaked at 13.8 pp.
Recent data for Libya are not available, with the gap of 8.2 in 2012 the latest data available.
The unemployment gender gap in Tunisia remained within the range 9.2 pp (2021) to 9.8 pp (2020) between 2019 and 2021, then fell to 8.1 pp in 2022. Data are not available between 2012 and 2018.
In Egypt, the unemployment gender gap increased from 11.4 pp in 2012 to a peak at 13.9 pp in 2015. The gap of 13.2 pp in 2017 preceded a period of substantial year-on-year changes, with unemployment gender gaps varying between 12.0 pp (2019) and 7.2 pp (2021) (data for 2022 is not available).
For Morocco, the gender gap remained at or below 1.5 pp between 2012 and 2015, before shifting to a new level between 4.3 pp (2020) and 4.8 pp (2017). It remained at this new level with 4.6 pp in 2021, the latest data available.
In Lebanon, the unemployment rate was 5.4 pp higher for women than for men in 2018. In 2022, the gap had fallen to 3.6 pp. Data are only available for those two years.
There were only marginal unemployment gender gaps in Israel over the period 2012-2022. The gap was negative at -0.1 pp in 2012, meaning that the unemployment rate was 0.1 pp higher for men than for women. This changed in 2015 and 2016, when the unemployment rate for women was 0.2 pp higher than for men. However, from 2018 onwards, this changed back to an unemployment gender gap between -0.2 pp (2018 and 2022) and -0.6 pp (2020). Data are not available for 2013, 2017 and 2019.
The EU unemployment gap slightly increased between 2012 and 2015, from 0.3 pp to 0.4 pp, before rising to 0.7 pp in 2016 and remaining at this level, with the only exceptions gaps of 0.8 pp in 2018 and 2022.
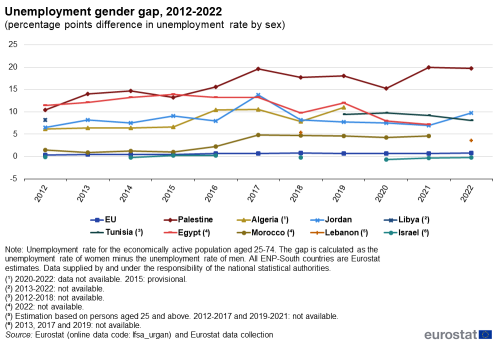
(percentage points difference in unemployment rate by sex)
Source: Eurostat (lfsa_urgan) and Eurostat data collection.
Unemployment gap between young adults and the rest of the economically active population
The unemployment gap between economically active young people, aged 15-24, and the rest of the active population, aged 25-74, is calculated as the unemployment rate of active young people less the unemployment rate of the rest of the economically active population. Positive values indicate a higher unemployment rate for young people than for the rest of the active population.
Between 2012 and 2022, the unemployment rate for 15-24-year-olds was consistently higher than that of 25-74-year-olds in both the EU and the ENP-South countries, marking out ‘youth unemployment’ as a specific concern for policy makers and the labour market.
In Libya, economically active young people had a 33.0 pp higher unemployment rate than 25-74-year-olds, i.e. the rest of the labour force, in 2012 (more recent data not available).
In Jordan, variations in the age gap in unemployment were observed between 2013 and 2022, from 26.0 pp in 2013 (2012 data not available) to 29.7 pp in 2022, with a peak at 30.9 pp in 2021. In the period 2017-2021, the gap widened each year.
In Tunisia, the unemployment gap fluctuated between 26.8 pp (2019) and 22.6 pp (2020), ending the period at 24.2 pp in 2022. Data are not available from 2012 to 2018.
The unemployment gap in Lebanon between economically active young people and the rest of the active population was estimated at 14.7 pp in 2018 and 22.2 pp in 2022. Data are only available for those two years.
In Morocco, the unemployment gap significantly increased between 2012 and 2021, from 11.7 pp in 2012 to 22.0 pp in 2021 (more recent data not available). Except for slight decreases in 2018 and 2019, the gap increased throughout the period.
The unemployment gap for young people in Algeria decreased from 20.0 pp in 2012 to 17.5 pp in 2014, before growing to a high at 20.1 pp in 2018. The gap subsequently fell to 17.8 pp in 2019. Data are not available between 2020 and 2022.
In Palestine, the unemployment gap between the two age groups fluctuated over the period 2012-2022, starting at 21.2 pp in 2012 and moving within the range 18.9 pp (2019) to 23.4 pp (2013). However, at the end of the period, the gap decreased substantially, from 19.3 pp in 2021 to 14.8 pp in 2022.
In Egypt, the difference between the unemployment rate of young people and that of the rest of the active population decreased from 20.4 pp in 2012 to 12.0 pp in 2021, with the gap generally within this range throughout this period. The exceptions were 22.6 pp in 2017 and 11.3 pp in 2020. Data for 2022 are not available.
The unemployment gap between young adults in the age group 15-24 years old and the rest of the economically active population in the age group 25-74 years old was lower in Israel than in any other ENP-South country. The gap decreased from 6.3 pp in 2012 to 3.7 pp in 2022, despite some fluctuations around this trend. The narrowest gaps were 3.3 pp in 2021 and 3.4 pp in 2019.
In the EU, the gap in unemployment rate between young adults and the rest of the economically active population narrowed over the period 2012-2022, from 14.2 pp in 2012 to 9.1 pp in 2022, with only the gap of 14.4 pp in 2013 outside this range.
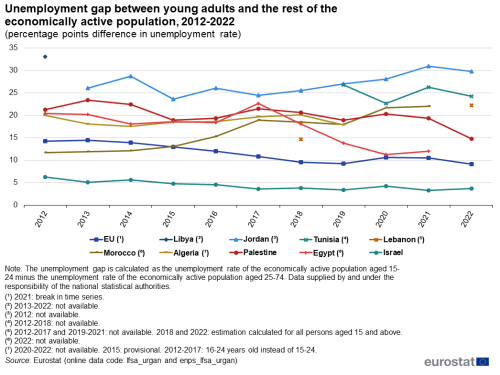
(percentage points difference in unemployment rate)
’’Source:’’ Eurostat (lfsa_urgan) and (enps_lfsa_urgan).
Long-term unemployment gender gap
Long-term unemployment refers to unemployed persons who have been actively seeking employment for one year or more. Long-term unemployment differs to shorter-term unemployment in several aspects. Long-term unemployment points to structural issues in the labour market, such as mismatch between offer and demand or between the availability of skills and actual qualifications demanded, etc. Long-term unemployed persons may also see their skills deteriorate or becoming outdated through lack of training and experience. Long-term unemployment data is an important indicator for policymakers and analysts with respect to structural problems in the labour market. The gender gap in long-term unemployment is calculated as the long-term unemployment rate of women minus that of men.
In Palestine, the long-term unemployment gender gap generally showed an increasing trend over the period 2012-2022, increasing from 11.2 pp in 2012 to a high of 19.7 pp in 2021, before falling slightly to 19.4 pp in 2022. The gap shrunk slightly in 2015, 2018, 2020 and 2022.
The long-term unemployment gender gap in Algeria was 4.1 pp in 2012 and remained relatively stable at 4.0 pp in 2013, before widening to 5.5 pp in 2014. A dip to 2.8 pp in 2015 was followed by year-on-year increases to a peak of 9.5 pp in 2018. In 2019, the gap retracted to 7.6 pp (more recent data not available).
In Egypt, the gender gap in long-term unemployment remained relatively stable 2012-2015, within the interval 0.8 pp (2012) to 2.4 pp (2013). In 2016, a sharp increase to 13.2 pp was observed, up from 1.6 pp the previous year. From 2016 to 2019, the gap remained in the range 13.3 pp (2017) to 10.9 pp (2018). In the following years, the gap contracted, falling to 5.9 pp in 2021. Data for 2022 are not available.
In Tunisia, the gap between women and men in long-term unemployment rose from 4.7 pp in 2019 to 7.2 pp 2020, remaining at the same level in 2021 (7.1 pp) before decreasing to 5.6 pp in 2022. Data are not available between 2012 and 2018.
The gender gap in long-term unemployment in Morocco fluctuated over the period 2012-2021, overall widening from 2.1 pp in 2012 to 5.2 pp in 2021, the most recent data available. Within the period, the gap fell within 1.5 pp (2013) to 2.7 pp (2016) between 2012 and 2016, then widened to between 5.6 pp (2017 and 2018) and 5.2 pp (2021) for the rest of the period.
In Lebanon, the long-term unemployment gender gap was estimated at 3.8 pp in 2018 and 5.0 pp in 2022. Data are only available for those two years.
In Israel, there were only marginal differences in long-term unemployment rates of women and men, with gender gaps of 0.0 pp or -0.1 pp throughout the period 2012-2022.
Data for Jordan and Libya are not available.
Between 2012 and 2022, the long-term unemployment rates for men and women were not very different in the EU, ranging between -1.7 pp (2017) and 0.7 pp (2021).
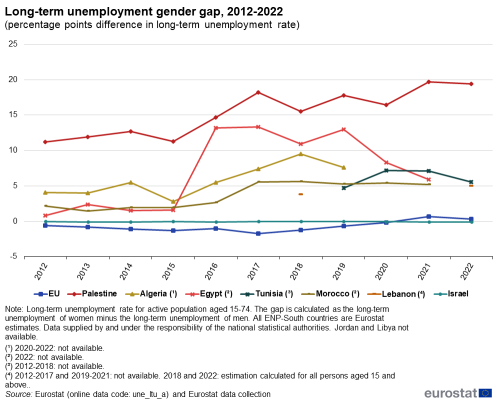
(percentage points difference in long-term unemployment rate)
’’Source:’’ Eurostat (une_ltu_a) and Eurostat data collection.
Gender gap in completion of primary education
The completion rate of primary education, as defined in the International standard classification of education (ISCED), is measured as the number of students in the reference year that successfully completed the last year of primary education, as a share of all children of the age when they should normally complete primary education. Primary education typically lasts until between the ages of 10 and 12[2]. The gender gap with respect to completed primary education is calculated as the rate of completion by girls less the rate of completion by boys, thus positive values indicate a higher completion rate for women than men.
In Morocco, the completion rate of primary education in 2012 was almost the same for girls and boys with a gender gap of just 0.2 pp. This gap fluctuated within the range -1.5 pp (2015, the only year with higher completion rate for boys than girls) to 5.1 pp (2018). The gender gap was 4.9 pp in 2022, the second highest gap observed over the period 2012-2022. Overall, the period was characterised by lower gender gaps in the first part of the period, from 2012 to 2015, with wider gender gaps in primary education completion from 2016 onwards.
The completion rate of primary education in Tunisia was 3.6 pp higher for girls than for boys in 2018 (other years not available).
In Egypt, the gender gap for completion of primary education was 4.0 pp in 2012. Between 2012 and 2017, this gap fluctuated between 4.3 pp (2017) and 3.2 pp (2014), except in 2015 with a gender gap of 1.2 pp. From 2018 to 2020, the gender gap shrunk to between 1.1 pp (2019) and 1.4 pp (2020). Data are not available for 2021 and 2022.
In Israel, the completion rate of primary education showed a gender gap favouring girls by 0.8 pp in 2012. However, this trend overturned in the following years; the completion rate for boys exceeded that of girls in 2013 (-0.5 pp) and 2014 (-1.1 pp), as well as in 2016 (-0.9 pp). In the other years of the period 2012-2022, the primary education completion rate of girls was higher than that of boys, by between 0.1 pp (2019) and 1.5 pp (2020). In 2022, the completion rate was 0.6 pp higher for girls than for boys
In Palestine, there was no clear trend with respect to differences in completion of primary education. Over the period 2012-2019, the gender gap fluctuated between -2.2 pp (2018) and 1.6 pp (2015), standing at 0.6 pp both at the beginning of the period in 2012 and at the end in 2019. Data are not available from 2020 to 2022. In 2013, the completion rates were equal for boys and girls, while in 2017 and 2018 the completion rate was higher for boys than for girls.
The completion gender gap in Jordan increased from 1.6 pp in 2016 to 2.5 pp in 2017, indicating a higher share of girls than boys having completed primary education, but reached parity (no difference between completion rates) in 2018. Data are available only for these three years.
Data on primary education completion rates by sex are not available for Algeria, Lebanon, Libya and the EU.
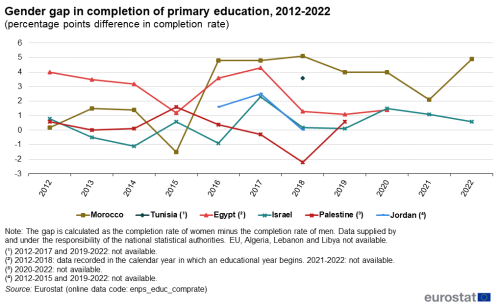
(percentage points difference in completion rate )
Source: Eurostat (enps_educ_comprate)
Source data for tables and graphs
Data sources
The data for ENP-South countries are supplied by and under the responsibility of the national statistical authorities of each country on a voluntary basis. The data presented in this article result from an annual data collection cycle that has been established by Eurostat. Cooperation with Syria is currently suspended. These statistics are available free-of-charge on Eurostat’s website, together with a range of different indicators covering most socio-economic areas.
Context
An important aspect of European policies and of the European Green Deal in particular, is the commitment to leaving no-one behind in the transformation underway towards a climate-neutral, resource-efficient, modern and just society and economy. Policy initiatives towards equal opportunities, enabling full and fair participation in society for everyone, is a central piece of this transformation. This article presents a selection of indicators relevant to analysing inequalities between different sections of society, based on the policy relevance of the indicators as well as the availability of data. The indicators presented, highlight in particular, the differences in the situation between women and men (i.e. gender gaps) with respect to life expectancy, opportunities in the labour market and opportunities to achieve a basic education. However, inequalities also exist with respect to groups with other characteristics, for example with respect to young people’s access to the labour market and thus their opportunities to earn a living and create positive economic prospects for themselves.
The European Neighbourhood Policy (ENP), launched in 2003 and developed throughout 2004, supports and fosters stability, security and prosperity in the EU’s neighbourhood. revised in 2015. The main principles of the revised policy are a tailored approach to partner countries; flexibility; joint ownership; greater involvement of EU member states and shared responsibility. The ENP aims to deepen engagement with civil society and social partners. It offers partner countries greater access to the EU's market and regulatory framework, standards and internal agencies and programmes.
The Joint Communication on Renewed Partnership with the Southern Neighbourhood – A new Agenda for the Mediterranean, accompanied by an Economic and Investment Plan for the Southern neighbours, of 9 February 2021 further guides cooperation with the ENP-South countries. Additional information on the policy context of the ENP is provided on the website of Directorate-General European Neighbourhood Policy and Enlargement Negotiations (DG NEAR).
In cooperation with its ENP partners, Eurostat has the responsibility to promote and implement the use of European and internationally recognised standards and methodology for the production of statistics, necessary for designing and monitoring policies in various areas. Eurostat manages and coordinates EU efforts to increase the capacity of the ENP countries to develop, produce and disseminate good quality data according to European and international standards.
Reliable and comparable data are essential for evidence-based decision-making. They are needed to monitor the implementation of the agreements between the EU and the ENP-South countries, the impact of policy interventions and the reaching of the Sustainable Development Goals (SDGs).
The main objective of Euro-Mediterranean cooperation in statistics is to enable the production and dissemination of reliable and comparable data, in line with European and international norms and standards.
The EU has been supporting statistical capacity building in the region for a many years through bilateral and regional capacity-building activities. This takes the form of technical assistance to partner countries’ national statistical authorities as well as through targeted assistance programmes, such as the MEDSTAT programme which provides capacity building support in the form of activities such as training courses, study visits, working groups and workshops, exchange of best practice and the transfer of statistical know-how.
Notes
- ↑ This designation shall not be construed as recognition of a State of Palestine and is without prejudice to the individual positions of the Member States on this issue.
- ↑ UNESCO Institute for Statistics (UIS): International Standard Classification of Education ISCED 2011, Section 9 ISCED Levels, Sub-section Level 1 Primary education, Paragraph 122
Explore further
Other articles
Database
Thematic section
Publications
Books
Factsheets
- Basic figures on the European Neighbourhood Policy-South countries — 2023 edition
- Basic figures on the European Neighbourhood Policy-South countries — 2022 edition
- Basic figures on the European Neighbourhood Policy-South countries — 2021 edition
Leaflets
- Basic figures on the European Neighbourhood Policy — South countries — 2020 edition
- Basic figures on the European Neighbourhood Policy — South countries — 2019 edition
- Labour force statistics in Enlargement and ENP‑South countries — 2019 edition
- Basic figures on the European Neighbourhood Policy — South countries — 2018 edition
- Basic figures on the European Neighbourhood Policy — South countries — 2016 edition
- Labour force statistics for the Mediterranean region — 2016 edition
- Basic figures on the European Neighbourhood Policy — South countries — 2015 edition
Methodology
- Southern European Neighbourhood Policy countries (ENP-South) (enps) (ESMS metadata file — enps_esms)
- LFS series - detailed annual survey results (lfsa) (ESMS metadata file — lfsa_esms)
External links
- European Union External Action Service — Middle East and North Africa (MENA)
- European External Action Service — European Neighbourhood Policy
- MEDSTAT
- European Commission — Employment, Social Affairs & Inclusion
- European Commission - DG Justice and Consumers- Gender equality
- OECD - Gender Data Portal
- UN - Minimum set of gender indicators
- UNECE - Gender statistics
