Natural gas market indicators
Data extracted in March 2024.
Planned article update: June 2025
Highlights
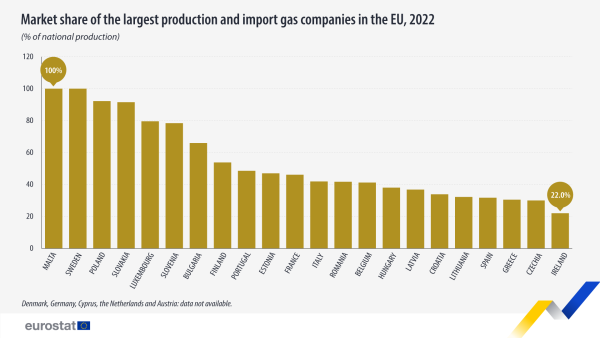
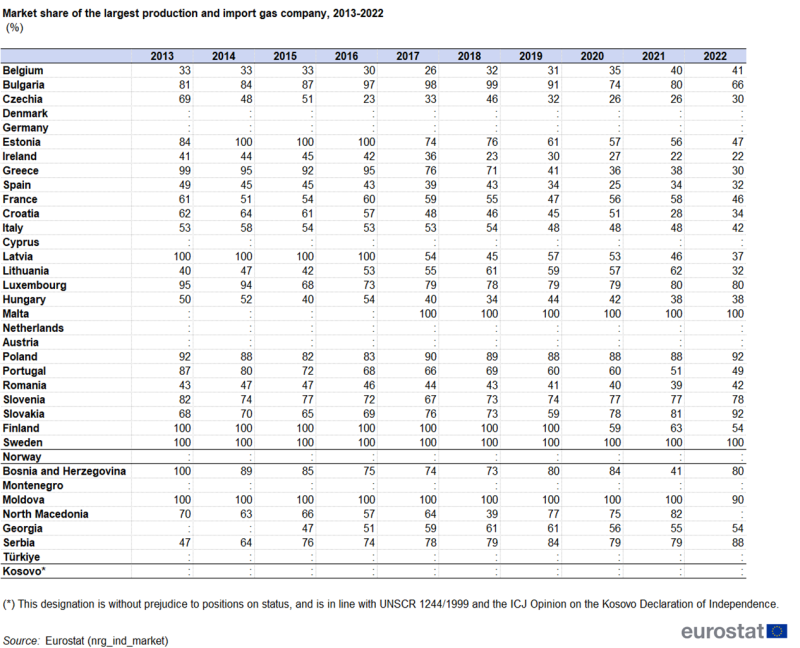
The lowest market penetration of the largest natural gas import and production company was 22% in Ireland, in 2022, in Czechia and Greece it was 30 %.
This article takes a look at the natural gas markets in the European Union (EU). It presents recent statistical data on market concentration. Specifically, it analyses the number of companies that bring natural gas to the national market by importing it or producing it (IMport and PROduction = IMPRO) and retail companies across EU Member States, Bosnia and Herzegovina, Montenegro, Moldova, North Macedonia, Georgia, Serbia, Türkiye and Kosovo*. For Denmark, Germany, Malta and the Netherlands the data is only partially available.
In 2022 the estimated number of main natural gas IMPRO companies (companies with a market share of 5 % or more) remained 87, the same number of companies reported in 2021, with slight fluctuations per country. The estimated total number of natural gas IMPRO companies in the EU, however, increased in 2022 by 69, compared with 2021.
(*)This designation is without prejudice to positions on status, and is in line with UNSCR 1244/1999 and the ICJ Opinion on the Kosovo Declaration of Independence.
Full article
General overview
During 2013-2022 the estimated number of main companies with a market share above 5 %, that either produced natural gas by national production or brought natural gas into the country (IMPRO) increased from 59 to 87 companies in the EU, without including Denmark, Germany and the Netherlands.
In the EU, the total number of natural gas IMPRO companies increased significantly in the period from 2013, when the figure stood at 346 (excluding Denmark and the Netherlands). In 2022, there were around 591 companies (missing data: Denmark and the Netherlands). This means that a significant number of new (small size) companies entered the IMPRO natural gas market during this period.
Natural gas market - import and production (IMPRO)
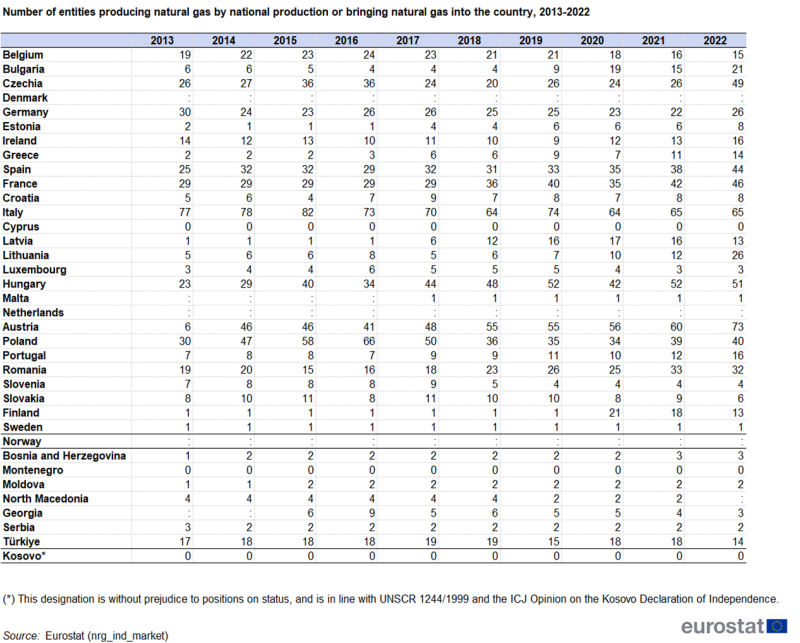
The information in Table 1 refers to the total number of companies that brought natural gas to the national market by importing it or producing it (IMPRO companies). In 2022, one single company dominated the market in Malta and Sweden. Lithuania saw the largest increase, from 12 IMPRO companies in 2021 to 26 in 2022. Between 2021 and 2022 the total number of IMPRO companies remained stable in six EU Member States (Croatia, Italy, Luxembourg, Malta, Slovenia and Sweden). Increases were observed in 12 Member States, while the number of IMPRO companies went down in six EU Member States.
Source: Eurostat (nrg_ind_market)
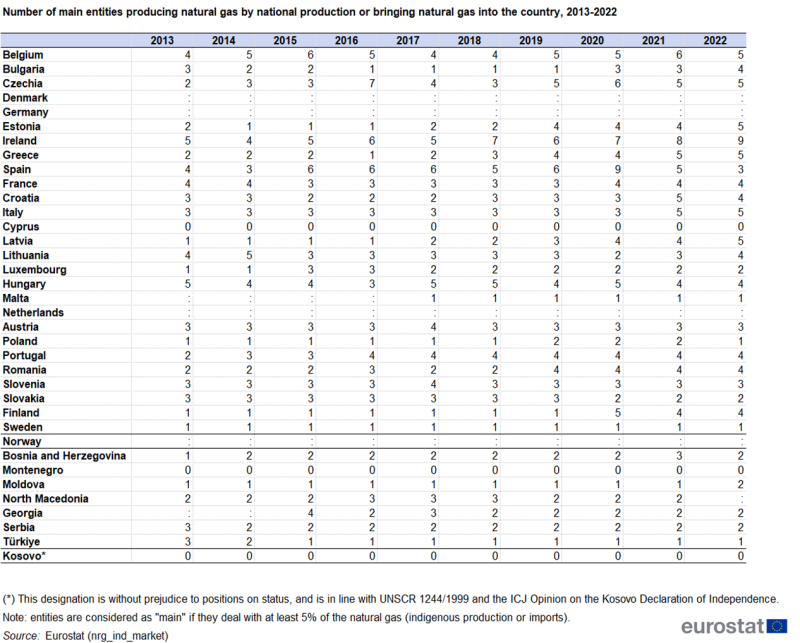
Table 2 shows the number of main IMPRO companies that have a market coverage of at least 5 % of the total national indigenous production and import of natural gas. Three EU Member States (Malta, Poland and Sweden) declared only one single enterprise to have a significant share in 2022. In Ireland there were nine IMPRO companies of considerable size, which is the highest figure in the EU, while in Belgium, Czechia, Estonia, Greece, Italy and Latvia, there were five. During the period 2013-2022, the estimated number of main IMPRO companies (5 %) in the EU fluctuated between 58 and 87 companies. Compared with 2021, the estimated total number of main IMPRO companies in 2022 remained the same (87).
Source: Eurostat (nrg_ind_market)
Figure 1 displays the cumulated market shares of main IMPRO companies in a given country having each a share of at least 5 % of their respective national markets. Market dominance was lowest in Spain (50.7 %), which means that relatively small IMPRO companies cover 49.3 % of their total national gas market.
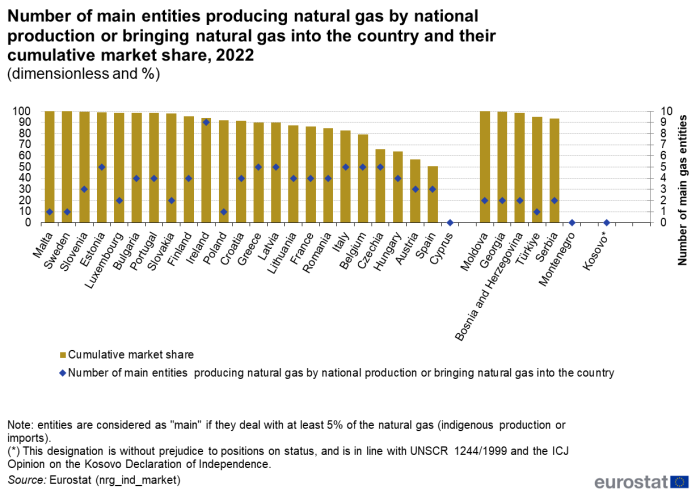
(dimensionless and %)
Source: Eurostat (nrg_ind_market)
Table 3 displays the market share of the single largest IMPRO company as a share of national indigenous production and import. Apart from Malta and Sweden, where only one entity dominates the national market, figures above 80 % for the largest IMPRO company are observed in Poland (92 %) and Slovakia (92 %). The lowest market penetration of the largest IMPRO company at national level was observed in Ireland (22 %).
(%)
Source: Eurostat (nrg_ind_market)
Natural gas market - retail
EU Member States, as well as Bosnia and Herzegovina, Montenegro, Moldova, North Macedonia, Georgia, Serbia, Türkiye and Kosovo also reported information for 2022 concerning the retailing (sales) sector for natural gas.
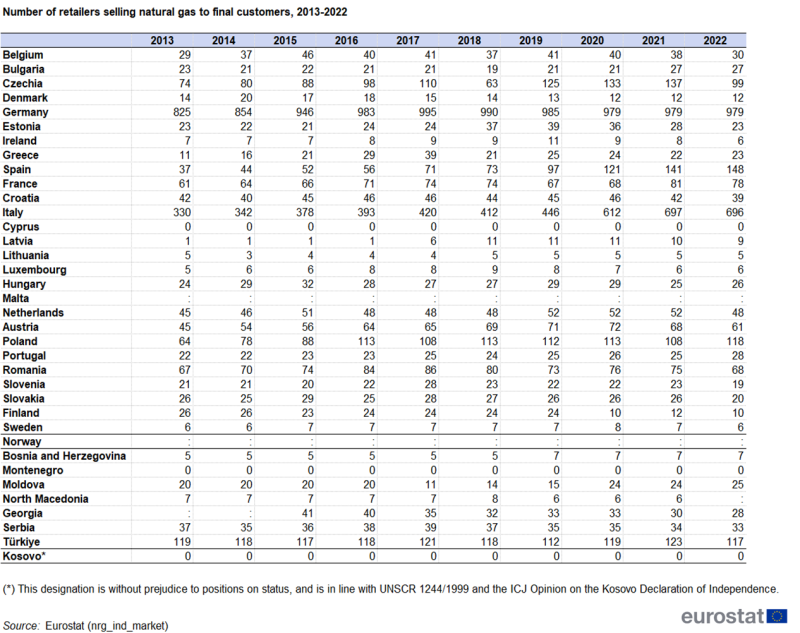
Table 4 presents information on the total number of retailing companies that sell natural gas to final customers. In 2022, Germany had by far the highest number of retailers, 979, followed by Italy with 696. Between 2021 and 2022, the number of retailers decreased in 15 EU Member States, remained stable in five and increased in five Member States that reported data.
Source: Eurostat (nrg_ind_market)
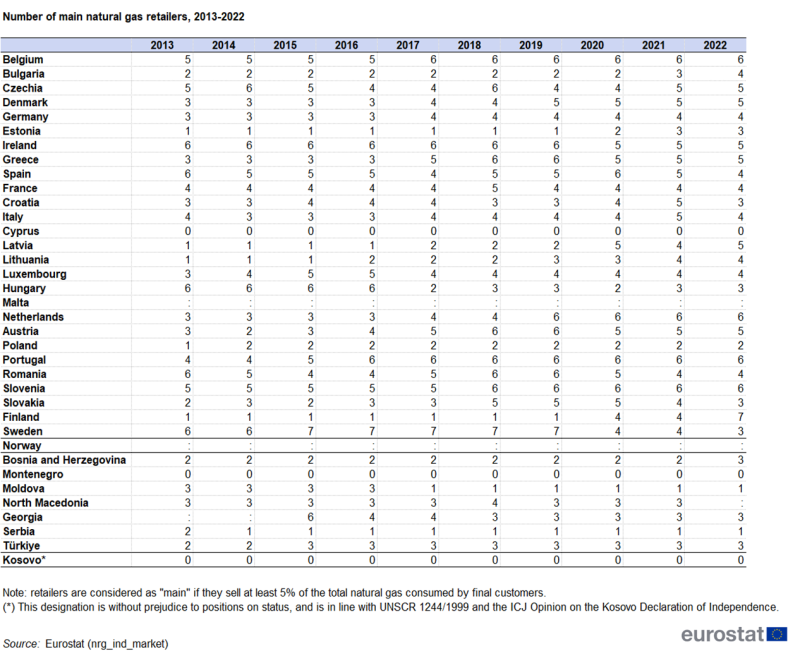
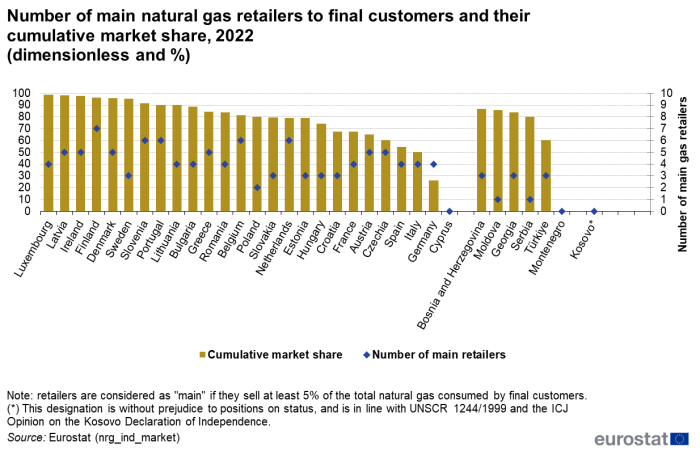
Table 5 shows the number of main retailers (retailers are considered as "main" if they sell at least 5 % of the total national natural gas consumption). The estimated figures have been slightly increasing since 2013 and reached 110 in 2022. The largest number of main retailers (seven), were operating in Finland and six retailers were operating in each of four EU Member States (Belgium, the Netherlands, Portugal and Slovenia) that report data.
Figure 2 illustrates the cumulative market shares of main natural gas retailers for the EU Member States available as well as for North Macedonia, Türkiye, Serbia, Bosnia and Herzegovina, Moldova and Georgia. Looking at the remaining retail market, which is the market that is covered by smaller retail companies that have a market coverage of less than 5 %, this market was largest in Germany (73.8 %). This market share was below 10 % in eight of the EU Member States that reported this information.
(dimensionless and %)
Source: Eurostat (nrg_ind_market)
Table 6 displays the percentage market share of the largest natural gas retailer of total national consumption. This share for 2022 was highest in Sweden (68 %) and Bulgaria was in second place with a 63 % market share of the largest natural gas retailer. The smallest market penetration for the largest retail company on national level was observed in Italy (16 %).
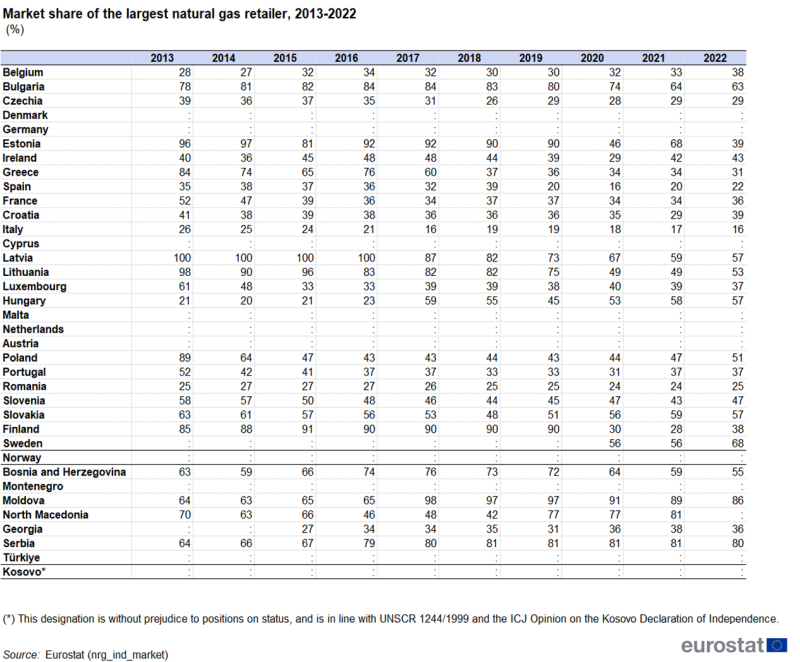
(%)
Source: Eurostat (nrg_ind_market)
Source data for tables and graphs
Data sources
The information on electricity and natural gas market indicators is collected via a voluntary data collection. Although the participation of countries in this voluntary data collection is very high, sometimes the information on individual indicators is not available or is confidential.
The full dataset is available at
Context
The EU has acted to liberalise electricity and gas markets since the second half of the 1990s. Directives adopted in 2003 established common rules for internal markets for electricity and natural gas. Up to now, significant barriers to entry remain in many electricity and natural gas markets as seen through the number of markets still dominated by (near) monopoly suppliers.
In 2019, the European Commission presented the Clean energy for all Europeans package [1]. The Commission completed a comprehensive update of its energy policy framework to facilitate the transition away from fossil fuels towards cleaner energy and to deliver on the EU's Paris Agreement commitments for reducing greenhouse gas emissions.
Directive 2009/73/EC of the European Parliament and of the Council of 13 July 2009 concerning common rules for the internal market in natural gas aims to introduce common rules for the transmission, distribution, supply and storage of natural gas with the objectives of providing market access and enabling fair and non-discriminatory competition.
Regulation (EU) 2019/942 of the European Parliament and of the Council of 5 June 2019 establishing a European Union Agency for the Cooperation of Energy Regulators. ACER, among others, assists the regulatory authorities in carrying out, at EU level, the regulatory tasks performed in the EU countries.
Direct access to
Other articles
Database
- Energy (nrg), see:
- Energy statistics - market structure indicators - natural gas and electricity (nrg_market)
- Energy market indicator (nrg_ind_market)
- Energy Statistics - quantities (nrg_quant)
- Energy Statistics - quantities, annual data (nrg_quanta)
- Supply, transformation and consumption - commodity balances (nrg_cb)
- Supply, transformation and consumption of gas (nrg_cb_gas)
- Supply, transformation and consumption - commodity balances (nrg_cb)
- Energy Statistics - quantities, monthly data (nrg_quantm)
- Energy statistics - supply, transformation, consumption (nrg_10m)
- Supply of gas - monthly data (nrg_103m)
- Energy statistics - supply, transformation, consumption (nrg_10m)
- Energy Statistics - quantities, annual data (nrg_quanta)
- Energy statistics - prices of natural gas and electricity (nrg_price)
- Energy statistics - natural gas and electricity prices (from 2007 onwards) (nrg_pc)
- Gas prices for household consumers - bi-annual data (from 2007 onwards) (nrg_pc_202)
- Gas prices for non-household consumers - bi-annual data (from 2007 onwards) (nrg_pc_203)
- Household consumption volumes of electricity by consumption bands (nrg_pc_204_v)
- Non-household consumption volumes of electricity by consumption bands (nrg_pc_205_v)
- Gas prices components for household consumers - annual data (nrg_pc_202_c)
- Gas prices components for non-household consumers - annual data (nrg_pc_203_c)
- Energy statistics - natural gas and electricity prices (from 2007 onwards) (nrg_pc)
Dedicated section
Visualisations
Methodology
- Energy Statistics - quantities, annual data (ESMS metadata file — nrg_quant_esms)
Legislation
- Directive 2009/73/EC of 13 July 2009 concerning common rules for the internal market in natural gas and repealing Directive 2003/55/EC
- Summaries of EU legislation: Internal market for gas
- Regulation (EU) 2019/942 of 5 June 2019 establishing a European Union Agency for the Cooperation of Energy Regulators
- Summaries of EU legislation: Agency for the cooperation of national energy regulators
- Regulation (EC) No 715/2009 of 13 July 2009 on conditions for access to the natural gas transmission networks and repealing Regulation (EC) No 1775/2005
- Summaries of EU legislation: Natural gas transmission networks
