Archive:Crime statistics
THIS TEXT IS IN THE PROCESS OF BEING REVISED FOR THE 2011 EDITION OF THE EUROSTAT YEARBOOK
PLEASE DO NOT MAKE ANY CHANGES UNTIL APPROVAL IS REQUESTED
- Data from September 2010, most recent data: Further Eurostat information, Main tables and Database.
Statistics that are currently available on crime and criminal justice reflect the diversity of policing and legal systems within the European Union (EU). While the development of crime and criminal justice statistics is still in its infancy, a more comparable system is in the process of being developed.
As such, comparisons of crime statistics between Member States should be based on trends over time, rather than direct comparisons of levels between countries, given that the data presented can be affected by a range of issues, including different levels of criminalisation, the efficiency of criminal justice systems, and police recording practices; it is likely that a relatively high proportion of crime remains unrecorded.
Main statistical findings
There were 1.7 million police officers in the EU-27 in 2007, which marked an overall increase of 5.7 % when compared with five years earlier (see Table 1); for comparison there were almost 700 000 police officers in the United States. Among the Member States, the highest number of police officers was found in Italy (324 339 in 2006), while there were between 215 000 and 250 000 police officers in Spain, France and Germany in 2007; these were the only other Member States to record more than 10 % of the total number of police officers in the EU-27. There were some quite rapid changes in the size of national police forces during the period from 1997 to 2007, with expansions of at least 20 % recorded for Italy (to 2006), Cyprus and Luxembourg (where the highest overall growth was registered, at 36.0 %). On the other hand, the size of the police force was reduced by more than a fifth in each of the Baltic States, and by as much as 27.8 % in Slovakia (again between 1997 and 2007).
The information on the number of police officers can be normalised, expressing the results per 100 000 inhabitants, which allows a comparison of police levels between Member States of different sizes. There was an average of 352.3 police officers for each 100 000 inhabitants in the EU-27 in 2007, with a wide range of values reported across the Member States, from a high of 660.0 police officers per 100 000 inhabitants in Cyprus to a low of 154.6 in Finland.
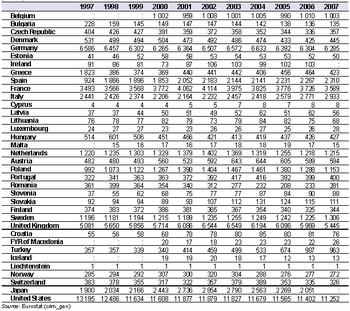
There were an estimated 29.2 million crimes recorded by the police within the EU-27 in 2007 (see Table 2), which is equivalent to a recorded crime for every 17 people. From 2000, the number of recorded crimes in the EU-27 rose to peak at 30.9 million by 2003, but subsequently fell each year through to 2007. There were relatively high levels of recorded crime in 2007 in Germany (6.3 million) and the United Kingdom (5.4 million). In recent years (from the peak in recorded crime in the EU in 2003 through to 2007), the number of recorded crimes has fallen in a majority of Member States; this was particularly the case in Poland, the United Kingdom, Malta, Lithuania and the Netherlands, where recorded crimes fell by more than 10 % during the period under consideration. Improved surveillance methods (such as closed-circuit cameras and alarm systems) may be among the reasons for the level of crime falling or being constrained. In other countries, such as Italy and Slovenia, crime appears to have risen noticeably. Changes in the level of crime statistics may reflect underlying changes in the level of crime, although they may also reflect new methods of recording crime.
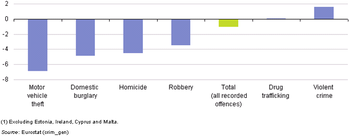
A breakdown by type of crime (see Figure 1) shows that during the period between 2000 and 2007 there was an increase in violent crime (up 3.8 % per annum) and drug trafficking offences (+1.2 % per annum) within the EU-27. In contrast, property offences, such as the theft of motor vehicles (-5.7 % per annum) and domestic burglary (-3.3 % per annum) were in decline, as was homicide (-3.6 % per annum) and robbery (-1.3 % per annum).
The EU-27 prison population rose by 1.3 % per annum during the period 1997 to 2006 to reach a total of almost 600 000, which equated to 0.12 % of the EU’s population; for comparison, the prison population of the United States was the largest in the world at 2.38 million in 2007, some 0.79 % of the total population (see Table 3). The biggest number of prisoners within the Member States was recorded in Poland (90 199 in 2007), closely followed by the United Kingdom (88 590). When expressed in relation to total population, the Baltic States and Poland had more than 200 prisoners per 100 000 inhabitants. At the other end of the range, the Nordic countries of Finland, Denmark and Sweden (as well as Iceland and Norway among non-member countries), Slovenia and Ireland (2006), each reported less than 75 prisoners per 100 000 inhabitants in 2007.
Data sources and availability
National sources of information about crime show considerable differences in approach and coverage, which means that the measurement of crime trends at EU level is still at an early stage. The figures are based largely on crime figures reported by the police.
Comparisons of crime levels based on the absolute figures would be misleading, since they are affected by many factors including:
- different legal and criminal justice systems
- rates at which crimes are reported to the police and recorded by them
- differences in the point at which crime is measured (for example, report to the police, identification of suspect, etc.)
- differences in the rules by which multiple offences are counted
- differences in the list of offences that are included in the overall crime figures.
As a general rule, comparisons should be based upon trends rather than upon levels, on the assumption that the characteristics of the recording system within a country remain fairly constant over time. Where national series without definitional changes are available, general trends have been estimated.
Total crime statistics include offences against the penal (or criminal) code. Less serious crimes (misdemeanours) are generally excluded.
Context
The need to provide information on the development of crime in the EU was recognized in the Hague Programme adopted by the European Council in 2004.
The figures currently available on crime and criminal justice reflect the differing legal systems in the Member States and therefore cannot readily be compared. However, a more comparable system of crime and criminal justice statistics is being developed, as outlined in Commission communication COM/2006/437 final, ‘Developing a comprehensive and coherent EU strategy to measure crime and criminal justice: an EU action plan 2006-2010’.
Further Eurostat information
Publications
Database
- Crimes recorded by the police (crim_gen)
- Crimes recorded by the police: homicide in cities (crim_hom_city)
- Crimes recorded by the police: historical data (total crime) 1950-2000 (crim_hist)
- Police officers (crim_plce)
- Prison population (crim_pris)
- Prison population: historical data 1987-2000 (crim_pris_hist)
Dedicated section
Other information
- The Hague Programme: strengthening freedom, security and justice in the European Union (Official Journal C 53 of 3.3.2005, p.11)
- Commission Communication COM/2006/437 final: Developing a comprehensive and coherent EU strategy to measure crime and criminal justice : an EU Action Plan 2006-2010
Source data for tables and graphs (MS Excel)
External links
- Council of Europe
- Europol - European Police Office
- European Sourcebook of Crime and Criminal Justice Statistics
- Fundamental Rights Agency
- United Nations Office on Drugs and Crime - Data and analysis
See also

