Beginners:Inflation
Highlights
This article is part of Statistics 4 beginners, a section in Statistics Explained where statistical indicators and concepts are explained in a simple way to make the world of statistics a bit easier for pupils and students as well as for everyone else with an interest in statistics.
In a market economy, prices of products are determined by supply and demand. Prices are what you have to pay for a product. Products can be either goods, such as a book or a pair of shoes, or services, such as a haircut or a taxi drive.
The price of products can change based on the amount of a product available in the market (supply) and the amount of goods or services that consumers want to buy (demand).
The price of a product depends not only on its characteristics, but also where it is sold and under which condition. Thus, identical products are often sold at different prices in different shops and at different times. For example, the price of a pair of jeans can vary not only depending on the brand or style, but also on when and where it is bought (for example during sales) or according to the quantity purchased (for example, some shops offer discounts when the customer buys several pairs).
Full article
Many different kinds of prices
Example
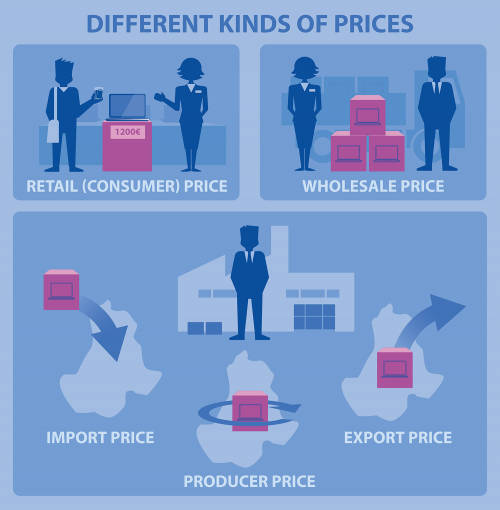
Max goes to a shop to buy a smartphone. The price that Max pays in the shop is called a retail or consumer price. 'Retail' reflecting the fact that Max has bought the phone from a retail outlet such as a shop; 'consumer' reflecting the fact that Max has bought the phone for his own personal use, and not to use it in a business.
The shop owner, Sandra, receives the payment from Max: some of the money is used to order another phone to replace in her stock the phone she has sold, some of it (the value added tax (VAT)) has to be passed on to the state, while the rest is for Sandra to use for other payments and for savings.
Sandra buys her phones from Stefan: he is a wholesaler selling phones in the country where Sandra has her shop. The price that Stefan charges Sandra is called the wholesale price.
Stefan’s phones come from two sources: some of them are manufactured in the country where he has his wholesale business and some are imported from abroad.
If the phone is produced in the country where Stefan has his business, the price that he is charged is a producer price.
However, if the phone is being imported an import price is charged.
The local manufacturer of the phone not only sells goods locally within the domestic economy, but may also export phones abroad, for which they charge an export price.
As you can see from the example above, there are many different kinds of prices, meaning that the price of a product changes as it moves through the economy — the information presented below focuses only on consumer prices.
What is inflation?
Consumer prices are of great interest because we are confronted with them every day. Prices can change over time, and can vary across countries or regions and from place to place. Even in the same place and with the same conditions, the same product can have a different price, just because it is bought in a different period of time — this is due to inflation and deflation.
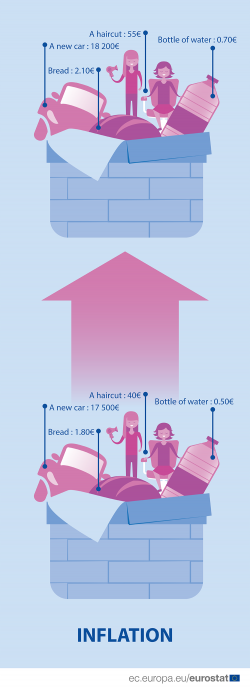
Inflation is a general increase in prices , while deflation is a decrease in prices.
When there is inflation in an economy, the value of money decreases, therefore people need to spend more money to buy the same products than previously.
On the contrary, in times of deflation the value of money increases and people often have more savings, which can have paradoxical effects on the economy. But as deflation is not very common, generally, the change in prices is often simply referred to as inflation.
How is inflation measured?
Inflation is measured by looking at the development over time of the prices people pay for goods and services. In order to do that, statisticians calculate the so-called consumer price indices (CPI). A price index compares the prices of a product over time, taking into consideration a reference period that allows a comparison of the prices from one point in time to another.
Within the European Union (EU) there are common standards for producing such indices to ensure the consistency and harmonisation at European level. The indices produced out of these processes of harmonisation form the Harmonised Index of Consumer Prices (HICP). These common standards make it possible to compare inflation rates across the EU Member States.
What is needed to calculate a consumer price index?
To calculate such an index we need:
- a classification of products (goods and services);
- a set of weights;
- a selection of representative items and their price collection.
The classification of products (goods and services)
To describe what type of products are examined for the purpose of the consumer price index in the EU, statisticians use the classification of individual consumption by purpose (COICOP). In general, every type of good and service that consumers can buy is included in this classification. Put simply it is a comprehensive list that includes every type of goods and services, divided into 12 divisions/categories - coded from 01 to 12 (see Box 1).
Box 1: Codes and labels for COICOP divisions
01 Food and non-alcoholic beverages
02 Alcoholic beverages, tobacco and narcotics
03 Clothing and footwear
04 Housing, water, electricity, gas and other fuels
05 Furnishings, household equipment and routine household maintenance
06 Health
07 Transport
08 Communications
09 Recreation and culture
10 Education
11 Restaurants and hotels
12 Miscellaneous goods and services
The set of weights Each good or service has different significance in terms of money spent by consumers, who are considered as a household. In order to have an overview of the total price change measured for goods and services and to obtain an aggregate number of the price change, each change must be given an importance relative to the entire household expenditure. Price changes are weighted according to the relative expenditure on these goods and services.
As consumers are different from one another, they spend their money in different ways, according to their income and habits. Some households will spend more on food, while others will spend more on clothing, heating, or vehicles. If these differences for every household in a country are added together we can see the relative importance — the weight (see Box 2) — of each product category in that country. Of course, consumption patterns differ from country to country, therefore the set of country weights will also be different.
Examples
While Markus in Germany likes to buy vegetables and cheese from the supermarket as part of his grocery shopping, Giulia in Italy prefers to purchase fruit, meat and pasta.
While Annika in Sweden spends a high share of her money on heating her flat, Miguel in Spain spends a greater share of his money on electricity for air conditioning and water for the vegetables he grows in his garden.
Tastes, products and prices change over time. For this reason weights are regularly updated.
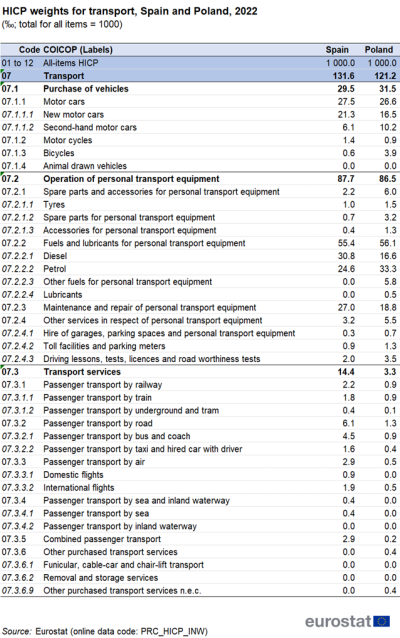
Box 2: Detailed weights for transport — COICOP Division 07
Table 1 shows the categories within the transport division of COICOP for Spain and Poland. Rather than showing the value of consumption expenditure in euro or złoty, this table shows the relative importance (weight) of each of these transport headings within total household consumption expenditure. The weights are shown as a value which, when all of the weights for Divisions 01 to 12 have been put together, equals 1 000. In other words, these weights are calculated per mille, which is like percentages except that the total adds up to 1 000 rather than 100. For expenditure on transport as a whole, the weight in Spain in 2022 was 131.6 ‰; in Poland the weight was 121.2‰.
Selection of representative items and their price collection
As statistical offices cannot afford to regularly monitor the price of every single product, they select items for each category which are considered representative of the households’ expenditure, and their price is monitored over time.
To obtain reliable data over different periods of time, these individual items need to be precisely defined. It is not enough to simply measure the price, for example, of a carton of juice: you also need detailed information about the size of the carton, the manufacturer, the particular type of juice (ingredients and composition). In order to have complete information, you also need to know where the juice is bought.
Example
If Markus buys a chocolate bar from a late-night store, he might expect to pay more than the price he would pay for a bar from the family-size pack of chocolate bars from a discount supermarket. This is why it is important to take also into account the choice of the outlet when measuring the price, and not just the choice of items.
The items have to be selected carefully in order to be genuinely representative of what people buy and under what conditions. Therefore, the selection of items and the related specifications are reviewed frequently. This task itself is complex.
Collectively, the selected items whose prices are surveyed each month represent the reference basket of goods and services. This is considered to be the “shopping basket”, filled with the same products every month, where the prices of the items are added up.
To ensure its relevance, the “shopping basket” of items is reviewed each year. Some items are taken out of the basket and others are put in, to ensure it is up to date and representative of consumer spending patterns. Furthermore, calculating the index is more complicated than scanning items at a checkout counter and looking at the total price. Why?
Every month national statistical offices, record prices for the selected representative items in the “shopping basket”, ensuring that prices are collected from the different regions and outlets in each country. These prices are collected through price surveys, often by visiting shops and service providers and noting the price. In some cases, prices may be collected directly by telephone or from tariffs from websites, for example for the price of an air fare.
Example
In Ireland, an average of 12 000 prices are collected each month for the harmonised index of consumer prices (HICP), while in Austria, an average of 40 000 prices are collected. Information on the price survey practices for each EU Member State as well as a few non-member countries is available in a set of national reports on the Eurostat website.
Calculation of price indices
Price indices are used to compare the prices of a set of products over a period of time. They give information about how much would have been paid for the same product in a different moment in time. A given point in time is chosen as the reference for the comparison, and it becomes the basis to calculate the index, where the price would represent the reference unit (100%).
Once the prices for each item in the 'basket of goods/services' have been collected, the index is calculated following three stages:
Stage 1: The latest prices observed are compared with previous prices, in order to see how they have changed. To appreciate the change and after comparing the different prices, an index is created, using a ‘reference period’ as a basis. For example if, in a particular month the price of a specific item is 10 % higher than the price in the reference period, the indexed value will be 110, while if the price is 5 % lower the index is 95.
Stage 2: After the index is created, an average of the indices used for the same category of products (according to their classification) needs to be calculated. For example, all indices related to fruit will be combined together to produce a price index for fruit.
Stage 3: Finally, the indices for the different product groups are weighted (see see Table 1). The weights describe how much is spent for each type of product in relation to the total expenditure. For example, in Spain petrol represents 21 ‰ of consumer expenditure (see explanation of ‰ in Box 2) thus the index for petrol will add 21 ‰ to the overall index in Spain.
By summing up the different weights, an overall index is arrived at, commonly referred to as the all-items index, which includes Divisions 01 to 12 of COICOP.
However, the price index is not as common as the inflation rate to analyse inflation.
Different kinds of inflation rates
The inflation rate is obtained, by comparing indices from one period to another which gives information about how much prices have changed, (in percentage), since the reference period.
Statisticians can choose different reference periods to calculate inflation leading to different kinds of inflation rates:
- The monthly rate of change, which shows the rate of change between a month and the previous month.
- The annual rate of change, which shows the rate of change between a month and the same month of the previous year.
- The annual average rate of change, which shows the rate of change between one year and another. This rate can be calculated when a year has come to an end and shows an average index for the year.
- The 12-month average rate of change, which is an average of the monthly rate of change for each of the previous 12 months.
Box 3: Examples of the different types of rate of change for the EU
The monthly rate of change for the all-items index of consumer prices between January 2023 and February 2023 was 0.8 %.
The annual rate of change between February 2022 and February 2023 was 9.9 %.
The annual average rate of change between 2021 and 2022 was 9.2 %.
The 12-month average rate of change for all months from January 2022 to February 2023 was 9.9 %.
The overall inflation rate shows the change in prices for all items. In other words, the rate involving the price of goods and services across the economy. However, many data users do not want to analyse just the “all-items index”, but prefer to look in more detail at price changes for different types of goods and services.
Apart from publishing indices (and rates of change) for the various goods and services covered by COICOP, Eurostat produces a range of special aggregates that reflect particular needs. For example, there are separate aggregates for energy and for all other products, which allow analysts to study the overall trend of inflation independently from the frequent fluctuations in energy prices.
What are the challenges in measuring price changes?
Producing a consumer price index is not such an easy task. There are so many challenges when building a price index in order to measure inflation!
Let’s just consider the items selected for the representative basket of goods and services which are always subject to change over time. For example, ingredients used to produce a packet of biscuits might change, such as increasing or reducing the amount of sugar or, the size of the packet could be modified so it contains less or more biscuits than before, etc. When collected, prices are adjusted to take into account such quality changes.
Example
If the price of a packet of biscuits stays at EUR 1.20 but its size is reduced from 300g to 250g, this is treated as a change in quality: the price index should show an increase as there are fewer biscuits in the packet but the amount paid for the packet is the same. For some products a change into a smaller size may reflect an increase in quality, for example, as is the case for a laptop that becomes thinner and/or lighter.
In our example above, for the packet of biscuits it is quite easy to work out how much the quality has changed, but this is not always as simple.
For example, when considering a car manufacturer who produces a particular model of a car and after a year the engine power is upgraded from 105 to 110 horsepower. While it is clear that there has been a change in the quality of the particular car model, it is not so clear how much change this represents within the retail price for the whole car. Price statisticians have to deal with issues like these for complex products on a regular basis.
Another difficulty concerns new products in the consumer markets, which have to be compared with outdated products which are no longer in production. Continuing with the example of a car manufacturer, what would happen if a particular model that had been selected for the price survey was no longer produced? An alternative model would need to be found and included in the price survey, either from the same manufacturer or from a different one. Sometimes products are completely new, for example home video cassettes in the 1970s, cellular mobile phones in the 1980s, or modern electric and hybrid cars in the last 10 years. In some cases it might be possible to include them immediately into the basket of goods and services for price collection, but in other cases it might be necessary to wait some time, until a major revision of the index is calculated, for example once a year or once every five years.
Direct access to
- All Statistics Explained articles on consumer prices
- Consumer prices — inflation
- Inflation in the euro area
Other kinds of prices:
- Performance of the agricultural sector
- Industrial producer prices
- Construction producer prices
- Services producer prices
Glossary items in Statistics Explained:


