Key figures for European Neighbourhood South countries
Data extracted in March 2024. Planned article update: March 2025.
Highlights
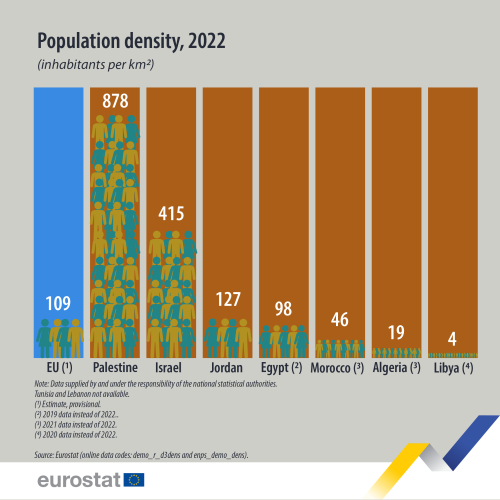
Among the European Neighbourhood Policy-South countries for which data is available, Palestine had the highest population density in 2022, at 878 inhabitants per square kilometres, whereas Libya’s was the lowest, at 4 inhabitants per square kilometres (2020 data); the EU figure was at 109 in 2022.
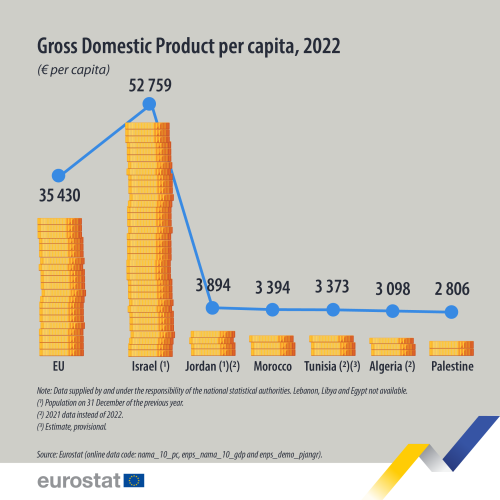
In the European Neighbourhood Policy-South region, GDP per capita was the highest in Israel in 2022 (€52 759) and the lowest in Palestine (€2 806); in the EU it was €35 430.
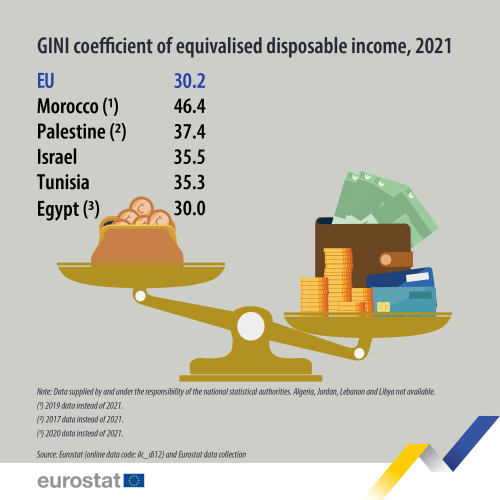
Considering the data availability, Egypt had the lowest GINI coefficient of equivalised disposable income among the European Neighbourhood Policy-South countries in 2021, with 30.0, while Morocco had the highest at 46.4. In comparison, EU was at 30.2.
This article is part of an online publication. It provides data on economic statistics for nine of the ten countries that form the European Neighbourhood Policy-South (ENP-South) region — Algeria, Egypt, Israel, Jordan, Lebanon, Libya, Morocco, Palestine [1] and Tunisia; cooperation with Syria is currently suspended. Data for Lebanon do not include Palestinian refugee camps.
This article presents statistics on population density, gross domestic product (GDP), measured in EUR per capita; inequality of disposable income measured by Gini coefficient, gross inland energy consumption expressed in kilogramme of oil equivalent (kgoe) per capita and unemployment gender gap as the difference in percentage points (pp) between the number of unemployed men and unemployed women. The indicators presented have been selected based on the importance of the policy areas, the relevance of the information for those policy areas, and the availability of data.
Full article
Population density
The most recent data available on population density, measuring the number of inhabitants per square kilometre (km2), is illustrated in Figure 1 for the ENP-South countries and compared with the EU.
In 2022, Palestine had by far the highest population density among the ENP-South countries for which data is available, at 878 inhabitants per km2, more than eight times the provisionally estimated population density of the EU at 109 inhabitants per km2. Israel followed, with 415 inhabitants per km2, less than half the density of Palestine but substantially higher than the rest of the ENP-South countries and the EU. Jordan’s number of inhabitants per km2 was closer to the EU level, with a population density of 127 inhabitants per km2 in 2022. With Palestine and Israel, Jordan was the only country above the population density of the EU. Egypt was not far from the EU level, at 98 inhabitants per km2 (2020 data). Morocco and Algeria had much lower population densities, at 46 inhabitants per km2 (2019 data) and 19 inhabitants per km2 (2021 data) respectively.
Libya had the smallest population density, with only 4 inhabitants per km2. This represents 4 % of the population density of the EU, and less than 0.5 % of the Palestinian population density, highlighting the great disparity of density levels among ENP-South countries. Data for Tunisia and Lebanon are not available.
(inhabitants per km2)
Source: Eurostat (demo_r_d3dens) and (enps_demo_dens)
Gross domestic product (GDP) per capita
Analysis of GDP per capita removes the influence of the population size, making comparisons between different countries easier and more relevant. As a result, GDP per capita is a broad economic indicator that may be used for a basic analysis of living standards.
As shown in Figure 2, the highest GDP per capita among the ENP-South countries for which recent data is available was recorded in Israel, at €52 759 in 2022. This represented almost 150 % of the EU value which was €35 430 per capita. In several countries, the GDP per capita was relatively equal: in Jordan it was €3 894 (2021 data), €3 394 in Morocco (2022 data), €3 373 in Tunisia (2021 data), €3 098 in Algeria (2021 data), and €2 806 in Palestine (2022 data), representing 5 % to 7 % of Israel's GDP per capita, and 8 % to 11 % of EU’s GDP per capita. Data for Egypt, Lebanon, and Libya are not available.
(€ per capita)
Source: Eurostat (nama_10_pc), (enps_nama_10_gdp) and (enps_demo_pjangr)
GINI coefficient
The Gini coefficient, presented in Figure 3, is a measure of income inequality within a population, commonly used to assess disparities in wealth distribution. It quantifies the extent to which the distribution of income deviates from perfect equality, with higher values indicating greater inequality.
In Morocco, the GINI coefficient was the highest from the region, at 46.4 in 2019 (data unavailable from 2019 onward), suggesting substantially higher inequality in wealth distribution in the country than in the other ENP-South countries. The GINI coefficient is not available for Palestine beyond 2017, limiting insights into recent trends in income inequality. However, the GINI coefficient was at 37.4 in 2017, significantly lower than Morocco’s GINI coefficient. In 2021, Israel had a GINI coefficient of 35.5, only 0.2 points higher than the value for Tunisia (35.3), highlighting a similar level of income inequality within the two countries.
With the lowest value among the ENP-South countries for which data is available, Egypt had a GINI coefficient of 30.0 in 2020 (the most recent year for which data is available), suggesting a more equal distribution of wealth within the population compared to the other ENP-South countries. Data for Algeria, Jordan, Lebanon and Libya are not available.
The income inequality measured by the GINI coefficient was relatively low in the EU, at 30.2 in 2021.
Source: Eurostat (ilc_di12) and Eurostat data collection.
Gross inland energy consumption
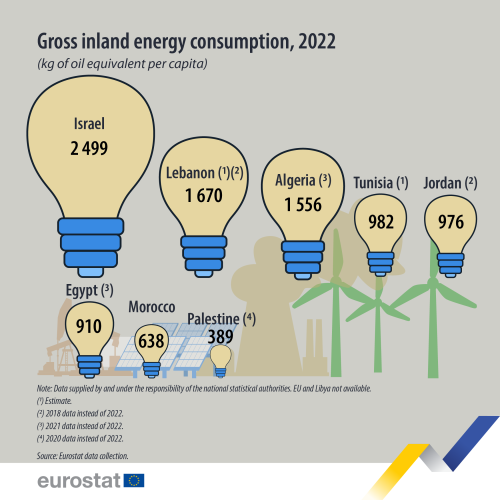
Figure 4 presents the gross inland energy consumption in kilogrammes of oil equivalent (kgoe) per capita, measuring the energy a country requires to meet its internal (national) demand. It covers the consumption by the energy sector itself; distribution and transformation losses; final energy consumption by end users; non-energy use by end users (such as feedstock for the petrochemical industry, lubricants); and statistical differences. It represents the total energy demand of a country or region from all sources necessary to satisfy inland consumption and present it per capita, removing the effect of the population size.
Gross inland energy consumption per capita in Israel was the highest among the ENP-South countries, with 2 499 kilogrammes of oil equivalent per capita (kgoe/capita) in 2022. Lebanon and Algeria’s energy consumption were substantially lower, around two-thirds of Israel’s level, Lebanon being estimated at 1 670 kgoe/capita in 2018 (data unavailable beyond 2018) while Algeria reached 1 556 kgoe/capita in 2021 (2022 data are not available). Tunisia, Jordan, and Egypt had similar levels of gross inland energy consumption, much lower than the top 3 ENP-South countries. Tunisia’s gross inland energy consumption was estimated at 982 kgoe/capita, Jordan with 976 kgoe/capita in 2018 (data unavailable 2018 onward), and Egypt with 910 kgoe/capita in 2021 (2022 data is unavailable). Morocco’s gross inland energy consumption in 2022 stood at 638 kgoe/capita, while Palestine was at 390 kgoe/capita in 2020 (no data available for 2021 and 2022). Data for EU and Libya is not available for a comparison.
Overall, the data presented reflect the great disparity in energy consumption of ENP-South economies, and could be influenced by many factors, including technological advancements, industrial base, energy policy and energy efficiency.
Unemployment gender gap
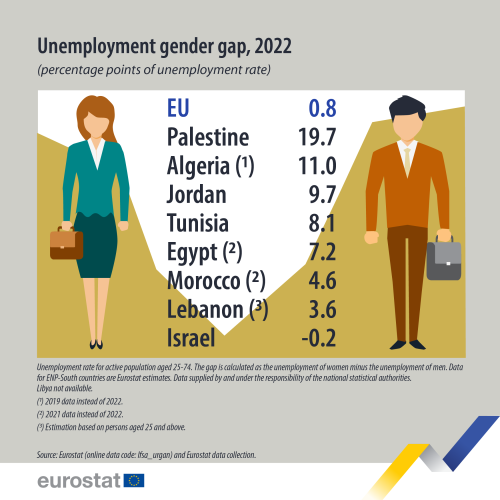
Figure 5 presents the gender gap in unemployment of the population aged 25-74, measured in percentage points (pp). A higher unemployment rate for a gender, potentially means a higher difficulty to find work for that gender due to national socio-economic context or stereotypes. Positive values indicate a higher unemployment rate for women than for men. Negative values indicate the opposite i.e., a lower unemployment rate for women than for men. The gender gaps in unemployment for all ENP-South countries are estimated by Eurostat.
In 2022, the unemployment gender gap for Palestine was 19.7 pp, meaning that in Palestine, women had an unemployment rate of almost twenty pp higher than the men, highlighting a significant inequality regarding access to employment by gender. In 2019 (no data available beyond 2019), Algeria’s gender gap was also relatively high, with women’s unemployment rate 11.0 pp higher than men’s unemployment rate. Algeria was closely followed by Jordan with a gender gap of 9.7 pp in 2022, Tunisia with 8.1 pp, and Egypt with 7.2 pp in 2021 (2022 data is unavailable). Morocco and Lebanon had a relatively similar gap in unemployment rate by gender, at 4.6 pp (2021 data) and 3.6 pp respectively; Lebanon data was estimated based on persons aged 25 and above. The only country with a negative gender gap, suggesting a higher unemployment rate for men than for women was Israel. In 2022, Israel’s unemployment rate for women was lower than the unemployment for men by 0.2 percentage points, the lowest gender gap value of the country group, highlighting the equality regarding unemployment. Data for Libya is not available.
In the EU, the unemployment gender gap was 0.8 pp, reflecting a slightly higher unemployment for women than for men in 2022.
(% of total)
Source: Eurostat (lfsa_urgan) and Eurostat data collection.
Source data for tables and graphs
Data sources
The data for ENP-South countries are supplied by and under the responsibility of the national statistical authorities of each country on a voluntary basis. The data that are presented in this article result from an annual data collection cycle that has been established by Eurostat. Cooperation with Syria is currently suspended. These statistics are available free-of-charge on Eurostat’s website, together with a range of different indicators covering most socio-economic areas.
Eurostat provides a wide range of demographic data, including statistics on populations at national and regional level, as well as for various demographic events influencing the size, the structure and the specific characteristics of these populations. Eurostat collects data from EU countries and other countries participating in its demography data collection exercise, including the ENP-South countries. The recommended definition is the 'usual resident population' and represents the number of inhabitants on 1 January of the year in question (or, in some cases, on 31 December of the previous year).
The European system of national and regional accounts (ESA 2010) provides the methodology for national accounts in the EU. ESA 2010 is consistent with the worldwide guidelines for national accounts, the System for National Accounts (2008 SNA). The national accounts data presented in this article for ENP-South countries were either collected under 2008 SNA or ESA 2010.
The European system of integrated social protection statistics (ESSPROS) is a common framework developed within the European statistical system (ESS) that has been designed to provide a coherent comparison across European countries (the 27 EU Member States plus Iceland, Norway, Switzerland, Serbia and Turkey) of social benefits to households and their financing, in terms of precisely defined risks or needs that refer to the ESSPROS functions: disability, sickness/health care, old-age, survivors, family/children, unemployment, housing and social exclusion. The legal basis for the data collection exercise is provided by Regulation (EC) No 458/2007 of the European Parliament and of the Council on the European system of integrated social protection statistics (ESSPROS). ESSPROS is composed of a core system that contains annual data from 1990 onwards on (gross) expenditures and receipts. In addition to the core system, one module on pension beneficiaries and one on net social benefits data are available.
For EU statistics, the main legislation covering the collection of statistics in relation to energy quantities is Regulation (EC) No 1099/2008 of the European Parliament and of the Council of 22 October 2008 on energy statistics. Since its adoption, it has been amended several times and a consolidated version is available. A summary of the relevant legislation is also available on Eurostat's website, under 'Legislation' on the dedicated section for Energy statistics.
Context
Indicators derived from national accounts provide a picture of the economic situation; they are widely used for analysis and forecasting, and provide the framework for government policy decisions.
The use of internationally accepted concepts and definitions permits an analysis of different economies, such as the interdependencies between the economies of the EU Member States, or a comparison between the EU and non-member countries.
The European Neighbourhood Policy (ENP), launched in 2003 and developed throughout 2004, supports and fosters stability, security and prosperity in the EU’s neighbourhood. The ENP was revised in 2015. The main principles of the revised policy are a tailored approach to partner countries; flexibility; joint ownership; greater involvement of EU member states and shared responsibility. The ENP aims to deepen engagement with civil society and social partners. It offers partner countries greater access to the EU's market and regulatory framework, standards and internal agencies and programmes.
The Joint Communication on Renewed Partnership with the Southern Neighbourhood – A new Agenda for the Mediterranean, accompanied by an Economic and Investment Plan for the Southern neighbours, of 9 February 2021 further guides cooperation with the ENP-South countries. Additional information on the policy context of the ENP is provided on the website of Directorate-General European Neighbourhood Policy and Enlargement Negotiations (DG NEAR).
In cooperation with its ENP partners, Eurostat has the responsibility to promote and implement the use of European and internationally recognised standards and methodology for the production of statistics, necessary for designing and monitoring policies in various areas. Eurostat manages and coordinates EU efforts to increase the capacity of the ENP countries to develop, produce and disseminate good quality data according to European and international standards.
Reliable and comparable data are essential for evidence-based decision-making. They are needed to monitor the implementation of the agreements between the EU and the ENP-South countries, the impact of policy interventions and the reaching of the Sustainable Development Goals (SDGs).
The main objective of Euro-Mediterranean cooperation in statistics is to enable the production and dissemination of reliable and comparable data, in line with European and international norms and standards.
The EU has been supporting statistical capacity building in the region for a number of years through bilateral and regional capacity-building activities. This takes the form of technical assistance to partner countries’ national statistical authorities through targeted assistance programmes, such as the MEDSTAT programme and activities such as training courses, working groups and workshops, exchange of best practice and the transfer of statistical know-how.
Direct access to
- All articles on non-EU countries
- European Neighbourhood Policy countries — statistical overview — online publication
- Statistical cooperation — online publication
Books
Factsheets
- Statistics for a green future — factsheets on European Neighbourhood policy-South Countries — 2022 edition
- Basic figures on the European Neighbourhood Policy-South countries — 2022 edition
- Basic figures on the European Neighbourhood Policy-South countries — 2021 edition
Leaflets
- Basic figures on the European Neighbourhood Policy — South countries — 2020 edition
- Basic figures on the European Neighbourhood Policy — South countries — 2019 edition
- Basic figures on the European Neighbourhood Policy — South countries — 2018 edition
- Basic figures on the European Neighbourhood Policy — South countries — 2016 edition
- Basic figures on the European Neighbourhood Policy — South countries — 2015 edition
- International trade in goods for the European neighbourhood policy-South countries — 2018 edition
- Southern European Neighbourhood Policy countries (ENP-South) (ESMS metadata file — enps_esms)
- European External Action Service — European Neighbourhood Policy
- European External Action Service — European Neighbourhood Policy
- Joint Communication JOIN(2020) 7 final: Southern Partnership policy beyond 2020: Reinforcing Resilience - an Southern Partnership that delivers for all (18 March 2020)
- Joint Staff Working Document SWD(2021) 186 final: Recovery, resilience and reform: post 2020 Southern Partnership priorities (2 July 2021)
- Joint Declaration of the Southern Partnership Summit: ‘Recovery, Resilience and Reform’ (15 December 2021)
- Directorate-General for Economic and Financial Affairs — Stability and Growth Pact
- European Commission — European semester
Notes
- ↑ This designation shall not be construed as recognition of a State of Palestine and is without prejudice to the individual positions of the Member States on this issue.
