Archive:Statistics on European cities
- Data extracted in March 2017. Most recent data: Further Eurostat information, Main tables and Database. Planned article update: September 2018.
Maps can be explored interactively using Eurostat’s Statistical Atlas (see user manual).
(millions)
Source: Eurostat (urb_cpop1) and (urb_lpop1)
Source: Eurostat (urb_cpopstr), (urbcpop1), (demo_pjan) and (demo_pjanind)
(%)
Source: Eurostat (edat_lfse_30), (edat_lfs_9913) and (lfst_r_ergau)
Source: Eurostat (urb_percep), (urbcpop1) and (demo_pjan)
(%)
Source: Eurostat (urb_percep)
Source: Eurostat (urb_cenv), (urbcpop1) and (demo_pjan)
Source: Eurostat (urb_cenv), (urbcpop1) and (demo_pjan)
(%)
Source: Eurostat (urb_percep)
Source: Eurostat (urb_cenv), (urbcpop1), (env_wasmun) and (demo_pjan)
This article forms part of Eurostat’s annual flagship publication, the Eurostat regional yearbook. Cities are often seen as centres of economic growth, providing opportunities for study, innovation and employment. An increasing share of the European Union (EU’s) population lives and works in cities and it is widely expected that it is likely that these patterns will continue as urban areas account for a greater share of activity. Although population numbers are falling in some cities which may be characterised as former industrial heartlands, most (when measured with their surrounding suburbs) are expanding at a rapid pace and such growth is accompanied by a range of complex challenges: for example, issues relating to social cohesion, an ample supply of housing, or the provision of efficient transport services, each of which may impact on the quality of life. This article analyses the sustainability of cities in the EU: it focuses on three principal areas — demographic and socioeconomic developments; the use of different means of transport for going to work; and the environment — as measured by air quality and municipal waste.
The manner in which cities across the EU are governed and their autonomy varies considerably between EU Member States, according to a combination of administrative layers, at a national, regional, metropolitan/urban, city or borough level.
Main statistical findings
Cities — in particular capitals — are motors for economic growth, often characterised by their high concentrations of economic activity, employment and wealth. Yet, there is often a paradox insofar as cities also display some of the highest levels of social exclusion, unemployment and income disparity, and cities are also confronted by issues such as crime, traffic congestion or pollution. Furthermore, within individual cities it is possible to find people who enjoy a very comfortable lifestyle living in close proximity to others who may face considerable challenges — herein lies the ‘urban paradox’.
- In 2015, six of the 20 largest functional urban areas (cities plus their surrounding commuting zone) were in Germany, three each in Italy and the United Kingdom, and two in Spain. Budapest (Hungary) and Warszawa (Poland) were the only cities from eastern EU Member States that figured in the list and there were none from the northern Member States.
- The largest populations in functional urban areas in the EU were recorded in London (the United Kingdom) and Paris (France), followed — at some distance — by Madrid (Spain), the Ruhrgebiet, Berlin (both Germany), Barcelona (Spain), Roma and Milano (both Italy).
- Athina (Greece) was the only one of the larger capital cities (with a population above 2.0 million) to report a fall in its population between 2004 and 2014. The slowest annual average growth among these larger cities during this period was recorded in Berlin and Madrid; the fastest growth was recorded in London.
- In 2014, the majority of the cities with an old-age dependency rate of 40 % or more were located in Italy, while most of the others were located in Germany, France or the United Kingdom.
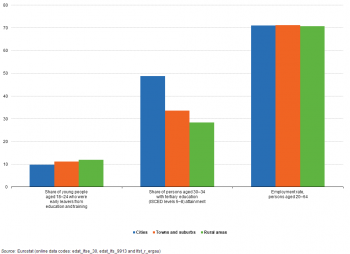
- When compared with rural areas and with towns and suburbs, fewer young people in EU cities were early leavers from education and training. Equally, nearly half of all persons aged 30–34 living in EU cities had a tertiary level of education, again higher than the shares recorded for those living in rural areas of towns and suburbs.
Population
This section focuses on population statistics for cities. With a high share of the population living in urban areas, there are many issues which may impact upon on the sustainability of cities in the EU. Population statistics for cities refer to the population at its usual residence, in other words, the place where a person normally lives, regardless of temporary absences; this is generally their place of legal or registered residence. Population numbers are a reference for measuring the general size of an urban entity and are used as a denominator for many derived indicators.
Largest cities by population
Across the EU there is a diverse mix of cities: at one end of the scale are the global metropolises of London and Paris, while approximately half of the cities in the EU had a relatively small urban centre of between 50 and 100 thousand inhabitants. Many of the EU’s largest cities (especially capital cities) attract both internal and external migrants and their population numbers therefore tend to increase at a faster pace than national averages. This often implies a process of urban sprawl, as previously rural areas in the neighbourhood of expanding urban areas are developed to accommodate the growing population.
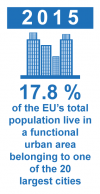
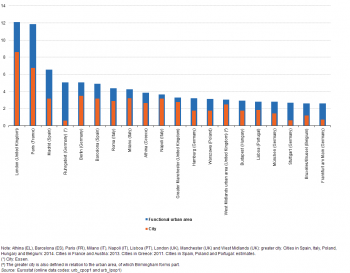
The 20 largest functional urban areas in the EU are presented in Figure 1: the information presented relates to the numbers of inhabitants living in each city plus its commuting zone, while also showing the size of the city itself; the list is split equally between capital cities and non-capital cities. In 2015, six of the top 20 cities were in Germany, three each were in Italy and the United Kingdom, and two were in Spain. Budapest in Hungary and Warszawa in Poland were the only cities from eastern EU Member States that figured in the list and there were none from the northern Member States.
The largest populations in functional urban areas in the EU were recorded in London and Paris (both around 12 million inhabitants; data for Paris relate to 2013), followed — at some distance — by Madrid (6.5 million). The next largest concentration was the urban agglomeration of the Ruhrgebiet (which includes, among others, Bochum, Dortmund, Duisburg, Essen and Oberhausen) with 5.1 million inhabitants, while the functional urban area of the German capital of Berlin also had a population of 5.1 million persons. There were three functional urban areas with between 4.0 and 5.0 million inhabitants, all of which were located in the southern EU Member States, namely, Barcelona, Roma and Milano.
The distribution of cities across the Nordic Member States, France and the interior areas of Portugal and Spain was relatively sparse
One of the most striking aspects of the distribution of cities across parts of the EU is the close proximity of cities to each other: this can be seen over much of Belgium, the Netherlands, western parts of Germany, northern Italy and the southern half of the United Kingdom. By contrast, the Nordic Member States, France and the interior of Spain and Portugal are characterised by a more sparse distribution of cities over a greater area.
These differences in spatial distribution may reflect levels of centralisation. On one hand, there are EU Member States like France which appear to have a relatively monocentric structure based on Paris. This may be contrasted with the polycentric structure of cities that is observed in Germany, where there is no single dominant city.
Capital cities
Almost 8.5 million inhabitants in London in 2014 …
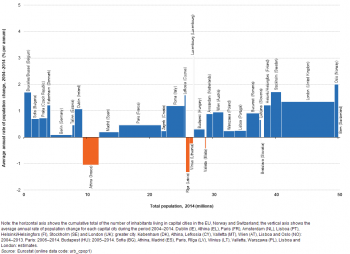
Figure 2 presents the resident population as of 1 January 2014 of the 28 capital cities in the EU as well as in Norway and Switzerland: the width of each bar reflects the number of inhabitants of each city while the height reflects the annual average rate of change between 2004 and 2014. On the basis of the data presented, the most populous capital cities in the EU in 2014 were London (8.5 million inhabitants) and Paris (6.8 million inhabitants); note that these data refer to the concept of the greater city, in other words they are not limited to the administrative city limits, although they do not extend to cover surrounding functional urban areas.
The next largest capital cities in the EU were Berlin (3.4 million) and Madrid (3.2 million), followed by Roma, Athina (2013 data) and Bucuresti (Romania) as the only other capital cities with more than 2.0 million inhabitants. At the other end of the range, the smallest capital city in the EU was Luxembourg, which had 107 thousand inhabitants, slightly less than the population of Bern in Switzerland (129 thousand).
… while the fastest growth in the previous 10 years was in Luxembourg
Despite being the smallest of these capital cities, Luxembourg was the fastest growing between 2004 and 2014, with its population increasing by 3.1 % per year on average. In broad terms, Norway and the Nordic Member States reported relatively high average population growth in their capital cities during this period, at least 1.2 % per year. By contrast, the other northern Member States — namely, the three Baltic Member States — reported a falling population (-1.3 % per year in Rīga (Latvia) and -0.2 % in Vilnius (Lithuania)) or modest growth (0.5 % in Tallinn (Estonia)). The capital cities in eastern Member States generally recorded average population growth below 1.0 % per year, although the population fell by 0.2 % per annum on average in Bratislava (Slovakia). Among the western and southern Member States, the situation was more mixed: rapid population growth in Luxembourg contrasted with annual average growth of just 0.1 % per year in Berlin (as well as in Bern); annual average growth of 1.6 % in Lefkosia (Cyprus) contrasted with a falling population in Athina (-1.1 % per year) and in Valletta (Malta; -0.4 %).
Athina was the only one of the larger capital cities (with a population above 2.0 million) to report a fall in population between 2004 and 2014; note that the population of the Greek capital rose in successive years through to 2009, after which the population declined at a more rapid rate (likely reflecting the impact of the global financial and economic crisis and subsequent sovereign debt crisis). The slowest annual average growth rates among these larger cities during the period between 2004 and 2014 were recorded in Berlin (0.1 %) and Madrid (0.2 %); the fastest growth was recorded in London, where the population grew by an average of 1.4 % per year, closely followed by Roma, where growth was 1.2 % per year.
Old-age dependency in cities
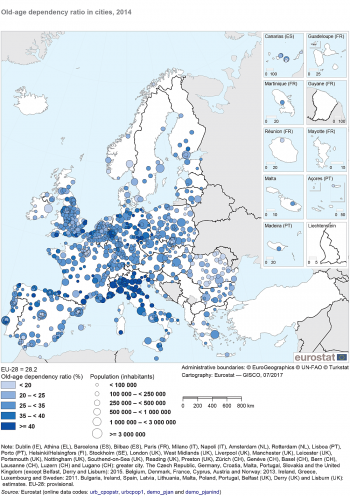
Map 1 provides information on the age structure of more than 850 cities in the EU, Norway and Switzerland. The size of the circle shows how large the city is in terms of its overall number of inhabitants, while the shading reflects the old-age dependency ratio, in other words the ratio between the number of people aged 65 years and over and the number of people aged 20 to 64 years (a measure of the working age population). Across the EU-28 as a whole, the old-age dependency ratio was 28.2 % in 2014.
The existence of greater opportunities for higher education and employment offered by most large cities might lead to the assumption that they have a higher share of younger and middle-aged adults and so a lower old-age dependency ratio. Equally, it is conceivable that older persons (aged 65 and over) might be tempted to move away from capital and other major cities for their retirement, in order to avoid some of the perceived disadvantages often associated with living in big cities, such as congestion, crime and a higher cost of living; in many countries coastal destinations attract older people. However, some cities in the EU have a relatively high proportion of older people because of an outflow of younger people, reflecting limited educational and or employment opportunities.
A majority of cities across the EU with an old-age dependency ratio of at least 40 % were in Italy
In 2014, the majority (41 from 77) of the cities with an old-age dependency rate of 40 % or more (as shown by the darkest shade in Map 1) were located in Italy. Many of the other cities were in Germany (15), France (10) or the United Kingdom (six), with three in Spain and one each in Belgium and Portugal.
Aside from in Germany (where the majority of these cities were in eastern Germany), those with relatively high old-age dependency ratios were often located close to a coastline — including popular retirement destinations — with particularly high concentrations on the Italian Adriatic coast and the Mediterranean coast from southern France into northern Italy.
In 2014, there were only five cities in the EU where the old-age dependency ratio exceeded 50 %. Three of these were located on the Mediterranean coast: the highest old-age dependency ratio was recorded in the French resort of Fréjus (60.3 %; data are for 2013); the other Mediterranean coastal cities were the Italian towns of Savona (51.8 %) and Sanremo (51.7 %), just over the border. The two other cities with an old-age dependency ratio above 50 % were in eastern Germany: Dessau-Roßlau (51.7 %, 2015 data) is between Leipzig and Berlin, while Görlitz (50.4 %, 2015 data) is on the border between Germany and Poland, slightly north of their borders with the Czech Republic.
However, the French and Italian Riviera was not the only coastal area that seemingly attracted retirees, as relatively high old-age dependency ratios (of at least 45 %) were recorded elsewhere on or near the coasts of Italy (Venezia and Trieste on the Adriatic coast), the United Kingdom (Waveney in Suffolk on the North Sea coast and Torbay on the coast of the English Channel), Belgium (Oostende on the North Sea coast) and Germany (Wilhelmshaven also on the North Sea coast).
Among some of the larger cities in the EU — those with a population of at least 500 thousand inhabitants —old-age dependency ratios of at least 40 % were recorded in the Italian cities of Genova and Torino in the north-west of Italy, as well as for Nice in the south-east of France (data are for 2013).
Relatively few old persons living in satellite cities around the Spanish and French capitals
In 2014, there were four cities across the whole of the EU with at least 500 thousand inhabitants and an old-age dependency ratio that was less than 20 % (as shown by the lightest shade in Map 1). Each of these was a capital city, namely København (Denmark), Amsterdam (the Netherlands), Dublin (Ireland) and London; this was also the case in Oslo, the Norwegian capital city. It should be noted that not all capital cities had a low old-age dependency ratio, as the latest available ratios reached 39.0 % in Lisboa (Portugal), 35.6 % in Roma and between 30.0 % and 35.0 % in Valletta, Madrid, Rīga, Bern, Budapest and Berlin.
In 2014, the lowest old-age dependency ratio in a city in the EU was 11.3 % in the southern Romanian city of Slatina, while two suburban areas close to Madrid — Fuenlabrada and Parla — had the second and third lowest ratios (11.7 % and 12.6 %). This pattern of relatively low old-age dependency ratios observed for suburban areas around the Spanish capital extended to Coslada, Las Rozas de Madrid and Torrejón de Ardoz (all of which reported rates of less than 20 %) and was repeated around the French capital, as the cities of Marne la Vallée, Cergy-Pontoise and Saint-Quentin en Yvelines (which are all situated within a radius of no more than 20 km from central Paris) also recorded old-age dependency ratios that were below 15 %. Several reasons may underlie these patterns: young people may be unable to afford to buy or rent in city centres (especially in capital cities) and instead live in the surrounding suburbs; families may move to the suburbs to have additional (and more affordable) living space; older people may move out of the suburbs to retire to the countryside or coast.
In the vast majority of cities the old-age dependency ratio increased over time (as it did for the EU as a whole)
In 2014 the old-age dependency ratio of the EU-28 stood at 28.2 %, 3.8 percentage points higher than it had been a decade earlier, confirming the gradual ageing of the EU’s population. Indeed, during the same period the median age of the population rose from 39.2 to 42.2 years.
A closer analysis of the developments for cities in the EU (subject to data availability) reveals that of the 477 cities for which information is available for both 2004 and 2014, the vast majority (424) saw their old-age dependency ratios increase, two reported no change, leaving 51 where the ratio of older people to the working-age population fell.
There were 21 cities where the old-age dependency ratio increased by more than 10 percentage points over the period under consideration. The biggest increase — 15.6 percentage points — was recorded for the eastern German city of Dessau-Roßlau (which, as noted above, had one of the highest old-age dependency ratios in the EU). There were six more German cities as well as six Spanish cities which recorded double-digit increases in their old-age dependency ratios between 2004 and 2014, while the other cities with increases of more than 10 percentage points included two from Bulgaria and Italy, as well as single cities from each of the Czech Republic, Lithuania, Poland and Portugal (note that the data for Porto concern the period 2004–2013).
At the other end of the range, a majority (31) of the 51 cities that reported a falling old-age dependency ratio between 2004 and 2014 were situated in the United Kingdom. The remaining 20 cities included seven from Germany, five from Belgium (data are for 2004–2013), three from Italy (all of which were in the region of Emilia-Romagna), two from the Netherlands, and single cities from each of Denmark (the capital city of København; data are for 2004–2013) and Spain.
The largest reductions in old-age dependency ratios — -5.0 percentage points — were recorded in the Belgian city of Antwerpen (2004–2013) and in two cities from the United Kingdom, Bournemouth and Manchester. The old-age dependency ratio fell by 4.6 points in the Belgian capital city of Bruxelles/Brussel (data are for 2004–2013), while there were five cities where this ratio fell by 3.0–3.6 points, namely, Brighton and Hove, Glasgow and Slough (all in the United Kingdom), the Belgian city of Liège (2004–2013) and the German city of Trier.
Europe 2020: education and employment by degree of urbanisation
Europe 2020 is the EU’s growth and jobs strategy for the current decade, aiming for a smart, sustainable and inclusive future. The strategy envisages measures to address the structural weaknesses in the European economic model and to deliver high levels of employment, productivity and social cohesion in the EU Member States, while reducing the impact of economic activity on the natural environment. To reach its objective, the EU has adopted eight targets in the areas of employment, research and development (R & D), climate change and energy, education and poverty reduction, to be reached by 2020. These have been translated into national targets to reflect the situation and possibilities of each Member State to contribute to the common goal. A set of nine headline indicators and additional sub-indicators gives an overview of how far the EU is to reaching its overall targets.
The classification of areas by degree of urbanisation identifies cities (or densely populated areas), towns and suburbs (or intermediate density areas) and rural areas (or thinly populated areas). In Figure 3 three of the Europe 2020 indicators are presented with an analysis by degree of urbanisation, focusing on education and employment.
The share of early leavers from education and training, defined as the share of 18 to 24 year olds with at most lower secondary education and not in further education and training, has consistently decreased since 2008, for both men and women. In 2016, the share was 10.7 % in the EU-28, compared with 14.7 % in 2008. Thus, the EU is steadily approaching its headline target for 2020, which envisages reducing the rate of early leavers from education and training to less than 10 %.
When compared with rural areas and with towns and suburbs, fewer young people in cities had left school with at most lower secondary education and were not in further education or training. In 2016, 9.7 % of young people in cities were early leavers, below the Europe 2020 headline target of 10 % and below the 10.7 % average for all areas. For this indicator there was not a great difference between the shares recorded for towns and suburbs (11.2 %) and for rural areas (11.9 %).
The Europe 2020 strategy lays down a headline target of increasing the share of the population aged 30 to 34 years having completed tertiary or equivalent education to at least 40 % by 2020. This target is related to some extent to the research and development and innovation target, namely to increase expenditure on R & D to 3 % of GDP, which in turn is likely to raise the demand for highly skilled workers. Between 2002 and 2016, there was uninterrupted annual growth in the share of 30 to 34 year-olds having completed tertiary education, rising from 23.6 % to 39.1 %. Growth was considerably faster among women, who in 2016 were already clearly above the Europe 2020 target at 43.9 %. By contrast, among 30 to 34 year-old men the share was 34.4 % in 2016.
Concerning the prevalence of tertiary education and training among people aged 30 to 34 years there was also a clear distinction between cities and the two other types of areas. This can largely be explained by two factors, namely that most tertiary education establishments (such as universities) are located in cities and secondly large cities tend to have a large and broad labour market often requiring specialised personnel which attracts graduates. In cities, 48.8 % of persons aged 30 to 34 years had a tertiary education in 2016, again above the Europe 2020 target for the EU which is 40 % and the average for all areas which was 39.1 %. By contrast, the share was 33.6 % in towns and suburbs and 28.4 % in rural areas.
The employment rate shows what proportion of the population is employed. The indicator used for the Europe 2020 headline targets is for people aged 20 to 64 years and therefore generally excludes people of an age that they are likely to be in compulsory education and that they are retired. In 2008, employment in the EU-28 for the age group 20 to 64 peaked at 70.3 % of the population in the same age range. In the following years the pattern of development for the employment rate reversed as a result of the impact of the global financial and economic crisis on the EU’s labour market; by 2013, the EU-28 employment rate had fallen to 68.4 %. In 2014, the employment rate started increasing again and by 2016 reached 71.0 %, the first time it had risen above its 2008 level. As a result, in 2016 the employment rate in the EU-28 remained 4.0 percentage points below the 75 % Europe 2020 headline target.
There was very little difference in the employment rates between the three different degrees of urbanisation in 2016, ranging from 70.8 % in rural areas to 71.2 % in towns and suburbs; the 71.1 % rate in cities was the slightly above the average for all areas. This apparent similarity between the three types of areas results from quite diverse situations among the EU Member States.
For more information:
Degree of urbanisation classification
Regional policies and Europe 2020
Transport
The daily flow of commuters into many of Europe’s largest cities suggests that opportunities abound in these hubs of education, production, distribution and consumption, many of which act as focal points within their regional and national economies. However, as noted above, the impact of large numbers of people living together in and around cities can have a considerable impact on the environment and the sustainability of cities in the EU. Indeed, commuter inflows combined with the internal flow of residents can lead to congestion, resulting in wasted time and associated economic and environmental costs (for individuals and enterprises alike). In an effort to encourage commuters to use public transport services, a few cities have experimented with the introduction of congestion charges and/or restrictions on polluting vehicles; these are primarily designed to discourage the use of roads at peak periods, for example: Milano, Valletta, Stockholm (Sweden) and central London. By freeing-up road space, policymakers hope to be able to reduce emissions, run more efficient public transport services, encourage sustainable modes of transport, and increase the safety of cycling/walking.
Public transport for commuting in cities

The share of people who use public transport to get to work is generally much higher in the EU’s largest cities and in its capital cities, where integrated transport networks are based on rail, underground/metro, bus/tram services. At the start of 2013, Tallinn became the first capital in the EU to provide free public transport services to all of its local inhabitants. By contrast, in provincial cities the use of private motor vehicles tends to be the principal mode of transport for getting to work, with public transport systems sometimes relatively underdeveloped.
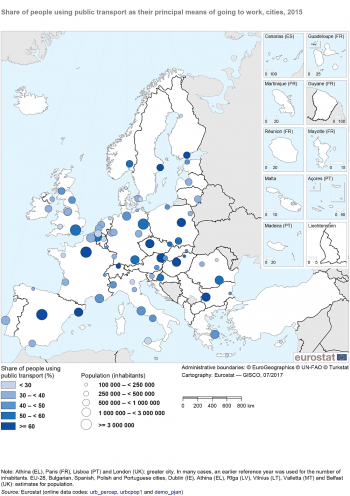
Map 2 shows the share of people using public transport as their principal means of getting to work in 2015 across 75 cities in the EU, Norway and Switzerland, with the size of the circles reflecting each city’s overall population size. The average share of people using public transport as their principal means of getting to work in the 72 EU cities was 49.3 %. In the Austrian, Swiss, French and Czech capital cities, at least two thirds (67 % or higher) of people used public transport as their principal means of getting to work. Shares of 60 % or more were also reported for Barcelona and the capital cities of Hungary, Sweden, Bulgaria, Spain, Finland and Poland.
Less than 30 % of people used public transport as their principal means of getting to work in 16 of the 75 cities, including the capital cities of Cyprus — which had the lowest share (5 %) of all cities — and Malta. The largest cities (among the 75 surveyed) where less than 30 % of people used public transport as their principal means of getting to work were Greater Manchester (the United Kingdom), Palermo (Italy) and Antwerpen (Belgium).
Means of transport for commute in capital cities
Public transport was the most common form of transport for commuting to work in some of the EU’s largest cities
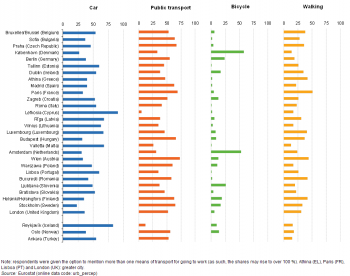
A broader analysis of a variety of modes of transport used for going to work in 2015 is presented in Figure 4 for capital cities in the EU, Iceland, Norway and Turkey. Four modes are presented, including private cars, public transport, cycling and walking: note that the sum of the shares exceeds 100 % as respondents were given the opportunity to mention more than one means of transport for making their journey to work.
Car use is quite low in some capital cities: in 17 of the 31 capital cities shown in Figure 4, less than half of the respondents used cars as their principal means of getting to work in 2015. In most of the remaining capital cities the share using cars did not greatly exceed two thirds except in two of the smallest capital cities, Reykjavik (Iceland) and Lefkosia. Two of the factors restricting car usage in many big cities are congestion and the limited availability (and high cost) of parking.
Another factor that may explain, at least in part, the relatively low share of car usage in some capital cities is the wide range of public transport services generally on offer; these provide an alternative that is to a greater or lesser extent affordable and efficient. In 16 of these 31 capital cities, a majority of people used public transport as their principal means of getting to work in 2015. This share peaked at 73 % in Wien (Austria). Unsurprisingly, given the high car use in Lefkosia and Reykjavik, the use of public transport in these cities was particularly low.
Given the considerable distances that may be involved, it is often problematic for commuters living in the biggest cities to go to work by bicycle or foot. However, in smaller cities that have relatively compact centres, it is increasingly common to find a relatively high proportion of journeys to work being made on foot or by bicycle. It is likely that many people who use a car or public transport to travel to work also walk as part of their journey, between their place of work and either a car park or a stop/station (for example for a bus, tram, trolley-bus, underground/metro or train). Walking to work was generally the third most common mode of transport in capital cities (behind cars and public transport), although it was more common than public transport in Reykjavik and Lefkosia and more common than cars in Athina, Paris, Budapest, Wien, Helsinki/Helsingfors (Finland) and Stockholm. Only in Paris, did a majority (51 %) of respondents say that they walked to work. At least one in five respondents walked to work in the majority (20 out of 31) of the capital cities shown in Figure 4; the lowest shares of people working to walk were reported in København (14 %) and Valletta (13 %).
As well as the overall size of a city, one factor influencing the use of a bicycle for travelling to work is the extent of cycle path networks. Among the capital cities shown in Figure 4, the highest shares of journeys to work by bicycle in 2015 were recorded in København and Amsterdam, where more than half of the respondents indicated that they cycled to work; in these two cities a higher proportion of people cycled to work compared with those using a car or those using public transport. The next highest shares were in Ljubljana (Slovenia) and Berlin where about one in four people cycled to work. Elsewhere — in the remaining 27 capital cities — the proportion of people using a bicycle as their principal means for going to work was below one in five, dropping below 1 in 10 in 19 cities and below 1 in 20 in 13 cities; in Ankara (Turkey) the share was less than 1 %.
Big data project — Belgian mobile phone data
Big data refers to large and very detailed digital trails left by people in their use of IT systems or detailed digital information that is captured by sensors. Examples include the information recorded while people browse the internet or connect to a mobile telecommunications network, or sensors that may be found along the side of main roads (which may be used to detect, for example, traffic volumes or carbon dioxide emission levels). These data can be used to identify patterns and analyse human behaviour.
Mobile phone networks are based on a cellular system with each cell served by a base station with a communications tower and a set of antennas. Statistics Belgium and Eurostat have worked with Proximus (a Belgian mobile network operator) to investigate the potential of data from mobile networks that are stored as part of an operator’s telecommunications system, for example, data on when and where people connect to a network through a mobile device.
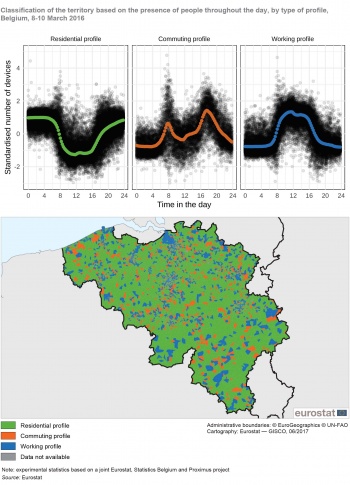
The work started with the development of a map of spatial areas approximating the mobile network cells, independent of the telecommunications technology (for example, 2G, 3G or 4G). An analysis was conducted based on the number of devices connected to the base station of each cell at different times of the day during two week days. Each area was classified into one of three profiles: a residential profile where the number of connections was above average at night and below average during the day; a working profile where the reverse situation was observed; and a commuting profile where there were two peaks (around 08.00 h and 18.00 h). The resulting maps showed a coherent picture, with most of the country made up of residential zones interspersed with a few working zones and commuting zones usually bridging these.
For more information on Eurostat’s experimental statistics, see here.
Source: Eurostat
Environment
Cities are characterised by their high numbers of inhabitants, considerable commuter flows and concentrated areas of economic activity. As such, many cities in the EU are exposed to a range of environmental issues that may impact upon their sustainability and the quality of life of those individuals who live and/or work in them. This section looks in more detail at two specific environmental issues affecting cities, namely, those of air quality and the generation of municipal waste.
Maps 3 and 4 both relate to air quality in cities, focusing on emissions of nitrogen dioxide (NO2) and particulate matter. Exposure to nitrogen dioxide and/or particulate pollution may result in adverse health effects, notably concerning respiratory diseases. A reaction with sunlight can lead to the production of ozone from nitrogen dioxide, which in turn poses serious health risks. The most prominent source of nitrogen dioxide is burning fossil fuels, for example in motor vehicles or in fossil fuel burning ovens and heaters. There are many sources of particulate matter, one common one being soot, again typically from the combustion of fossil fuels. However there are many other sources of organic or inorganic particles. These may originate in man-made activities such as mining, quarrying, construction or manufacturing processes, or come from natural events, such as volcanic eruptions, dust and sand storms, or pollen. The concentration of particulate matter can also be affected by atmospheric/climatic conditions, with pollution levels rising as a result of sunshine and higher temperatures.
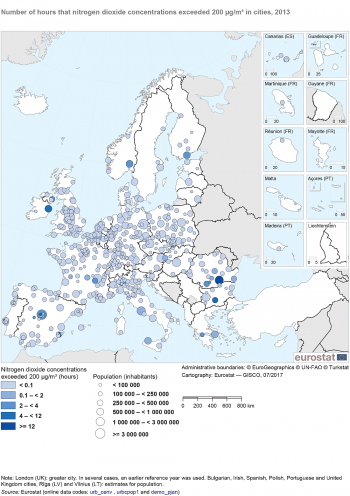
European air quality standards are set in a Directive (2008/50/EC) on ambient air quality and cleaner air for Europe, with a limit of 40 μg/m³ for the annual mean concentration of nitrogen dioxide and a limit of 200 μg/m³ not to be exceeded for more than 18 hours in a year. Map 3 shows the number of hours that nitrogen dioxide concentrations exceeded 200 µg/m³ in 2013. As road transport (particularly diesel engines) is the principal emitter of nitrogen oxide/dioxide and given the congestion in many cities, it is not surprising that the highest concentrations of these emissions are recorded next to roads in major agglomerations.
The longest peaks of nitrogen dioxide concentrations were recorded in Bucuresti
The highest number of hours that nitrogen dioxide concentrations exceeded 200 μg/m³ in 2013 (among those cities in the EU, Norway and Switzerland for which data are available) was recorded in Bucuresti, at 19.0 hours. Bucuresti was the only city shown in Map 3 where the limit of 18 hours was exceeded, as the next highest levels were 13.5 hours in Amadora (Portugal), 9.0 hours in Dublin and 5.0 hours in Majadahonda (Spain). Of the 501 cities shown in the map, the 200 μg/m³ limit was only breached in 2013 in 28 of them (including the four mentioned above), with most located in Spain and Romania (six each), France (four), Italy (three) and Greece (two), with one city each in Belgium, Bulgaria, Slovakia, Finland, the United Kingdom and Norway. Among these 24 cities where nitrogen dioxide concentrations did exceed 200 μg/m³ at least once, nine were capital cities and two others (Milano and Palermo in Italy) were cities with over 500 thousand inhabitants. Four cities with populations below 100 thousand inhabitants also experienced concentrations above 200 μg/m³ at least once: Talavera de la Reina, Guadalajara and Majadahonda in Spain and Slatina in Romania.
The highest concentrations of particulate matter were recorded in eastern and southern EU Member States, particularly in Poland and Italy
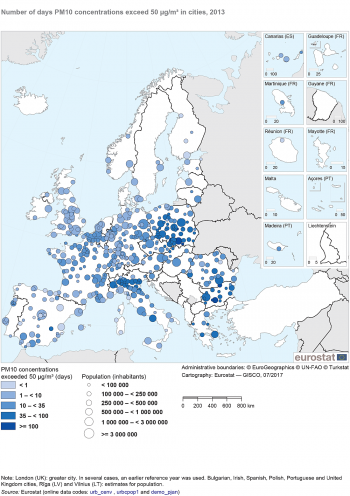
There are short and long-term air quality limits for particulate matter. The data presented in Map 4 concern particles with a diameter of more than 2.5 µm to at most 10 µm, referred to as PM10. The short-term limit is set at not more than 35 days per year with a daily average concentration exceeding 50 μg/m³, while the long-term limit is a mean annual concentration that does not exceed 40 μg/m³.
Among the cities for which data are available in Map 4, the highest number of days of concentrations of PM10 exceeding 50 µg/m³ in 2013 was 172 in Plovdiv (Bulgaria), in other words this concentration was reached nearly every second day. The PM10 threshold was exceeded on at least 100 days in 2013 in 12 cities (shown with the darkest shade in Map 4), mainly in southern Poland where coal mining and industry dominate the economy, but with three (including Plovdiv) in Bulgaria and one in the Czech Republic. A further 83 cities also reported that concentrations of PM10 exceeded 50 µg/m³ on 35 days or more (but less than 100 days) in 2013, with these concentrated in Poland (34 cities) and Italy (21 cities). Douai in France was the only city in western Europe to report 35 days or more of PM10 concentrations exceeding 50 µg/m³ in 2013, while none of the cities in northern Europe passed this threshold.
The 23 cities in Map 4 that did not report concentrations of PM10 exceeding 50 µg/m³ on any day in 2013 were also often located in southern Europe — mainly in Spain (12 cities) and Italy (five) — although there was also a group of three Finnish cities and one Estonian one in northern Europe; Bacău (Romania) and Saint Denis (France) were the only cities in the eastern and western Member States where concentrations of PM10 did not exceed 50 µg/m³ on any day in 2013.
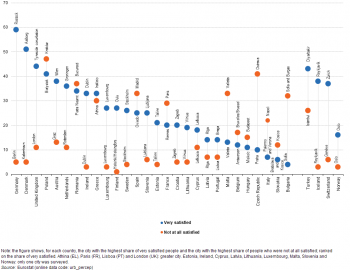
Figure 5 provides information concerning satisfaction with air quality in cities from a perception survey on the quality of life in 79 European cities that was conducted during May and June 2015. Data have been summarised for all cities within each EU Member State (as well as four non-member countries); it should be noted that in several of the smaller Member States as well as Iceland and Norway only one city was surveyed.
In 2015, the highest proportion of people reporting that they were very satisfied with the quality of air in their city was 59 % in Rostock (Germany); equally, a majority (51 %) were very satisfied with the air quality in the Danish city of Aalborg. By contrast, in Italy, Slovakia and Bulgaria there were no cities where at least 10 % of the population were very satisfied with the air quality, with just 1 % of people in Burgas (Bulgaria) very satisfied with their city’s air quality.
The proportion of people who were not at all satisfied with air quality in their city in 2015 peaked at 47 % in Kraków (Poland), followed by 41 % in Ostrava (the Czech Republic). Other cities where the level of dissatisfaction was high included Bucuresti, Valletta, Madrid, Sofia (Bulgaria) and Burgas.
Municipal waste generated per inhabitant was highest in cities on the Costa del Sol
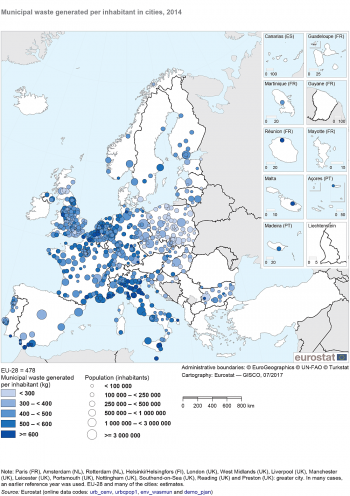
Across the whole of the EU-28, an average of 478 kg of municipal waste was generated per inhabitant in 2014. Map 5 shows, for 685 cities in the EU, Norway and Switzerland, the average level of municipal waste generated per inhabitant. In three cities, Fuengirola and Marbella on the Costa del Sol in Spain (2010 data) and Sénart en Essonne, near Paris in France (2013 data) the level was over 1 000 kg per inhabitant and therefore more than double the EU-28 average. It is likely that these figures are inflated, to some degree, by the associated waste streams from visitors to hotels and other forms of accommodation/lodging, particularly for the two Spanish cities; such high levels of waste may raise concerns over the sustainable nature of tourism. An analysis for the 10 cities in the EU-28 with the highest levels of municipal waste per inhabitant shows that aside from the two coastal cities of Fuengirola and Marbella (mentioned above), six of the remaining eight cities were also located on or close to the Mediterranean or Adriatic coastline in France or Italy. The top 10 was completed by two cities within the French capital city region: Sénart en Essonne (mentioned above) and Saint Denis.
In Malta, Slovenia and Finland, every city (among those for which data are available) recorded a level of municipal waste generation per inhabitant that was above the EU-28 average, while in the Czech Republic, the Baltic Member States and Poland, every city recorded a level of municipal waste generation per inhabitant that was below the EU-28 average.
Data sources and availability
Eurostat’s data collection on cities (formerly known as the Urban Audit) is undertaken by national statistical authorities, the Directorate-General for Regional and Urban Policy (DG REGIO) and Eurostat. It provides statistics on a wide range of socioeconomic indicators that cover most aspects relating to the quality of life in more than 900 cities, each with a population of at least 50 thousand inhabitants in their urban centre.
The collection of data covers all of the EU Member States, Norway, Switzerland and Turkey; note that there may be considerable differences in relation to the latest reference period available for each city. The information presented in this article relates to three concepts: the majority of the data presented refers to cities (one or more local administrative unit (LAUs) where the majority of the population lives in an urban centre of at least 50 thousand inhabitants), although the concepts of the greater city (an approximation of the urban centre when this stretches beyond the administrative city boundaries) and the functional urban area (a city plus its surrounding commuting zone) are also employed. The information presented has been adapted to reflect the most appropriate definitions, whereby information on greater cities is preferred when reflecting cases where a relatively high share of the population lives outside of the administrative boundaries of the urban centre (for example, the Greek capital of Athina).
The Directorate-General for Regional and Urban Policy conducts a perception survey every three years across a range of cities in the EU Member States, Iceland, Norway, Switzerland and Turkey; the latest survey was conducted in June 2015. These surveys cover a range of issues, including: employment, the environment, housing, transport, culture, city services and immigration.
Indicator definitions
Glossary entries on Statistics Explained are available for a wide range of concepts relating to cities, while glossary entries for indicators may be found under the relevant thematic heading, including: early leavers from education and training, the old-age dependency ratio, nitrogen dioxide, particulate matter (PM10) or municipal waste.
For more information:
Dedicated section on cities
Methodological manual on city statistics
Context
Europe 2020
The Europe 2020 strategy represents the EU’s growth strategy until 2020: its aim is to support the recovery from the global financial and economic crisis through smart, sustainable and inclusive growth. The strategy is implemented at different political levels, taking account of the diversity of regional developments in the EU, through tailor-made contributions by individual regions and cities.
Looking at the five targets which are used to measure progress under the Europe 2020 strategy, capital cities are often seen to outperform other areas. The gap between capital cities and other cities was particularly large in several EU Member States characterised by a broadly monocentric pattern of development (for example, Greece or France). By contrast, in those Member States characterised by a broadly polycentric pattern of development (for example, Germany or Italy), the performance of the capital city was often quite similar to that recorded for other cities. Several western EU Member States (for example, Belgium or the United Kingdom) displayed relatively low scores for several cities — in particular those that developed rapidly during the industrial revolution — with a large proportion of their inhabitants facing considerable socioeconomic difficulties, such as relatively low employment rates and levels of educational attainment, or relatively high rates of social exclusion and poverty. By contrast, in the eastern Member States, cities generally tended to outperform rural areas and this was especially the case for capital cities.
Sustainable cities
The European Commission’s Directorate-General for Environment (DG Environment) works on a range of issues with the goal of improving urban environments, for example:
- the United Nations (UN) sustainable development goals, in particular goal 11, which seeks to ensure that all cities are inclusive, safe, resilient and sustainable;
- EU environmental legislation which aims to guarantee that European citizens may live and work in cities that provide clean air and water, avoid exposure to excessive noise, and deal properly with waste, while protecting nature and biodiversity, and promoting green infrastructure;
- the European Green Capital initiative, which allows cities to showcase their environmental performance, recognising and rewarding local efforts to improve the environment, the economy and the quality of life in cities (the German city of Essen was the winner of the 2017 award);
- the European Green Leaf initiative, which allows towns and smaller cities (of between 20 and 100 thousand inhabitants) to be recognised for their commitment to better environmental outcomes, with a particular accent on efforts that generate green growth and new jobs (the Irish city of Galway was the winner of the 2017 award).
As part of the 7th Environmental Action Programme (7EAP) — living well, within the limits of our planet, the European Parliament and Council outlined a priority objective (no 8) designed to enhance the sustainability of the EU’s cities. This action seeks to ensure that a majority of cities in the EU are, by 2020, implementing policies for sustainable urban planning and design, including urban public transport and mobility, sustainable buildings, energy efficiency and biodiversity conservation.
The European Commission adopted a Clean Air Policy Package in December 2013, consisting of a new Clean Air Programme for Europe with new air quality objectives for the period up to 2030, a revised National Emission Ceilings Directive with stricter national emission ceilings for the six main pollutants, and a proposal for a new Directive to reduce pollution from medium-sized combustion installations.
The EU’s cohesion policy is also used to promote sustainable urban development. A minimum of 5 % of the budget for the European Regional Development Fund (ERDF) should be invested in sustainable urban development in each of the EU Member States; city authorities decide upon the best measures for spending these funds.
See also
- European cities - spatial dimension (background article)
- Rural areas in the EU
- Territorial typologies for European cities and metropolitan regions (background article)
Further Eurostat information
Data visualisation
Publications
- Urban Europe — Statistics on cities, towns and suburbs — 2016 edition
- Sustainable development in the European Union — A statistical glance from the viewpoint of the UN Sustainable Development Goals — 2016 edition
- Eurostat regional yearbook 2015 — Chapter 15
- Eurostat regional yearbook 2014 — Chapter 14
- Eurostat regional yearbook 2013 — Chapters 12 and 13
- Quality of life in European cities 2015 — Perception survey in 79 European cities — European Commission, Flash Eurobarometer 419, January 2016
- Quality of life in cities 2012 — Perception survey in 79 European cities — European Commission, Flash Eurobarometer 366, October 2013
Database
- Urban audit (urb), see:
- Cities and greater cities (urb_cgc)
- Functional urban areas (urb_luz)
- Perception survey results (urb_percep)
Dedicated section
Methodology / Metadata
- Metadata on city statistics (ESMS metadata file — urb_esms)
- Methodological manual on city statistics — Eurostat (2017)
- A harmonised definition of cities and rural areas: the new degree of urbanisation — European Commission (2014)
- Cities in Europe — The new OECD-EC definition — European Commission (2012)
Source data for figures and maps (MS Excel)
External links
