Archive:Agri-environmental indicator - gross nitrogen balance
- Data from January 2017. Most recent data: Further Eurostat information, Main tables and Database. Planned update: October 2018.
This article provides a fact sheet of the European Union (EU) agri-environmental indicator gross nitrogen balance. It consists of an overview of recent data, complemented by all information on definitions, measurement methods and context needed to interpret them correctly. The gross nitrogen balances article is part of a set of similar fact sheets providing a complete picture of the state of the agri-environmental indicators in the EU.
The indicator gross nitrogen balance provides an indication of the potential surplus of nitrogen (N) on agricultural land (kg N/ha/year) it also provides trends on nitrogen inputs and outputs on agricultural land over time. It is measured by the following indicator:
Main indicator:
- Potential surplus of nitrogen on agricultural land (kg N/ha/year)
Main statistical findings
Key messages
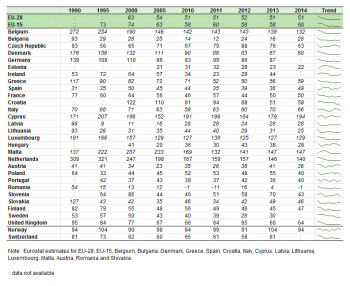
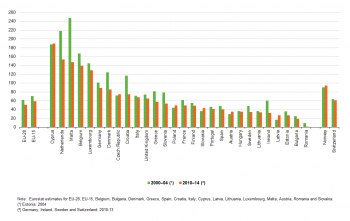
- In most countries, with the exception of Czech Republic, Cyprus, Latvia, Austria, Poland, Slovakia, and Norway, the average gross nitrogen balance (GNB) per ha of UAA between 2010 and 2014 was lower than between 2000 and 2004.
- The average GNB 2010-2014 was higher in EU-15 (59 kg N per ha per year) than in EU-28 (51 kg N per ha per year).
- Due to methodological issues or missing data nutrient balances have been estimated by Eurostat for: Belgium, Bulgaria, Denmark, Greece, Spain, Croatia, Italy, Cyprus, Latvia, Lithuania, Luxembourg, Malta, Austria, Romania and Slovakia.
- The quality and accuracy of the estimated GNB per ha is depending on the quality and accuracy of underlying data and coefficients used. As methodologies (especially with regards to the coefficients) and data sources used in countries vary, the balances are only consistent within a country across time. The gross nitrogen balances are not consistent across countries, which means that data should not be compared between countries. Currently an update of the handbook on gross nutrient balances is being discussed with experts in the Member States (MS), to improve the coherence and transparency of data and methodologies used across Member States and to improve the coherence with related data collection such as greenhouse gas inventories by the United Nations Framework Convention on Climate Change (UNFCCC) and the ammonia emissions inventories by the United Nations Economic Commission for Europe (UNECE) - Convention on Long-range Transboundary Air Pollution (CLRTAP).
Assessment
Analysis at EU level
The gross nitrogen balance for the EU-28 reduced from an estimated average of 61.8 kg N per ha per year in the period 2000-2004 to 51.1 kg N per ha per year in the period 2010-2014. For the EU-15 the GNB dropped from average 70.6 kg N per ha per year in 2000-2004 to average 58.8 kg N per ha per year in 2010-2014. The average GNB per ha in 2010-2014 is highest in countries in the North-West of Europe (the Netherlands, Belgium, Luxembourg, Norway, Germany, Denmark) and the Mediterranean islands Cyprus and Malta, while many of the Cenral and East European countries (Hungary, Lithuania, Latvia, Estonia, Bulgaria, Romania), as well as Sweden and Ireland belong to the countries with the lowest N surpluses (Figure 1).
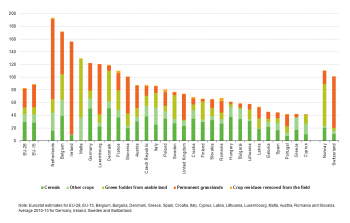
Figure 2 shows that many of the countries with a high N surplus also have a relative high N input per ha per year (for instance the Netherlands, Belgium and Malta), though a high input does not necessarily lead to a high N balance, as the balance also is determined by the output. The N input per ha of Ireland (estimated at 189 kg N per ha per year) for instance is only 10 % lower than the one of Germany (estimated at 211 kg N per ha per year), but the N surplus of Ireland is only one third of the surplus of Germany, as the N output per ha in Ireland was estimated on average at 156 kg N per ha per year and the output in Germany only 122 kg N per ha per year as can be seen in Figure 2 and Figure 5.
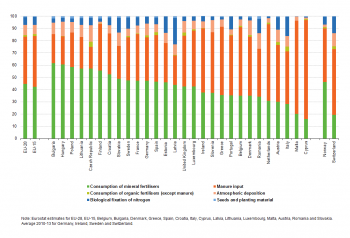
The inputs of the gross nitrogen balance consist of mineral fertilisers, organic fertilisers (except manure), manure input, atmospheric deposition, biological nitrogen fixation and seeds and planting material. Mineral fertilisers and manure account for more than 83 % of the N input in the EU-28 between 2010 and 2014. The N input with seeds and planting materials is negligible. At the moment the re-use of N through the use of compost, sewage sludge, industrial waste etc. is also quite insignificant. Data on other organic fertilisers (except manure) are lacking in many countries, therefore the significance of these fertilisers could be underestimated. Biological nitrogen fixation is on average 6 % of total N input in the EU-28. The level of atmospheric deposition is depending on ammonia (NH3) emissions (of which agriculture is the main source), nitrogen oxides (NOx) emissions (where the contribution of agriculture is not significant) and climate conditions (transport through air to other regions). Atmospheric deposition was on average 8 % of total inputs in the EU-28.
Figure 3 shows large differences between countries in the use of inputs. The choice of fertiliser type (manure, mineral fertilisers, other organic fertilisers) has different impacts on the environment:
- Nitrogen volatilizes from manure in animal housing, storage and with the application to the land. These emissions mainly depend on the type of manure, farm management practices like type of animal housing, manure storage, timing and application techniques.
- N emissions from mineral fertilisers during the application to the land depend on type of fertiliser, farm management practices like application techniques, timing and other factors such as soil type, and weather conditions.
- The N is not available to the plant in the same rate for different types of manure and mineral fertilisers.
- Other potential fertilisers like urban wastes often include health hazards (to both crops and humans) and procedures commonly used to reduce these hazards - such as composting - tend to reduce the fertiliser value (leaching/volatilisation).
- Nitrogenous fertilisers are produced using high amounts of energy. The production of these fertilisers contributes therefore to GHG emissions and fossil fuel depletion.
Mineral fertiliser consumption was the main input in EU-28 in 2010-2014 with an average of 45 % in total nitrogen inputs, followed by the manure input (39 %). Available data on manure withdrawals for non-agricultural use show that this input is significant (more than 5 % of total manure input) in some countries (Belgium, Czech Republic, the Netherlands), while non-significant (less than 1 % of total manure input) in other countries (Estonia, the United Kingdom, Switzerland). However, most countries don’t have data or only limited data available on manure withdrawals. Almost no country has data available on changes in manure stocks. Under normal circumstances it can be assumed that the change in manure stocks is on average zero. Data on manure imports are only available from CH, AT and BE. Manure imports were insignificant (less than 1% of total manure input) for these countries. Trade of manure is mainly from high surplus countries to neighboring countries. It is known that there are exports from for instance the Netherlands to Germany. It is likely that countries with a high nutrient surplus like Belgium and Denmark may export manure as well.
The manure production is determined by the amount and type of livestock in the country. The agri-environmental indicator livestock patterns shows the livestock density in EU-28 in 2010. Malta, the Netherlands, Belgium, Denmark, Cyprus and Ireland have the highest livestock densities and also have the highest rates of manure input per ha (over 98 kg N per ha per year). Bulgaria, Estonia, Latvia, Lithuania and Slovakia have the lowest livestock densities and also belong to the countries with the lowest rates of manure input per ha (less than 30 kg N per ha per year). The countries with the highest livestock densities also belong to the countries with a high share (over 50 %) of manure in total nutrient input. Portugal and Romania, two countries with a relative low livestock density have a relative high share of manure in total input as well, due to a low use of mineral fertilisers. Figure 2 in this fact sheet shows that some of the countries (the Netherlands, Belgium) with the highest use of manure per ha also have a high use of mineral fertilisers (over 100 kg N per ha per year), while some of the countries (Romania, Estonia, Bulgaria, Latvia and Spain) with the lowest rates of manure per ha (less than 40 kg N per ha per year) also belong to the countries with a relative low use (less than 50 kg N per ha per year) of mineral fertilisers per ha.
Figure 4 shows that cattle is the main source of manure nitrogen production (with more than 50 %) in the majority of countries. In Denmark, Bulgaria, Croatia, Malta, Spain, Hungary and Romania different livestock types are important, whereas in Cyprus and Greece the sheep and goats have the highest share.
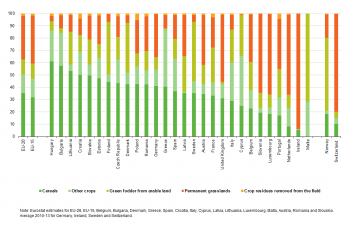
The removal of nitrogen with harvest and grazing of crops and forage per ha varies between crops and countries as can be seen in Figure 5. Per ha, grassland and cereals production have the highest N removal rates, though great variation exists between countries due to differences in yields and N content per tonne of product. The N content per tonne of product is among others depending on farmer practices like fertilisation, irrigation, mowing vs. grazing etc. It should however be noted that coefficients may also vary among countries and crops due to differences in methodologies used, see also section on data and methodology. The dominant share of total N output in the EU-28 (average 2010-2014) is the uptake of N with cereal production (35 %) and permanent grassland (35 %), see Figure 6. N output is depending on cropping patterns, yields, farm management practices (tillage, irrigation etc.), climate etc. The agri-environmental indicator cropping patterns shows that the permanent and temporary grassland covered 41 % and cereals 32 % of the utilised agriculture area (UAA) in EU-28 in 2010. There are however significant differences between countries. In some countries (for example Ireland, Luxembourg, Slovenia, the United Kingdom, Norway and Switzerland) grassland dominates the UAA, whereas for instance in Bulgaria, Hungary and Denmark cereals are the dominating crop. Permanent crops are significant in Mediterranean countries.
Analysis at country level
As explained in the section on data and methodology, the current balances are not comparable between countries due to differences in definitions, methodologies and data sources used by countries. In the next section a few trends and specifics at Member States level are highlighted.
Since 1990 nitrogen inputs per ha have been continuously decreasing for Belgium, Denmark, Greece, Luxembourg, the Netherlands, and the United Kingdom. In the Central and East European countries the total N input decreased significantly during the economic transition between 1989 and 1995. In some of the Central and East European countries a trend towards recovery can be noted, for example the Czech Republic, Hungary, Poland and Slovakia, while in other countries such a trend cannot be noted and N inputs remain well below the level before the transition, e.g. Romania (Table 2).
The main average nitrogen input at EU-28 level 2010-2014 was from mineral fertilisers, see Figure 3. In most Central and East European countries the share of mineral fertilisers in total nitrogen inputs increased between the mid-nineties and 2014, as consumption of mineral fertilisers increased and manure inputs decreased. In many Central and East European countries manure N input decreased significantly following sharp declines in livestock populations during and after the transition period. In the Czech Republic, for example, 74 % of the manure production (tonnes of nitrogen) was produced by cattle and 14 % by pigs (average 2010-2014, Figure 4). Cattle and pig populations decreased between 1990-2014 with ca 60 % in the Czech Republic[1], which had a significant impact on the manure production and manure input[2]. Manure input (tonnes of N) decreased by 62 % between 1990-2014 in the Czech Republic. In Luxembourg, Ireland, Slovenia, Greece, Portugal, Belgium, Denmark, Romania, the Netherlands, Austria, Italy, Malta, Cyprus and Switzerland the average share of manure input was larger than the share of mineral fertilisers between 2010 and 2014. In Denmark the share of manure in total inputs was initially lower than that of mineral fertilisers. Mineral fertiliser consumption in Denmark however decreased significantly (-53 %) between 1990 and 2014. As manure input decreased only by 12 % in the same period, the share of manure in total inputs increased gradually to surpass the share of inorganic fertilisers in total inputs in 1999.
Manure input in the gross nitrogen balance is based on manure production, manure withdrawals and manure import where the manure production is calculated from livestock numbers and excretion factors. The average N excretion per animal per year is depending on animal characteristics (e.g. production level, race etc.) and farmer practices (for instance animal diets). Many countries take the average level of milk production per cow into account in the estimation of excretion coefficients (a higher level of milk production per cow in general means a higher feed intake and therefore a higher N excretion). Excretion coefficients are at the moment only updated regularly to take into account changing farmer practices in a few countries. Most countries use fixed coefficients, this means that for these countries changes in farmer practices other than reducing animal numbers are not taken into account. The Netherlands is one of the countries which has updated its excretion coefficients regularly. They are estimated annually based on a model which takes into account animal feed requirements, statistical data on livestock numbers, animal products, feed production, grazing systems, animal housing and other data. The N excreted per animal per year decreased for most livestock types (though for certain livestock types the average N excretion per animal per year increased, for example the fattening calves.
The estimated nitrogen output depends mainly on the areas and yields of crops and fodder. In most countries the coefficients used to determine the nutrient contents of crops are constant over time. In the Netherlands, data on nutrient contents of grassland products and silage maize are updated annually and are based on a large sample of measurements from dairy farms. These data show a downward trend in the nutrient content of grassland products since 1996 and silage maize between 1992 and 2000 due to a significant decrease in fertilisers used on these crops[3]. The yields of crops and fodder are influenced by farmer practices (like pesticide and fertiliser use, irrigation etc.) and by soil type and weather. Weather conditions vary significantly from year to year and these fluctuations can also be seen in the estimated nitrogen outputs and surplus. In 2003 and 2007 large parts of Europe were hit by extreme weather conditions[4] causing significant drops in crop production. In many Member States a peak in the nutrient balance can be noted for these years. Variations in the nitrogen surplus between years should therefore be interpreted with care. Climate and weather conditions are beyond the control of the farmer. To dampen the effect of weather conditions on the balance the results presented with regards to the nutrient balance are mostly presented not referring to a particular year but as an average for a certain period.
Nitrogen use efficiency
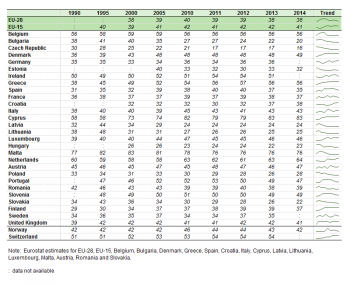
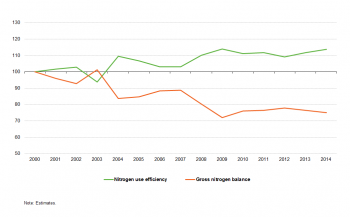
Another way of presenting the results of the gross nitrogen balance is the nitrogen use efficiency (NUE) ratio, which is defined as total nitrogen outputs divided by total nitrogen inputs. It gives an indication of the relative utilization of nutrients applied to agricultural production system. In principle, by decreasing the nutrient surplus over time, the nutrient use efficiency increases (Figure 7). NUE depends on the production system and its management. NUE increases as the N output in harvested products increases and/or the N input decreases. Conversely, NUE is low when the N output in harvested products is relatively low and the N input relatively high. Many combinations are possible, but the ideal case is often a high N output via harvested products combined with a high NUE and a low N surplus.
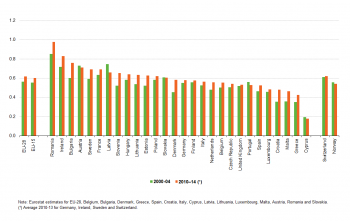
Figure 8 shows that the overall nitrogen use efficiency in the EU-28 increased by 9.8 % between 2000-2004 and 2010-2014. This can be interpreted as improved utilisation of nitrogen applied to the field in a considerable number of Member States. Figure 8 also shows that in most countries the average nitrogen use efficiency between 2010 and 2014 increased compared to the period 2000–2004. However, the highest value of nitrogen use efficiency does not necessarily mean the best and desirable results. Rates which may be close to or above 1.0 would indicate a risk of soil depletion, as the nutrient uptake by crops exceeds the amount of nutrients applied to the soil. From a longer-term perspective, this trend cannot be considered sustainable. In some countries with high average nitrogen use efficiency in the period 2010–2014, the gross nitrogen balance was, in fact, very low (Romania, Bulgaria, Latvia). This was mostly because in most of the Central and East European countries the use of fertilizers dropped drastically in the late 1980s and early 1990's as a result of political and economic changes. At the opposite end of the scale were countries with the lowest nutrient use efficiency (for example Cyprus and Malta), in which the gross nitrogen surplus was high. This was a result of the fact that the nutrient input in these countries exceeded considerably the total crop demand of agricultural production. This of course indicates a risk of nitrogen losses with potential pollution of the environment.
For proper interpretation, NUE should be reported together with the N output in harvested products (as indicator for the productivity of the system), and the N surplus (as proxy for the potential N loss to the environment). For this purpose, data on the gross nitrogen balance can be plotted also in the two-dimensional input – output diagram of the NUE indicator. The Figure 9 shows the relationships between mean nitrogen inputs and outputs for the EU-28, Norway and Switzerland for the period 2010-2014. Average nitrogen inputs ranged from 65 to 347 kg N per ha per year and nitrogen output from 41 to 193 kg N per ha per year. NUE ranged from 18 to 98 %. The latter value (for Romania) indicates the risk that soil mining may take place. Relatively low NUE values occurred at both low and at high N inputs, but relatively high NUE values occurred mostly only at relatively low N inputs. Mean N inputs and N outputs were in general lower for the Central and Eastern European countries than for the 15 "old" Member States. The 7 out of 8 countries with a N surplus of more than 80 kg N per ha per year had a N output larger than 100 kg N per ha per year. The N surplus was almost always less than 80 kg N per ha per year when N output was less than 100 kg per ha per year.
The two-dimensional input – output diagram of the NUE indicator represents a useful way to illustrate and monitor improvements in NUE performances within the systems. Four main directions of change in NUE may be distinguished. The directions toward optimization depend on the starting point and may include intensification, extensification, increasing efficiency and avoiding soil degradation (Figure 10)[5].
The evolution of NUE as the aggregate for EU-28 and EU-15 between 1990 and 2014 is shown in Figure 11. From the data which represent the 5-year averages within the time period 2010-2014 for EU-28 and 1990-2014 for EU-15 can be seen that during this time period (for which data are available) the N inputs tended to decrease whereas the N outputs were increasing, which also lead to the increase of NUE. This may reflect the technical progress and improvements of the farm management techniques and/or changes in policy (reform of the Common Agricultural Policy, e.g. introduction of Agri-environmental measures). The decrease of the inputs is particularly visible in the period 2000-2009, and more for the EU-15 aggregate than for EU-28. This reflects the fact that in the after transformation period in most of the Central and Eastern European countries with strong decrease in fertilizer use following the political and economic change in the beginning of the 1990s, the situation tended to stabilise again during the 2000s.
The NUE indicator may be useful for presenting how different strategies can contribute towards improving relative utilization of nutrients applied to agricultural production system, depending on the starting situation. According to context, both intensification and extensification strategies may contribute. In some contexts the main drive may be to increase food production and resource use efficiency, in other contexts the priority may be to protect soil and habitats from degradation or to increase opportunities for bioenergy production and carbon sequestration.
The development of the NUE indicator is still in progress. It should be noted that for proper interpretation, NUE should be reported together with information about the possible accumulation or depletion of N in the system. For example, N output in harvested products can be high for a few years, while N inputs are temporarily reduced, due to mineralization (release) of soil N from within the system. The reverse is also possible: a low N output in harvested products at relatively high N input, due to accumulation of N in the system.
Data sources and availability
Indicator definition
Potential surplus of nitrogen on agricultural land (kg N/ha/year).
Measurements
Main indicator:
- Potential surplus of nitrogen on agricultural land (kg N/ha/year).
Links with other indicators
- AEI 05 - Mineral fertiliser consumption
- AEI 10.1 - Cropping patterns
- AEI 10.2 - Livestock patterns
- AEI 18 - Ammonia emissions
- AEI 19 - Greenhouse gas emissions
And influences:
- AEI 27.1 - Water quality – Nitrate pollution
Data used and methodology
The methodology of the nitrogen balances is described in Eurostat/OECD Nutrient Budgets handbook. The gross nitrogen balance lists all inputs and outputs into and out of the soil and calculates the gross nitrogen surplus as the difference between total inputs and total outputs. The gross nitrogen surplus per ha is derived by dividing the total gross nitrogen surplus by the reference area. The reference area of the current version of balances uploaded in Eurostat database is the UAA.
The inputs of the nitrogen balance are:
- Fertilisers, which consist of:
- inorganic fertilisers,
- organic fertilisers (excluding manure).
- Gross manure input, which is calculated from:
- manure production (nitrogen excretion; according to the current methodology no reductions are made for nitrogen losses due to volatilisation in stables, storages and with the application to the land);
- manure withdrawals (manure export, manure processed as industrial waste, non-agricultural use of manure, other withdrawals);
- change in manure stocks;
- manure import.
- Other nitrogen inputs, which consist of :
- seeds and planting material;
- biological nitrogen fixation by leguminous crops and grass-legume mixtures;
- atmospheric deposition.
The outputs of the gross nitrogen balance are:
- Total removal of nitrogen with the harvest of crops (cereals, dried pulses, root crops, industrial crops, vegetables, fruit, ornamental plants, other harvested crops);
- Total removal of nitrogen with the harvest and grazing of fodder (permanent grassland and fodder from arable land including temporary grassland);
- Crop residues removed from the field.
The nitrogen input and output is estimated for each item of the balance from basic data by multiplying with coefficients to convert the data into nitrogen content. Basic data (fertiliser consumption, livestock numbers, crop production, agricultural area) are mostly derived from agricultural statistics. Coefficients are mainly estimated by research institutes and can be based on models, statistical data, measured data as well as expert judgements.
Data on fertiliser consumption is available in many countries from country specific data sources (surveys, trade/production statistics), for countries where such data was not available data from UNFCCC Greenhouse Gas Inventories have been used. Due to different data sources used (farmer surveys vs trade/production statistics) and inherent problems of data sources used (for instance inclusion of non-agricultural use in statistics based on trade and production) the quality of data cannot be sufficiently verified. There is need for a common methodology to estimate fertiliser consumption by agriculture to ensure reliable and consistent estimations and comparability across countries.
Data on crop production, livestock number, and agricultural area are available in all countries from harmonised and regulated European statistics (FSS, animal production statistics, livestock registers, crop production statistics). Data on livestock numbers, crop production and reference area have been checked with Eurostat statistics. These data can be considered to be of good reliability.
Excretion coefficients represent the amount of nutrients in manure at the time of excretion, which means that no reductions have been made for volatilisation from the moment of excretion till the application to the soil. In the case country did not deliver excretion coefficients, the excretion has been estimated by animal numbers and excretion coefficients as reported in the 2010 country submissions of to UNFCCC GHG Inventories. Verification and validation of the coefficients requires expert knowledge. A European uniform methodology and validation procedure to estimate excretion coefficients would be necessary to ensure reliable and consistent estimations and comparability across countries. At present the estimation of coefficients vary between countries in methodology (expert judgement vs complex models based on statistical data) and in updating procedures (to take into account the effect of mitigation actions (other than reducing the level of production). Coefficients need to be updated regularly to reflect these changes in farmer practices (mitigation actions). Because manure input is a large part of the balance, the data (especially the level of surplus) cannot be compared between countries as these are largely depending on coefficients used which are based on varying methodologies. In addition, the current situation in many countries is that more than one figure is used for different policy reporting requirements. Therefore there is a need to establish a standardized methodology to estimate excretion to be used for all policy implementation and reporting systems.
Manure withdrawals, manure stocks and imports are not available in most countries. Available data on manure withdrawals for non-agricultural use show that this input is significant (more than 5 % of total manure input) in some countries (Belgium, the Czech Republic, the Netherlands), while non-significant (less than 1 % of total manure input) in other countries (Estonia, United Kingdom, Switzerland).
Almost no country has data available on changes in manure stocks. Under normal circumstances it can be assumed that the change in manure stocks is on average zero.
Data on manure imports are only available from Switzerland, Austria and Belgium. Manure imports were insignificant (less than 1% of total manure input) for these countries. Trade of manure is mainly from high surplus countries to neighboring countries. It is known that there are exports from for instance the Netherlands to Germany. It is likely that countries with a high nutrient surplus like Belgium and Denmark may export manure as well.
Crop production is available from reliable statistics for most of the significant crops cultivated except grassland. The harvest and grazing of grassland is estimated in some countries based on feed requirement models (for example the Netherlands), while in other countries expert judgements are used. As grassland production is estimated on average at 40 % of total N output in the EU-28 in 2010-2014, the estimation of grassland production determines to a large extent the outcome of the balance. It is necessary to develop a uniform European method to estimate grassland production to ensure reliable and consistent estimations and comparability across countries. Only the N uptake by crops and fodder harvested and crop residuals removed from the field are included in the output of the balance. For permanent crops a part of the N uptake is stored in the plant (which is not harvested) and is therefore not at risk to run-off, leaching or volatilization. This is not taken into account in the balance estimations. Some countries do not have coefficients (used to convert the production in nutrient content) available and reliability varies due to the method used (scientific research vs expert judgements). Verification and validation of these coefficients requires expert knowledge. A sufficient European structure to verify and validate these coefficients is missing. Improvements of the methodologies to calculate more reliable coefficients used in countries are therefore of great importance.
Data on seeds and planting material are not available in all countries. The quality of available data depends on the data sources and assumptions made, as well as the quality of coefficients. Available data show this input is less than 2 % of total nitrogen input.
Estimates of biological nitrogen fixation (BNF) are required for the leguminous crops and legume-grass mixtures. BNF is a considerable source of N input in many countries. Data received show the rates ranging from 0 % to 12 % in total N inputs. BNF of legume-grass mixtures may be even more relevant for countries which have a high share of grasslands in UAA.
For countries that didn’t provide data on BNF Eurostat estimated the input from BNF by leguminous crops by using the default estimation procedure in IPCC Guidelines described in the Eurostat/OECD Nutrient Budgets handbook. It is more difficult to establish the default estimates for BNF in legume-grass mixtures, as basic data on areas and productivity of these areas are not always available and are likely to vary significantly across countries. This means that there are still a lot of uncertainties about estimating the nitrogen fixation in grassland. However, a recent report of the research project Biological nitrogen fixation (BNF) by legume crops in Europe financed by the Commission’s research framework program 7 attempted to clarify it. The results of the attempt of the group of experts to derive the country-specific coefficients for temporary and permanent grassland may be a valuable source to be used for BNF estimation procedure in countries which don’t yet dispose of their own country specific data.
Rates on the atmospheric deposition have been obtained from most countries. Countries use different methodologies to estimate nitrogen deposition rates (models, measurements, expert judgements, scientific research, etc.). Data on national nitrogen deposition should be available in all countries since they are signatories to the UNECE LRTAP convention. Modelled data are also available from the European Monitoring and Evaluation Programme (EMEP) database. These figures are used by Eurostat to estimate the nutrient input by atmospheric deposition for all the missing countries.
Emissions: Following the last revision of the Eurostat/OECD Nutrient Budgets handbook the nutrient output by nitrogen emissions was also estimated. In this way it is possible to specify for nitrogen not only the total threat to the environment but also give insight in the aquatic risk and emissions separately. Countries provided data on NH3, NO2 and N2O emissions from manure management and from managed soils. Coherence with UNFCCC/UNECE has been checked. For missing countries Eurostat estimated the output with nitrogen emissions by using the data from national inventory submissions to UNECE-CLRTAP as reported in NFR 2015 and submissions to UNFCCC as reported in CRF 2015.
Reference area has a large impact on the final balance per hectare. After several discussions with countries and other stakeholders during the process of the last revision of the Nutrient Budgets handbook it was agreed to define the reference area as the total UAA. An important issue still remains unsolved. According to the GNB handbook the balance should in principle relate to the potential fertilised area, excluding very extensive unfertilised areas, to make comparisons useful and to identify the potential risks of agricultural production to the environment in respect to nutrient surplus and deficits. After numerous discussions with stakeholders it is still unclear how to deal with extensively managed areas, for instance the non-herbaceous rough grazing areas mostly in Mediterranean regions, or mountain meadows in some other countries. The balance is an average for a country (or region) which can have both extensive and intensive agriculture. When extensively or sparsely used rough grazing or mountain areas are included, results of the balance for the country or region may be diluted, although in parts of the region the nutrient use can be quite high. This is still an open issue to which a solution needs to be found.
Climatic conditions have a big impact on the balance through the impact on yield and therefore N output. Climate and weather conditions are beyond the control of the farmer. To dampen the effect of weather conditions on the balance the results presented in this factsheet with regards to the nutrient balance are presented not referring to a particular year but as an average for a certain period.
Context
The gross nitrogen balance lists nitrogen inputs to agricultural soils and nitrogen outputs removed from the soil. The main result from the gross nitrogen balance is the gross nitrogen surplus (GNS) which is calculated as the difference between total N inputs and total N outputs. The GNS can also be expressed in kg N per ha per year, by dividing the surplus by the reference area. The gross nitrogen balance provides insight into links between agricultural nitrogen use and losses of nitrogen to the environment. A persistent surplus indicates potential environmental problems, such as ammonia (NH3) emissions (contributes to acidification, eutrophication and atmospheric particulate pollution), nitrate leaching (resulting in pollution of drinking water and eutrophication of surface waters) or nitrous oxide emissions (a potent greenhouse gas). A persistent deficit indicates the risk of decline in soil fertility.
The gross nitrogen balance can only indicate the potential risk to the environment as the actual risk depends on many factors including climate conditions, soil type and soil characteristics, management practices such as drainage, tillage, irrigation etc.
Policy relevance and context
- Rural Development Programme (RDP): The Agri-Environmental Measures were introduced in 1992 under the MacSharry reform of the Glossary:Common agricultural policy (CAP)|CAP]], integrated as an obligatory measure within the Rural Development Regulation in 1999 (pillar two) in order to promote environmental friendly farm practices. The key objectives of these measures are to promote agricultural methods to protect the environment and maintain the countryside. The Member States develop their own agri-environment measures according to their environmental needs. Some measures are designed inter alia to reduce the use of inputs, to conserve valuable farmed habitats, and to introduce changes in land use for environmental purposes. These identified positive impacts contribute to biodiversity, landscape, water and soil resources. Nitrogen balances are required for the Rural Development Programme as part of the EU’s Common monitoring and evaluation framework (CMEF). The CMEF is laid down in a set of documents drawn up by the Commission and agreed with the Member States. These documents are put together in a handbook, which includes a series of evaluation guidelines and guidance sheets on the common indicators.
- The Water Framework Directive (WFD) (Directive 2000/60/EC) requires Member States to protect and restore the quality of their waters. Water management is based on natural geographical and hydrological formations: the river basins. It sets out a precise timetable for action to get all EU waters into good status. A good status is defined through several factors: biology, chemistry as well as morphology and quantity. Environmental quality standards are defined as the concentration of a particular pollutant or group of pollutants, sediment or biota, which should not be exceeded in order to protect the environment. In the legislative text of the Water Framework Directive, there is an indicative list of pollutants that contribute to eutrophication (in particular nitrates and phosphates). Measures applied under the Water Framework Directive affecting the use of nitrogen in agriculture relate to best environmental practices. They may include the reduction of nutrient application, the modification of cultivation techniques and the proper handling of fertilisers. Most measures suggested in this context are aimed at reducing the influx of nutrients, such as nitrogen and phosphorus to the groundwater as well as surface waters. The nitrogen balance surplus (every 6 years at level of water body catchment) is a commonly used indicator for identifying areas vulnerable to nutrient pollution in the WFD pressures and impacts analysis.
- The Nitrates Directive (ND) (Directive 1991/676/EEC), aims to reduce water pollution caused or induced by nitrates from agricultural sources and prevent further such pollution. The directive requires the Member States to monitor nitrate concentrations in surface water and groundwater, identify waters affected by pollution and waters which could be affected by pollution if no measures are taken and designate nitrate vulnerable zones, defined as all known areas of land which drain into the waters identified. For these vulnerable zones, action programmes containing measures to reduce and prevent nitrate pollution must be developed, implemented and revised every four years. The action programmes of Member States should contain rules relating to the limitation of the land application of fertilisers based on a balance between the foreseeable nitrogen requirements of the crops, and the nitrogen supply to the crops from the soil and fertilisation. These balances should be calculated at farm level every 4 years.
- The The 7th Environmental Action Programme encourages the full implementation of both the ND and WFD, in order to achieve levels of water quality that do not give rise to unacceptable impacts on, and risks to, human health and the environment.
Other policies which are indirectly linked to the gross nitrogen balance are:
- The main legislative instrument to achieve the 2030 objectives of the Clean Air Programme is Directive 2016/2284/EU on the reduction of national emissions of certain atmospheric pollutants which entered into force on 31 December 2016. This Directive sets national reduction commitments for the five pollutants (sulphur dioxide, nitrogen oxides, volatile organic compounds, ammonia and fine particulate matter) responsible for acidification, eutrophication and ground-level ozone pollution which leads to significant negative impacts on human health and the environment. More information is available here. This new Directive repeals and replaces the National Emissions Ceiling Directive (NEC Directive) (Directive 2001/81/EC) from the date of its transposition (30 June 2018) ensuring that the emission ceilings for 2010 set in that Directive shall apply until 2020. Directive 2016/2284/EU also transposes the reduction commitments for 2020 taken by the EU and its Member States under the revised Gothenburg Protocol and sets more ambitious reduction commitments for 2030 so as to cut the health impacts of air pollution by half compared with 2005.
- The Directive on Integrated Pollution Prevention and Control (IPPC) (Directive 2008/1/EC) introduces an integrated cross-media approach, aiming to prevent or minimise emissions to air, water and land, as well as to avoid waste production with a view to achieve a high level of environmental protection as a whole. The purpose of the IPPC Directive was to achieve integrated prevention and control of pollution arising from several categories of industrial activities. Among these are installations for the intensive rearing of poultry or pigs with more than 40 000 places for poultry, 2 000 places for production pigs (over 30 kg), or 750 places for sows. The indicative list of main polluting substances to be taken into account if they are relevant for fixing emission limit values includes oxides of nitrogen and substances which contribute to eutrophication (phosphates and nitrogen). The Commission has adopted a new Directive 2010/75/EU on industrial emissions (integrated pollution prevention and control) in 2010.
- Habitats Directive (Directive 1992/43/EEC) and Birds Directive (Directive 2009/147/EC): The main purpose of these Directives is to ensure biological diversity through the conservation of natural habitats and of wild flora and fauna within the European territory, while taking into account economic, social, cultural and regional requirements. Farmers who have agricultural land in Natura 2000 sites and face restrictions due to the requirements of the Habitats and Birds Directives are eligible to receive rural development payments for the management of these sites. Depending on the specific conditions of a certain area, Natura 2000 management plans may include measures to reduce the use of pesticides and fertilisers, measures to mitigate the effects of soil compaction, e.g. limitations on the use of machinery or the setting of stocking limits, or measures aiming to regulate the irrigation of agricultural land.
- United Nations Framework Convention on Climate Change (UNFCCC): the Kyoto Protocol is an international agreement linked to the United Nations Framework Convention on Climate Change. The major feature of the Kyoto Protocol is that it sets binding targets for 37 industrialized countries and the European community for reducing greenhouse gas (GHG) emissions. During the first commitment period, 37 industrialized countries and the European Community committed to reduce GHG emissions to an average of five percent against 1990 levels. During the second commitment period, Parties committed to reduce GHG emissions by at least 18 percent below 1990 levels in the eight-year period from 2013 to 2020. The major distinction between the Protocol and the Convention is that while the Convention encouraged industrialised countries to stabilize GHG emissions (CO2, CH4, N2O, PFCs, HFCs, SO2, NOx, CO and NMVOC), the Protocol commits them to do so. Reporting is done by the countries through the submission of annual emission inventories and national reports under the Protocol at regular intervals. Items to be reported under the protocol include mineral nitrogen fertilisers' application by agriculture, livestock excretion, emission factors etc. In December 2015 the parties of UNFCCC adopted the Paris Agreement (which entered into force in November 2016), aimed at limiting global warming to less than two degrees Celsius, and pursue efforts to limit the rise to 1.5 degrees Celsius.
- UNECE Convention on Long Range Transboundary Air Pollution: parallel to the development of the EU NEC Directive, the EU Member States together with Central and Eastern European countries, the United States and Canada have negotiated the "multi-pollutant" protocol under the so-called Gothenburg protocol, agreed in November 1999. The emission ceilings in the protocol are equal or less ambitious than those in the NEC Directive.
Agri-environmental context
The gross nitrogen balance indicates the total potential risk to the environment (air, water and soil). The output side of the balance presents the nutrient uptake by harvested (and grazed) crops and fodder and crop residues removed from the field; i.e. the agricultural production from the soil. The input side of the balance counts all nitrogen supplied to the soil. Sustainability could be defined by preserving and/or improving the level of production without degrading the natural resources. The harvest and grazing of crops and fodder means that nutrients are removed from the soil. To sustain soil fertility this removal of nutrients in principal should be compensated by supplying the same amount of nutrients. Fertilisers and manure are therefore necessary to supply the crops with the necessary nitrogen for growing. There are certain complications however; not all of nitrogen in fertilisers and manure reaches the crop. A part of the nitrogen in fertilisers and manure is lost due to volatilisation in animal housing, storage and with the application to the land. Organic nitrogen in manure first needs to be mineralized before it is available to the crop which means that part of the nitrogen may need different time-lag for being available to plant (depending on soil characteristics and climate conditions –temperature and precipitations). Yield and therefore the uptake of nitrogen by crops is not only determined by inputs but also by uncontrollable factors like weather. Furthermore, the risk of nitrogen leaching and run-off does not only depend on the nitrogen excess, but also on the type of soil, precipitation rates, soil saturation, temperature etc. Abating measures to reduce nitrogen emissions directly impact the amount of nitrogen in manure and fertilisers applied to the soil. A higher emission rate means lower nitrogen content of manure/fertilisers applied to the soil, but means a higher contribution to environmental problems related to GHG and NH3 emissions. Lowering the emission rate means increasing the rate of nitrogen in manure/fertilisers, and therefore increasing the potential risk of leaching and run-off.
The estimated nitrogen surplus on its own therefore does not tell so much on the actual risks to the air, water and soil. The actual risk depends on many factors including climate conditions, soil type and soil characteristics, soil saturation, management practices such as drainage, tillage, irrigation etc. The actual risks to the environment are better represented by the indicators AEI 18 - Ammonia emissions, AEI 19 - GHG emissions and AEI 27.1 - Water quality (nitrate pollution). These indicators however do not present a link between the agricultural activities and the environmental impact. The nitrogen balance presents a link between agricultural activities and the environmental impact; it identifies the factors which determine the nitrogen surplus and shows the change over time.
See also
- Agri-environmental indicators (online publication)
Further Eurostat information
Publications
- Agriculture, forestry and fishery statistics - 2016 edition
- Agriculture, fishery and forestry statistics - 2014 edition
- Environmental statistics and accounts in Europe - 2010 edition
- Food: from farm to fork statistics - 2011 edition
Database
- Pressures and risks (aei_pr)
- Gross Nutrient Balance (aei_pr_gnb)
- Pressures and risks (aei_pr)
Dedicated section
Methodology / Metadata
- Eurostat/OECD Nitrogen Budgets handbook
- Gross nutrient balance (aei_pr_gnb_esms)
Source data for tables and figures on this page (MS Excel)
Other information
- Commission Communication COM(2006)508 final - Development of agri-environmental indicators for monitoring the integration of environmental concerns into the common agricultural policy
- Agri-Environmental Indicators, see:
- Corresponding IRENA Fact sheet 18.1
External links
- European Commission - Agriculture and Rural Development
- European Commission – Environment
- European Commission – Climate Action
- OECD - Agri-environmental Indicators and Policies
- EU Nitrogen Expert Panel
- European Centre of the International Nitrogen Initiative
- European Nitrogen Assessment[6]
- Our Nutrient World][7]
- Too much of a good thing[8]
- United Nations Environment Programme (UNEP)
Notes
- ↑ Data source: Eurostat table apro_mt_lscatl Cattle population December survey and table apro_mt_lspig Pig population December survey
- ↑ Excretion coefficients used by CZ to estimate nitrogen manure production of livestock are constant over time, except for dairy cows where coefficients show an increasing trend. Manure withdrawals of CZ are estimated at 750-20 000 tonnes of N per year in 1990-2014 (industrial processing of slurry and use of manure for biogas production).
- ↑ For more information see: Statistics Netherlands - Mineral surplus in agriculture drops sharply
- ↑ Summer 2003 was exceptionally hot over most of central and western Europe, ranging from Spain to Hungary and from Iceland to Greece (Fink 2004, Schaer 2004). Summer 2007: sharp differences in weather conditions between the eastern (warmer and drier than average) and the western side (cooler and wetter) of Europe; a prolonged dry spell in central Mediterranean, Black Sea and Baltic areas; in contrast, abundant and persistent rain in central and northern EU areas, interfering with field activities and affecting crop yield (Bulletin pdf)
- ↑ EU Nitrogen Expert Panel (2015) Nitrogen Use Efficiency (NUE) - An indicator for the utilization of nitrogen in agriculture and food systems. Wageningen University, Alterra, PO Box 47, NL-6700 Wageningen, Netherlands.
- ↑ Mark A. Sutton, et al (eds). Nitrogen in Europe - The European Nitrogen Assessment, Cambridge, 2011
- ↑ Sutton M.A. et al. Our Nutrient World. The challenge to produce more food, energy with less pollution. Key Messages for Rio+20. Centre for Ecology; Hydrology, 2012.
- ↑ Mark A. Sutton, Oene Oenema, Jan Willem Erisman, Adrian Leip, Hans van Grinsven; Wilfried Winiwarter. Too much of a good thing. Nature, Volume: 472, Pages: 159–161, 2011
