Archive:Industry and construction statistics - short-term indicators
- Data from October 2013. Most recent data: Further Eurostat information, Main tables and Database.
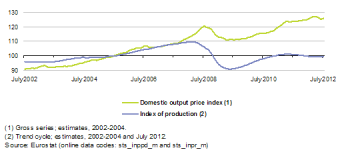
(excluding construction), EU-27, 2002-2012
(2005=100) - Source: Eurostat (sts_inppd_m) and (sts_inpr_m)
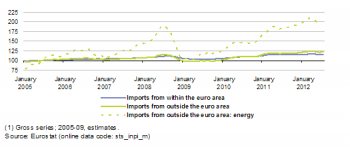
(2005=100) - Source: Eurostat (sts_inpi_m)
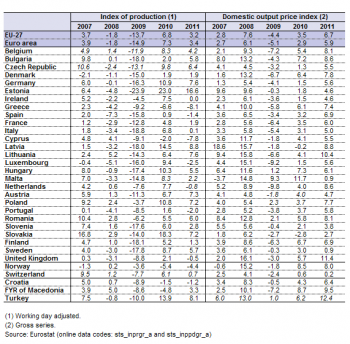
(excluding construction), 2007-2011
(%) - Source: Eurostat (sts_inprgr_a) and (sts_inppdgr_a)
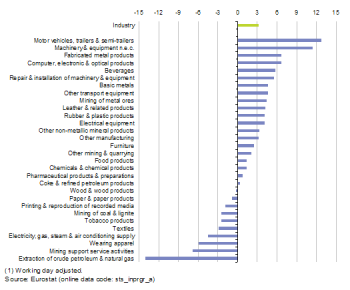
(%) - Source: Eurostat (sts_inprgr_a)
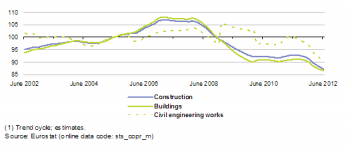
(2005=100) - Source: Eurostat (sts_copr_m)
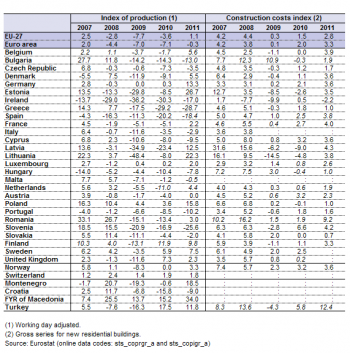
(%) - Source: Eurostat (sts_coprgr_a) and (sts_coprgr_a)
This article examines recent statistics in relation to developments for both industry and construction in the European Union (EU). Short-term business statistics (STS) are provided in the form of indices that allow the most rapid assessment of the economic climate within industry and construction, providing a first evaluation of recent developments for a range of activities. STS show developments over time, and so may be used to calculate rates of change, typically showing comparisons with the month or quarter before, or the same period of the previous year. As such, STS do not provide information on the level of activity, such as the monetary value of output (value added or turnover), or actual prices.
Main statistical findings
Industry
The impact of the financial and economic crisis and the subsequent inconsistent recovery of the EU-28’s industrial economy can be clearly seen in two of the main industrial indicators, namely the industrial production index and the index for industrial domestic output prices. Over several years there was relatively stable output and price growth across the EU-28 (see Figure 1), which was interrupted from the second half of 2007 as price growth accelerated, while industrial output slowed. The EU-28’s industrial production index saw its month-on-month rate of change turn negative in May 2008, while the index for domestic output prices peaked two months later in July 2008. The fall in output lasted one year, returning to a positive rate of change in May 2009, while domestic output prices reached their lowest level in July 2009 and started a run of relatively sustained increases from October 2009.
The decline in industrial output in the EU-28 from its relative peak in April 2008 was particularly steep (-19.6 %), as the relative trough recorded in April 2009 was the lowest level of output since September 1997. By contrast, although industrial output prices in July 2009 were 7.7 % lower than at their relative peak a year earlier, they remained in line with the price levels recorded between October and November 2007 prior to the financial and economic crisis; in part, price developments continued to reflect the relatively high price of crude oil and associated energy-related and intermediate products.
Incomplete recovery and subsequent inconsistent developments
Industrial output in the EU-28 recovered for just over two years from the low of April 2009, recording positive month-on-month rates of change for 19 out of 25 months to reach a peak in May 2011: this peak was 13.5 % above the April 2009 low but nevertheless 8.7 % below the pre-crisis peak. Thereafter, a more gradual decline in output was observed through until November 2012 during which time output contracted by 4.5 %; subsequently industrial output remained relatively stable through until July 2013 (latest data available at the time of writing).
By contrast, the return to positive rates of change for EU-28 industrial output prices in August 2009 heralded a more sustained and longer period of price growth. The industrial output price index passed its pre-crisis peak in February 2011 and continued an almost unbroken climb until April 2012 when it peaked some 14.0 % above the low recorded during the crisis and 5.2 % above the pre-crisis peak (nearly three years earlier). Between April 2012 and July 2013 (latest data available at the time of writing) the development of industrial output prices was quite irregular, with no clear trend.
Recent developments in the Member States and various industrial activities
The recovery in industrial activity was less widespread and regular than had been the preceding downturn. Whereas every EU Member State recorded lower output in 2009 than in 2008, three Member States — Greece, Croatia and Cyprus — recorded further reductions in 2010 while all the other Member States recorded an increase in output. In 2011, the same three Member States again recorded a fall in industrial output, joined by Spain, Luxembourg, the Netherlands, Portugal and the United Kingdom. By 2012, most of the EU-28 Member States had joined this group with a negative rate of change for industrial output, the exceptions being the three Baltic Member States, Malta, Austria, Poland, Romania and Slovakia (see Table 1).
Equally, the downturn in activity during the financial and economic crisis was spread across almost the full range of industrial activities: in 2009 there was just one industrial activity (at the NACE Rev. 2 division level) that reported continued growth within the EU-28, as the output of pharmaceutical products and preparations rose by 2.7 % compared with the year before. The recovery in 2010 was also relatively widespread: there were nine exceptions (among the 30 NACE Rev. 2 divisions covered by the index), where output continued to contract in 2010, most notably for the manufacture of tobacco products, with a loss of 5.4 %. The number of activities that recorded a fall in output stabilised at nine in 2011, with six of the nine activities that had contracted in 2010 continuing their downward path, while a further three activities followed expansion in 2010 with contraction in 2011. The inconsistent nature of the recovery can be seen from the fact that a majority of industrial activities recorded a fall in output in 2012 compared with 2011, 23 declining and just 7 expanding (see Figure 2).
Import prices
Industrial import prices for the euro area peaked in July 2008, regardless of whether imports were from outside the euro area or from other Member States within the euro area (see Figure 3). Thereafter, prices of imports from within the euro area fell over a nine-month period by a total of 8.0 %, whereas the prices of imports from outside the euro area fell by a total of 14.6 % over eight months. Since their low point in the spring of 2009, prices for imports from within the euro area increased by 13.1 % through to April 2012, since when they declined slightly (-2.1 %) through to July 2013 (latest available data at the time of writing). Starting from a similar low point (April 2009), import prices from outside the euro area increased by 23.8 % through to August 2012, before dropping back 4.4 % by July 2013. Prices for imports passed their pre-crisis highs (of July 2008) in January 2011 for imports from within the euro area and one month later (February 2011) for imports from outside of the euro area.
Construction
The downturn in activity for construction within the EU-28 lasted longer than for industry. Furthermore, after stabilising in 2010 and 2011, a second downturn started in the first quarter of 2012: at the time of writing this has not shown clear signs of stabilising, although the three month-on-month positive rates of change recorded in April, May and June 2013 were the first three consecutive positive rates of change since October 2010.
Construction output in the EU-28 peaked in February 2008, after which substantial falls in construction activity were recorded, reaching a low in February 2010, two years after the initial downturn. Between February 2008 and February 2010 the index of production for construction in the EU-28 fell by 18.9 % overall, deteriorating to a level not seen since February 1999. From this low point at the beginning of 2010, construction output remained relatively stable (apart from a notable upward spike in output in June 2010 and downward spike in December of the same year) over the next two years to the beginning of 2012. In February 2012, the second downturn in construction output started and by March 2013 output had fallen a further 8.8 % from its January 2012 level.
The construction of buildings is the dominant part of construction output, and unsurprisingly output for building work followed a similar path to the overall indicator for construction, although the magnitude of the contraction from the beginning of 2008 to the beginning of 2010 was slightly greater, totalling 20.0 % in the EU-28 (see Figure 4). For civil engineering the developments were less clear cut. From February to December 2008, civil engineering output in the EU-28 fell in a similar manner to the developments seen for building output. However, there followed a substantial increase in January 2009, mainly due to a massive expansion in civil engineering work in Spain. Civil engineering output then resumed its downward path through much of 2009, before contracting rapidly between January and February 2010 after which it was relatively unchanged until a sharp fall at the end of 2010. A short recovery in civil engineering output in most of the first five months of 2011 was followed by a return to a downward path in line with that observed for construction as a whole.
By March 2013 building output in the EU-28 was25.1 % lower than it had been in February 2008 while for civil engineering it was 23.7 % lower. Both building and civil engineering contributed to the three consecutive positive rates of change observed for construction between March and June 2013.
The long and deep downturn in construction activity was widespread within the EU-28, illustrated by the fact that every Member State experienced at least one year of contraction in construction output during the five latest years (2008 to 2012) for which data are available. In 2008 a total of 14 EU Member States recorded a contraction in construction output and this number rose to 24 in 2009, before dropping back to 23 in 2010 and 13 in 2011. The latest annual figures show that a large majority (23) of the EU Member States reported a decrease in construction output in 2012.
The Czech Republic and Italy recorded negative rates of change in relation to their construction activity in all five years (2008 to 2012); while the ongoing downturn has been even longer in Ireland and Spain where six consecutive negative annual rates of change were recorded (from 2007 to 2012), while in Hungary the sequence of negative rates grew to seven years (2006 to 2012), and in Portugal the last positive annual rate of change was recorded in 2001. By 2012, construction output was less than half the level it had been in 2007 in Slovenia, Spain, Greece and Ireland. Construction output declined by 10 % or more in Croatia, Slovakia, Italy, Slovenia and Portugal in 2012, and by 20 % or more in Cyprus and Greece. By contrast, Estonia and Latvia reported an increase in construction output above 10 % in 2012, while Sweden, Austria and Romania were the only other EU Member States to report any increase.
Data sources and availability
Short-term business statistics (STS) are compiled within the scope of the STS Regulation 1165/98 of 19 May 1998 concerning short-term statistics. The STS Regulation brought major changes and improvements in the availability and timeliness of indicators following its implementation. The STS Regulation has been amended and adjusted to meet emerging users’ needs — generally in relation to monetary union and more specifically to the requirements of the European Central Bank (ECB).
Indicators common to industry and construction include the production index and labour input indicators concerning employment, wages and salaries, and hours worked. For industry there are additional STS indicators concerning turnover and output prices, which are compiled as a total and also distinguishing between domestic and non-domestic markets, with a further analysis of non-domestic markets between euro area and non-euro area markets. In a similar manner, there are industrial import prices, with a distinction between imports from euro area and non-euro area markets. For construction activities there is a distinction in the production index between building and civil engineering, while additional indicators are collected on building permits, as well as construction cost and price indices.
The presentation of short-term statistics may take a variety of different forms. Gross or unadjusted indices are the basic form of an index. Working-day adjustment takes into account the calendar nature of a given month in order to adjust the index. The number of working days for a given month depends on: the timing of certain public holidays (Easter can fall in March or in April depending on the year); the possible overlap of certain public holidays and non-working days (1 May can fall on a Sunday); whether or not a year is a leap year, and other reasons. Seasonal adjustment aims, after adjusting for calendar effects, to take into account the impact of known seasonal factors that have been observed in the past. For example, in the case of the production index, annual summer holidays have a negative impact on industrial production.
Depending on the indicator in question, the EU Member States are required to transmit unadjusted or adjusted data to Eurostat. In the case that Member States transmit unadjusted data, then Eurostat calculates the seasonal adjustment. The Member States’ national statistical authorities are responsible for data collection and the calculation of national time series. Eurostat is responsible for the EU and euro area aggregations.
NACE Rev. 2 is the latest version of the statistical classification of economic activities and has been implemented in STS during 2009. This involved not just changing data compilation practices to use NACE Rev. 2 but also recalculating or estimating a time series in NACE Rev. 2, normally back to the year 2000. Simultaneously with the introduction of NACE Rev. 2, a new base year (2005) was adopted for STS indices to reflect better the economic structure; this in turn was replaced during 2013 with the base year of 2010, once more updating the system of weights in order to accommodate changes in the economic structure. The data in this article are therefore presented using NACE Rev. 2 as indices with 2010 = 100 and using weights from 2010 — see the article on the 2010 rebasing exercise for more information.
Context
The profile and use of STS is expanding rapidly, as information flows have become global and the latest news release for an indicator may have significant effects on financial markets, or decisions that are taken by central banks and business leaders. STS are a key resource for those who follow developments in the business cycle, or for those who wish to trace recent developments within a particular industry, construction or service.
Some of the most important STS indicators are a set of principal European economic indicators (PEEIs) that are essential to the ECB for conducting monetary policy within the euro area. Three PEEIs concern industrial short-term business statistics: production, output prices of the domestic market and import prices. A further two PEEIs concern construction short-term business statistics: production and building permits.
Further Eurostat information
Publications
Main tables
- Industry (t_sts_ind)
- Production in industry (t_sts_ind_prod)
- Turnover in industry (t_sts_ind_tovt)
- Producer prices in industry (PPI) (t_sts_ind_pric)
- Import prices in industry (t_sts_ind_impi)
- Labour input in industry (t_sts_ind_labo)
- Construction, building and civil engineering (NACE F) (t_sts_cons)
- Production in construction (teiis500)
- Construction cost of new residential buildings (teiis510)
- Labour input in construction (teiis520)
- Building permits - quarterly data (tin00208)
- Building permits - monthly data (teiis550)
Database
- Industry (NACE Rev.2) (sts_ind)
- Production in industry (sts_ind_prod)
- Turnover in industry (NACE Rev.2) (sts_ind_tovt)
- Producer prices in industry (NACE Rev. 2) (sts_ind_pric)
- Import prices in industry (NACE Rev. 2) (sts_ind_impi)
- Labour input in industry (NACE Rev.2) (sts_ind_labo)
- Construction, building and civil engineering (sts_cons)
- Production in construction (NACE Rev.2) (sts_cons_pro)
- Labour input in construction (NACE Rev.2) (sts_cons_lab)
- Construction cost (or producer prices), new residential buildings (sts_cons_pri)
- Building permits (sts_cons_per)
Dedicated section
Methodology / Metadata
- Methodology of short-term business statistics – interpretation and guidelines
- Methodology of short-term business statistics – associated documents
- Short-term business statistics (ESMS metadata file - sts_esms)
Source data for tables and figures (MS Excel)
External links
- European Central Bank - National accounts and output indicators
- European Commission - Economic and Financial Affairs - Industry-level growth accounting
- European Commission – Enterprise and Industry, see:
See also
Construction
- Construction cost index overview
- Construction permit index overview
- Construction producer price index overview
- Construction production (volume) index overview
Industry
- Industrial import price index overview
- Industrial producer price index overview
- Industrial production (volume) index overview
- Industrial turnover index overview
Short-term business statistics