- Data extracted in September 2018. Most recent data: Further Eurostat information, Main tables and Database. Planned article update: September 2019
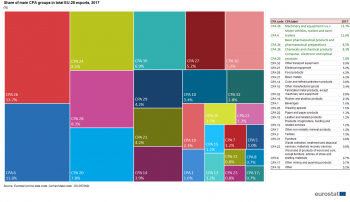
This article focuses on the most significant goods by value (according to the CPA classification) in extra-EU exports. It presents statistics for the EU-28 from 2013 to 2017. Statistics on goods traded between the EU and the world — especially the size and evolution of exports — enable the EU and national authorities to evaluate the health and competitiveness of EU industries.
This article is part of an online publication providing recent statistics on international trade in goods, covering information on the EU's main partners, main products traded, specific characteristics of trade as well as background information.
Main statistical findings
Evolution of extra-EU exports
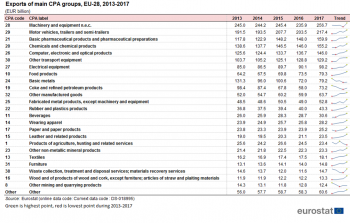
Between 1994 and 2004 extra-EU exports almost doubled from EUR 517 billion to EUR 1019, equivalent to an average annual growth rate of 7.0 %. Growth was a little slower between 2004 and 2006 (5.8 %) and between 2006 and 2012 (6.2 %). Since then growth rates even fell further, between 2012 and 2013 the rate was 2.7 % and between 2013 and 2016 0.1 %. One should take into account that the composition of the EU changed considerably, especially in the earlier periods. Similar growth rates applied to the top 5 most exported products which had a share in total extra-EU exports of between 49 % and 54 % during this whole period.
The 5 most significant products in extra-EU exports
There has been a degree of consistency in the top 5 products in extra-EU exports in terms of value. Four of them appear during the whole period. These are ‘Machinery and equipment’, ‘Motor vehicles, trailers and semi-trailers’ , ‘Chemicals and chemical products’ and ‘Computer, electronic and optical products’. ‘Basic pharmaceutical products’ appear in four of the six years shown and was replaced by ‘Other transport equipment‘ in 1994 and by ‘Basic metals‘ in 2013 but reappeared in 2016. (see Table 1)
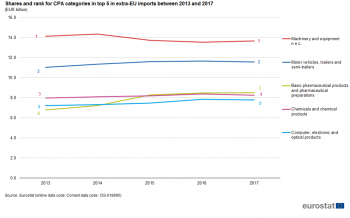
‘Machinery and equipment’ held the first place in all years shown. ‘Motor vehicles, trailers and semi-trailers’ started out as third but reached 2nd in 2012 where it stayed. ‘Computer, electronic and optical products’ started as 4th in 1994, rose to 2nd in 2004 and 2006 but then fell back to 4th in 2012 and 5th in 2013 and 2016. ‘Chemicals and chemical products’ was 2nd in 1994, dropped to 4th in 2004 and 2006 climbed to 3rd in 2012 and 2013 but had to settle for 4th in 2016. ‘Basic pharmaceutical products’ which had been 5th in 2004, 2006 and 2012,dropped out of the top 5 in 2013 but reappeared as 3rd in 2016.
Figure 2 shows the top 5 products of 2016 over the whole period. Between 1994 and 2004 the largest growth was found in ‘Computer, electronic and optical products’. After 2004 export values of ‘Computer, electronic and optical products’ did not grow much and were overtaken by ‘Motor vehicles, trailers and semi-trailers’ and ‘Chemicals and chemical products’ in 2012 and by ‘Basic pharmaceutical products’ in 2016.
Figure 3 adds 'Other' to the top 5 products thus showing the total value of exports. Three of the five products as well at 'Other' had an average annual growth between 4.8 % and 5.2 % between 1994 and 2016. Motor vehicles grow slightly more by 6.7 %. It is in 'Basic pharmaceutical products' we find the highest growth of more than 10.3 %. Overall average annual growth of exports was 5.5 %.
Most traded goods in Extra-EU exports by Member State
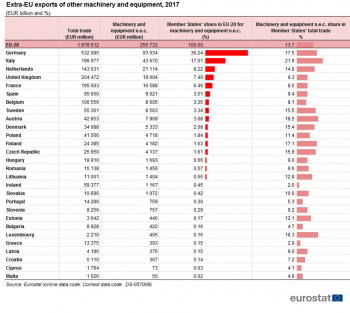
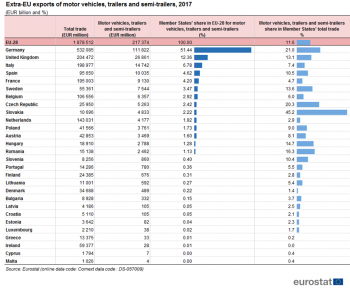
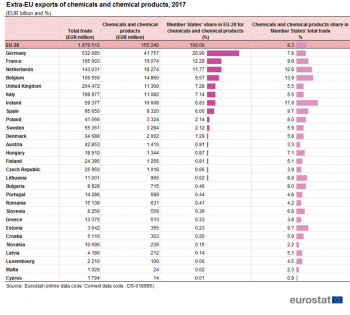
The analysis in this section looks at extra-EU exports by individual EU Member State. Table 2 shows that in 1994, Germany was the leading EU exporter with the highest extra-EU exports in each of the 5 most significant products (‘Machinery and equipment’ (EUR 37 billion), ‘Motor vehicles, trailers and semi-trailers’ (EUR 26 billion), ‘Basic pharmaceutical products’ (EUR 5 billion), ‘Chemicals and chemical products’ (EUR 18 billion) and ‘Computer, electronic and optical products’ (EUR 16 billion). The 2nd to 4th position in each of these products were almost always held by Italy, the United Kingdom and France albeit in order. Only in ‘Chemicals and chemical products’ the Netherlands appears in the top 4, replacing Italy.
In 1995 Austria, Finland and Sweden joined the EU. In 2004 their combined shares were lower than 10 % for all five product groups and consequently they did not appear among the top four exporters for these goods. Germany remained in the first spot for all five. The largest increase in exports between 1994 and 2004 was in 'Basic pharmaceutical products' which more than tripled its exports from EUR 27 billion to EUR 92 billion owing to large growth in Germany (+ EUR 18 billion), the United Kingdom (+ EUR 14 billion) and Belgium and France (both + EUR 13 billion)
In 2004, ten countries (Czech Republic, Estonia, Cyprus, Latvia, Lithuania, Hungary, Malta, Poland, Slovenia and Slovakia) joined the EU. In Two years later, their combined exports in the five product categories ranged from 6.0 % in ‘Chemicals and chemical products’ to 8.7 % in ‘Machinery and equipment’. Between 2004 and 2006 exports of 'Motor vehicles' dropped slightly while the other four product group all grew. The highest increase in exports was in 'Computer, electronic and optical products' (+ EUR 42 billion) which was in large part due to the ten new Member States whose exports were EUR 33 billion combined. The Netherlands (+ EUR 10 billion) and Germany (+ EUR 5 billion) also grew substantially whereas France, Italy and Austria (each - 2 EUR billion) and Greece (- 0.3 billion) exported less than in 2004.
In 2007, Bulgaria and Romania entered the EU. In 2012, except for Romania's share of 1.2 % in exports of ‘Motor vehicles, trailers and semi-trailers’ their contributions for the five most exported products were below 1%. The highest increase in exports was found in 'Machinery and equipment' which grew by EUR 105 billion. With the exception of Ireland, Greece and Malta all countries contributed to this growth. The largest growth was found in Germany (+EUR 40 billion) followed at some distance by Italy (+ EUR 11 billion) and the Netherlands (+ EUR 12 billion).
There was only one new Member State, Croatia in 2013 with shares below 0.5 % in all five product groups. Although total exports remained stable in this year there were decreases in three of the five product groups shown. The largest decrease was found in 'Computer, electronic and optical products' (- EUR 15 billion). Only five Member States managed to increase their exports. These were Austria (+ EUR 1 billion), Latvia (+ EUR 72 million), Lithuania (+ EUR 25 million), Slovenia (+ EUR 9 million) and Cyprus (+ EUR 1 million). The largest decreases in exports were found in Germany and the Netherlands (both - EUR 3 billion).
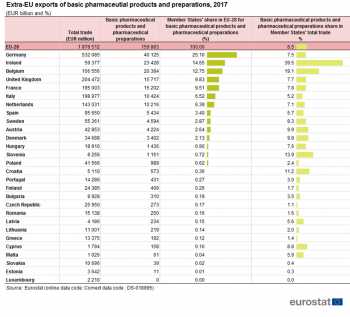
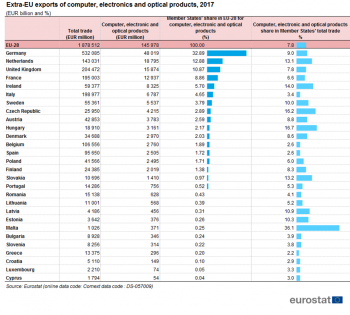
Between 2013 and 2016 the composition of the EU remained unchanged. In this period total EU exports but grew for all five product groups, most notably in ’Basic pharmaceuticals’ which grew by EUR 49 billion. Germany, (+ EUR 14 billion) and Ireland (+ EUR 10 billion) contributed most to this growth. 'Computer, electronic and optical products' also grew strongly, gaining EUR 46 billion. Here too Germany (+ 16 billion) now accompanied by the Netherlands (+ EUR 12 billion) contributed most to the growth.
Source data for tables and graphs
Data sources and availability
EU data comes from Eurostat’s COMEXT database.
COMEXT is the Eurostat reference database for international trade in goods. It provides access not only to both recent and historical data from the EU Member States but also to statistics of a significant number of non-EU countries. International trade aggregated and detailed statistics disseminated from Eurostat website are compiled from COMEXT data according to a monthly process. Because COMEXT is updated on a daily basis, data published on the website may differ from data stored in COMEXT in case of recent revisions.
European statistics on international trade in goods are compiled according to the EU concepts and definitions and may, therefore, differ from national data published by Member States.
Product classification
Classification of products by activity (CPA) is a statistical classification of products and services obligatory for all EU Member States. CPA classifies products by activity in which they are produced. Products are transportable goods and services. The CPA is a product classification whose elements are related to activities as defined by NACE Rev. 2. Each product - whether it be a transportable or a non-transportable good or a service - is assigned to one single NACE Rev. 2 activity. The linkage to activities as defined by NACE Rev. 2 gives the CPA a structure parallel to that of NACE Rev. 2 at all levels distinguished by NACE Rev. 2.
Unit of measure
Trade values are expressed in millions (106) of euros. They correspond to the statistical value, i.e. to the amount which would be invoiced in case of sale or purchase at the national border of the reporting country. It is called a FOB value (free on board) for exports and a CIF value (cost, insurance, freight) for imports.
Context
Europe is the world's largest exporter of manufactured goods and services, and is itself the biggest export market for around 80 countries. Trade is an important indicator of Europe's prosperity and place in the world, and the bloc has become deeply integrated into global markets both for the products it sources and the exports it sells.
Because the 28 Member States of the European Union share a single market and a single external border, they also have a single trade policy. Both in the World Trade Organization, where the rules of international trade are agreed and enforced, and with individual trading partners, EU Member States speak and negotiate collectively.
See also
Further Eurostat information
Data visualisation
- Did you know? Some funny and curious facts about trade of the EU
- Top 5 partners in trade in goods
- My Country in a bubble
Main tables
- International trade in goods - long-term indicators (t_ext_go_lti)
- International trade of machinery and transport equipment (SITC 7), by declaring country (tet00009)
- Extra-EU28 trade of machinery and transport equipment (SITC 7), by Member State (tet00059)
- Extra-EU28 trade of machinery and transport equipment (SITC 7), by main partners (tet00030)
- International trade in goods - short-term indicators (t_ext_go_sti)
- Imports of goods - machinery and transport equipment (teiet170)
- Exports of goods - machinery and transport equipment (teiet070)
Database
- International trade in goods - aggregated data (ext_go_agg)
- International trade in goods - detailed data (detail)
Dedicated section
Methodology / Metadata
- International trade in goods statistics - background
- International trade in goods (ESMS metadata file — ext_go_esms)
- User guide on European statistics on international trade in goods
Source data for tables, figures and maps (MS Excel)
Other information — Legal background
- Regulation (EC) No 471/2009 of 6 May 2009 on Community statistics relating to external trade with non-member countries
- Regulation (EU) No 92/2010 of 2 February 2010 implementing Regulation (EC) No 471/2009, as regards data exchange between customs authorities and national statistical authorities, compilation of statistics and quality assessment
- Regulation (EU) No 113/2010 of 9 February 2010 implementing Regulation (EC) No 471/2009 , as regards trade coverage, definition of the data, compilation of statistics on trade by business characteristics and by invoicing currency, and specific goods or movements.
External links
Notes
[[Category:<subtheme category name(s)>|Name of the statistical article]] [[Category:<statistical article>|Name of the statistical article]]

