Archive:Enlargement countries - environment statistics
- Data extracted in September 2015. Most recent data: Further Eurostat information, Main tables and Database. Planned article update: October 2016.
This article is part of an online publication and provides information on a range of statistics related to the environment for the enlargement countries, in other words the candidate countries and potential candidates. Montenegro, the former Yugoslav Republic of Macedonia, Albania, Serbia and Turkey currently have candidate country status, while Bosnia and Herzegovina and Kosovo [1] are potential candidates.
This article provides some information in relation to climate change, waste and water, presenting indicators such as the level of greenhouse gas emissions, municipal waste collected and treated, and water abstraction.
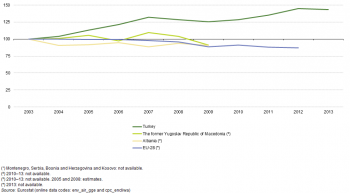
(2003 = 100; based on CO2 equivalents)
Source: Eurostat (env_air_gge) and (cpc_encliwa)
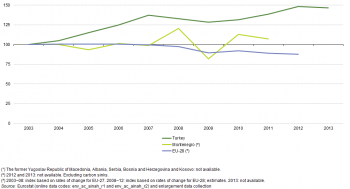
(2003 = 100)
Source: Eurostat (env_ac_ainah_r1) and (env_ac_ainah_r2) and enlargement data collection
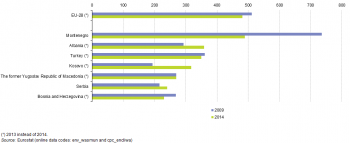
(kilograms per inhabitant)
Source: Eurostat (env_wasmun) and (cpc_encliwa)

(kilograms per inhabitant)
Source: Eurostat (env_wasmun) and (cpc_encliwa)

(%)
Source: Eurostat (env_wasmun) and (cpc_encliwa)Source: Eurostat enlargement data collection
(%)
Source: Eurostat (env_wasmun) and (cpc_encliwa)Source: Eurostat enlargement data collection
(%)
Source: Eurostat (env_wasmun) and (cpc_encliwa)Source: Eurostat enlargement data collection
Main statistical findings
Greenhouse gas and carbon dioxide emissions
The gases considered in this article as greenhouse gases are carbon dioxide (CO2), nitrous oxide (N2O), methane (CH4), hydrofluorocarbons (HFCs), perfluorocarbons (PFCs) and sulphur hexafluoride (SF6). The indicator in Figure 1 shows the combined trend in emissions of these gases. The basic data are annual emissions estimated and reported according to the Intergovernmental Panel on Climate Change (IPCC) guidelines.
The index for the EU-28 was relatively stable through until 2006, with progressively larger falls in 2007, 2008 and 2009, in large part related to the global financial and economic crisis and the associated reduction in levels of industrial activity. In 2010, greenhouse gas emissions picked up again, reflecting a rebound in economic activity, but in 2011 and 2012 the quantity of greenhouse gas emissions continued its downward trend; by 2012, the index was 13.0 % lower than it had been in 2003. The time series for Turkey shows an increase in greenhouse gas emissions through to 2007, which also fell in 2008 and 2009 during the crisis, before increasing again through to 2012; the value for 2013 shows a slight fall compared with the previous year, but an overall increase of 43.6 % compared with 2003. The time series for Albania and the former Yugoslav Republic of Macedonia are shorter, running until 2009. These both show a relatively stable development, with greenhouse gas emissions about 9 % lower in 2009 than in 2003.
Carbon dioxide is one of the greenhouse gases: while it has the lowest global warming potential of the six greenhouse gases, emissions of this gas in the EU-28 were considerably higher than for any of the other greenhouse gases such that, even when adjusted for global warming potential, emissions of carbon dioxide were far greater than for any of the other greenhouse gases. As a consequence, the developments shown in Figure 2 for the EU-28 and Turkey reflect greatly those seen in Figure 1. For Montenegro, emissions of carbon dioxide were relatively stable from 2003 until 2007, after which their development became more volatile, with a sharp increase in 2008 followed by an even sharper decrease coinciding with the crisis and a strong rebound in 2010.
Municipal waste
Municipal waste is mainly produced by households, though similar wastes from sources such as commerce, offices and public institutions are included; waste from agriculture and from industry is not included. The amount of municipal waste generated consists of waste collected by or on behalf of municipal authorities and disposed of through the waste management system. For areas not covered by a municipal waste collection scheme the reporting countries estimate the amount of waste generated.
In 2013, the average amount of municipal waste collected per inhabitant in the EU-28 was 481 kilograms (kg), in other words, just under half a tonne. This represented a fall of about 30 kg since 2009. Among the enlargement countries, the average quantity of municipal waste (data for 2013 or 2014) ranged from 230 kg per inhabitant in Bosnia and Herzegovina to 359 kg per inhabitant in Albania, with Montenegro (489 kg per inhabitant) above this range and also just above the EU-28 average — see Figure 3. Between 2009 and 2013 or 2014, the quantity of municipal waste collected per inhabitant increased in Serbia, Albania and most notably in Kosovo.
Waste can be treated in a number of ways, most notably by landfill, incineration (with or without energy recovery) and recovery (for example, material recycling and composting). For the enlargement countries data are collected for two types of treatment, landfill and incineration and in practice landfill is the dominant form of treatment as can be seen from Table 1. In the EU-28, around one third (30.6 %) of collected waste was destined for landfill in 2013, and around one quarter (25.4 %) for incineration.
The proportion of households from which household waste is regularly collected by or on behalf of municipal authorities was quite similar across the enlargement countries (data for 2013 or 2014), ranging from 73 % in the former Yugoslav Republic of Macedonia to 83 % in Turkey. In most of the enlargement countries, the proportion of households from which waste was regularly collected remained relatively stable compared with 2009, the one exception being Serbia where a large increase was observed — see Figure 4.
Water and wastewater
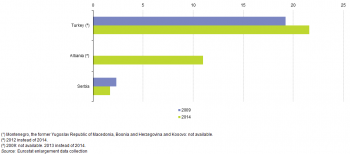
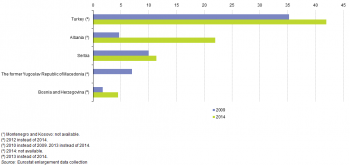
Freshwater abstraction as a percentage of available resources (as shown in Figure 5) is based on the resources available over the long term, a minimum of 20 years. For the three candidate countries for which data are available, their ratios ranged from just 1.7 % in Serbia in 2014 to 21.6 % in Turkey in 2012, with Albania (2013 data) midway between the two. Between 2009 and 2012, Turkey recorded a relatively large increase in the relative importance of freshwater abstraction, as its share of available resources rose by 2.3 percentage points; in contrast, Serbia recorded a fall of 0.6 percentage points between 2009 and 2014.
In each of the five enlargement countries shown in Figure 6 the proportion of the population connected to urban wastewater treatment systems (with at least secondary treatment) was relatively low, only above one quarter in Turkey (42 %) in 2012. However, these shares were increasing, most notably in Albania where the share of the population connected to urban wastewater treatment systems rose more than fourfold, up from 5 % in 2010 to 22 % by 2013.
Data sources and availability
Data for the enlargement countries are collected for a wide range of indicators each year through a questionnaire that is sent by Eurostat to partner countries which have either the status of being candidate countries or potential candidates. A network of contacts in each country has been established for updating these questionnaires, generally within the national statistical offices, but potentially including representatives of other data-producing organisations (for example, central banks or government ministries). The statistics shown in this article are made available free-of-charge on Eurostat’s website, together with other socio-economic indicators collected as part of this initiative.
Eurostat, in close partnership with the European Environment Agency (EEA), provides environmental statistics, accounts and indicators supporting the development, implementation, monitoring and evaluation of the EU’s environmental policies, strategies and initiatives. Data on greenhouse gas emissions as reported under the United Nations framework convention on climate change (UNFCCC) are collected by the EEA. Eurostat collects official statistics in relation to a broad selection of subject areas, for example, waste, water, material flows and environmental protection expenditure.
The Kyoto Protocol, an environmental agreement adopted by many of the parties to the UNFCCC in 1997 to curb global warming, covers six greenhouse gases: carbon dioxide (CO2), methane (CH4) and nitrous oxide (N2O), which are non-fluorinated gases, and hydrofluorocarbons (HFCs), perfluorocarbons (PFCs) and sulphur hexafluoride (SF6), which are fluorinated gases. Converting them to carbon dioxide equivalents makes it possible to compare them and to determine their individual and total contributions to global warming.
Eurostat’s data on waste is collected from EU Member States on the basis of a Regulation on waste statistics (2150/2002/EC) and is published every two years in line with common methodological recommendations. Landfill is the deposit of waste into or onto land. It includes specially engineered landfill sites and temporary storage of over one year on permanent sites. The definition covers both landfill in internal sites, in other words, where a generator of waste is carrying out its own waste disposal at the place of generation, and in external sites.
Tables in this article use the following notation:
| Value in italics | data value is forecasted, provisional or estimated and is therefore likely to change; |
| : | not available, confidential or unreliable value. |
| – | not applicable. |
Context
The key objectives of the EU’s environmental policy are:
- to protect, conserve and enhance the EU’s natural capital;
- to turn the EU into a resource-efficient, green, and competitive low-carbon economy;
- to safeguard the EU's citizens from environment-related pressures and risks to health and well-being.
The Europe 2020 strategy for smart, sustainable and inclusive growth was adopted in 2010. One of its flagship initiatives concerns resource-efficient Europe, while there are three specific targets related to the environment and climate change to be achieved by 2020, namely:
- greenhouse gas emissions should fall 20 % lower than they were in 1990;
- 20 % of the energy used in the EU should be from renewables; and
- there should be a 20 % increase in energy efficiency.
Environment action programmes have guided the development of the EU’s environment policy since the early 1970s. The current EU environment action programme — referred to as the 7th EAP — was adopted by Decision 1386/2013 of the European Parliament and Council in November 2013 under the title ‘Living well, within the limits of our planet’.
While basic principles and institutional frameworks for producing statistics are already in place, the enlargement countries are expected to increase progressively the volume and quality of their data and to transmit these data to Eurostat in the context of the EU accession process. The EU standards in the field of statistics require the existence of a statistical infrastructure based on principles such as professional independence, impartiality, relevance, confidentiality of individual data and easy access to official statistics; they cover methodology, classifications and standards for production.
Eurostat has the responsibility to ensure that statistical production of the enlargement countries complies with the EU acquis in the field of statistics. To do so, Eurostat supports the national statistical offices and other producers of official statistics through a range of initiatives, such as pilot surveys, training courses, traineeships, study visits, workshops and seminars, and participation in meetings within the European statistical system (ESS). The ultimate goal is the provision of harmonised, high-quality data that conforms to European and international standards.
Additional information on statistical cooperation with the enlargement countries is provided here.
See also
- Enlargement countries — statistical overview — online publication
- Statistical cooperation — online publication
- All articles on environment
- Greenhouse gas emission statistics
- Municipal waste statistics
Further Eurostat information
Publications
- Key figures on the enlargement countries — 2014 edition
- Energy, transport and environment indicators — 2014 edition
Database
- Candidate countries and potential candidates (cpc)
- Environment and energy (cpc_en)
- Candidate countries and potential candidates: climate change and waste (cpc_enclimwa)
- Environment and energy (cpc_en)
- Greenhouse gas emissions (source: EEA) (env_air_gge)
- Air emissions accounts by industry and households (NACE Rev. 2) (env_ac_ainah_r2)
- Air emissions accounts by industry and households (NACE Rev. 1.1) (env_ac_ainah_r1)
- Waste (env_was), see:
- Waste streams (env_wasst)
- Municipal waste (env_wasmun)
Dedicated section
Methodology / Metadata
- Candidate countries and potential candidates (cpc) (ESMS metadata file — cpc_esms)
- Statistics on greenhouse gas emissions (ESMS metadata file — env_air_gge)
- Air emissions accounts by industry and households (NACE Rev. 2) (ESMS metadata file — env_ac_ainah_r2)
- Municipal waste (ESMS metadata file — env_wasmun)
Source data for tables and figures (MS Excel)
External links
- European Commission — Enlargement
- European Commission — Environment
- European Commission — Waste
- European Commission — Energy union and climate
- European Commission — Climate action
Notes
- ↑ This designation is without prejudice to positions on status, and is in line with UNSCR 1244 and the ICJ Opinion on the Kosovo Declaration of Independence.
[[Category:<Subtheme category name(s)>|Name of the statistical article]] [[Category:<Statistical article>|Name of the statistical article]]