Archive:Meat production statistics
- Data from November 2014. Most recent data: Further Eurostat information, Main tables and Database. Planned article update: (dd) Month YYYY(, hh:00).
This publication gives an overview of European meat production , according to the data provided to Eurostat by the Member States EU-28 in compliance with Regulation (EU) No1165/2008 concerning livestock and meat statistics. Data on livestock population categories are gathered from all EU Member States through a livestock survey conducted at least once a year (see Data sources and availability).
Source: Eurostat (apro_mt_lscatl), (apro_mt_lspig), (apro_mt_lssheep) and (apro_mt_lsgoat)
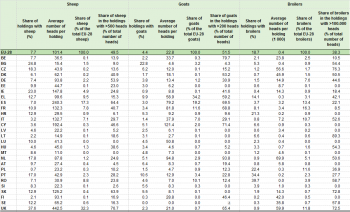
Source: Eurostat (ef_olslsuft) and (ef_olslsureg)
Main statistical findings
Since the decoupling of subsidies in 2003, following the mid-term review of the Common Agricultural Policy (CAP), the total numbers of livestock have decreased for the various species.
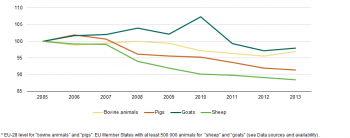
Between 2005 and 2013, there was a drop in total livestock (Figure 1). This trend continued until 2013 for pigs and sheep. However, the herds of bovine animals (+1.5 %) and goats (+0.9 %) stopped decreasing in 2013, which might indicate a slight recovery for cattle meat.
Sheep livestock showed the most pronounced fall (-11.6 %) for the 14 Member States[1] with more than 500 000 sheep, followed by live pigs (-8.6 %) for the EU-28. Cattle has fallen (-3 %) as well as goats (-2 %) for the five Member States[2] with more than 500 000 goats.
Greening of agricultural systems was one of the objectives pursued under the latest reform of the common agricultural policy. Livestock farmers are therefore required to adapt their farming systems if they wish to preserve their income and offer products geared to market need and to society’s demand for environmentally friendly farming practices.
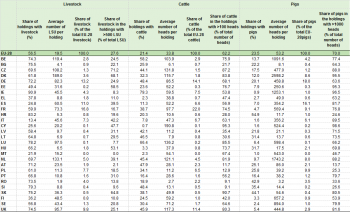
According to the Farm Structure Survey (FSS), in 2010 nearly seven million holdings (6.92 million) reared livestock, representing 56.5 % of EU-28 farms. As a proportion of all farms, 23.5 % had pigs, 21.4 % had bovine animals (cattle, buffaloes, etc.), 18.7 % had broilers, 7.7 % had sheep and 4.4 % had goats.
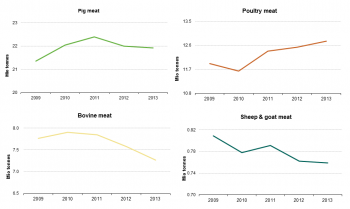
From 2009 to 2013, there was a significant rising trend in poultry meat (Figure 2), which saw an overall increase of 7.03 %. Pigmeat also increased (2.65 %) while bovine meat decreased by 6.2 % and sheep and goat meat by 6.4 %.
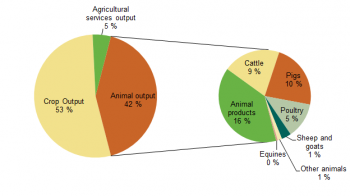
The economic relevance of animal production in agricultural accounts is shown by the fact that 42 % (EUR 172 billion) of the total EU-28 agricultural output comes from it. Animal production covers two items: output for Animals and Animal products. Output for Animals, which represents 61 % of animal output, is the value of animals produced either directly for slaughter, or used alive for herd renewal or for further growing and fattening. Animal products account for the remaining 39 % and cover eggs, milk, wool, etc.
Slaughtering
Table 1 draws a general picture of European meat production based on the 2013 slaughtering statistics. Pigmeat was the most important meat category: nearly 22 million tonnes were produced, i.e. 51 % of annual production of all meats, followed by poultry meat with 12.7 million tonnes (30 %). Bovine meat production totalled 7.3 million tonnes (17 %) and the meat from sheep and goats accounted for only 758 000 tonnes, around 2 % of all meats.
The special case of ‘other slaughtering’
So-called other slaughtering is carried out other than in slaughterhouses. In the EU, it is a marginal phenomenon, primarily arising from own-consumption, and traditional or ritual slaughter (Table 2). It can be locally significant in part due to incomplete implementation of hygiene legislation. The EU has rigorous hygiene rules, and food is tracked at all stages of the production chain, including slaughtering, processing and distribution, in order to guarantee food safety throughout Europe (see data sources and availability).
In 2013, 77 % of other slaughtering was recorded in those Member States that joined the EU in 2004 or later. In relative terms, other slaughtering accounted for 13 % of total slaughtering in the 13 newest Member States and 0.5 % in the EU-15.
The general trend is a decrease: other slaughtering fell by 56 % in EU-28 between 2009 and 2013, but it remains at a significant level in Bulgaria and Romania. In Croatia, it was not possible in 2013 to differentiate figures for the two types of slaughtering. In Latvia, Slovenia and Lithuania, other slaughtering has decreased, especially for bovine animals, but the numbers remain significant for pigs, sheep and goats.
The contribution of the various species to other slaughtering is much higher for pigs (64.2 %) than for small grazing livestock (19.0 %) and bovine animals (16.8 %). For this latter category, ‘adult cattle’ (one year and older) account for 11.65 % and calves & young cattle for 5.15 %.
1.2 Beef and veal (bovine meat)
In terms of value, bovine animals represent 8.1 % of total agricultural output and 33 % of animal output, without taking account of animal products (e.g., milk).
In EU-28, between 2007 and 2013, the number of non-dairy cows decreased by 5 %, from 12.5 to 11.9 million heads (Figure 3). This trend was especially striking in EU-15 (compared with the other EU 28 countries). Indeed, the major part of the meat bovine herd is located in four Member States: France (34.5 %); Spain (14.9 %); the United Kingdom (13.0 %); and Ireland (9.1 %). Together, they represent more than 70 % of the European meat herd. This type of herd is susceptible to changes in the sector’s limited profitability and is thus sensitive to the level of subsidies from the common agricultural policy.
Between 2009 and 2013, production of meat from heifers and bulls fell in both EU-28 (-10 %) and EU-15 (-13 %). However, there has been an increase regarding veal, i.e. meat from calves (aged under 8 months) and young cattle (aged between 8 and 12 months), and for which production increased by around 27 % in the EU-28 and 30 % for EU-15 during this period.
Meanwhile, the average carcass weight has increased by 2 % for adult cattle (aged one year and over) and by 7 % for calves and young cattle.
Bovine production forecasts are expressed as Gross Indigenous Production (GIP), defined as the number of bovine animals slaughtered plus or minus the net exports of live bovine animals. This indicator is more likely to be produced based on current livestock rather than slaughtering.
Compared with pigmeat production, beef production has a longer production cycle (Figure 6), its feed efficiency is lower and its value of individual animals is higher. In addition, the diversity of animals produced for slaughter (feeding mode, age, dairy or meat breeds) makes the production systems more complex. All these factors have led to tight margins and low profitability. The purchasing power of consumers is also a key determinant of the level of meat consumption. This is noticeable especially in the beef & veal sector where prices are significantly higher than for pig (or poultry) meat. This explains why pigs and poultry are raised and consumed much more in Europe.
Pigmeat
Pigmeat represents 9.3 % of the total EU agricultural output.
As already highlighted, pigmeat is the major type of meat production in EU-28.
From 2006 to 2013, the total number of pigs decreased by 10.3 %. This trend can be explained mainly by lower profitability, due to economic and regulatory conditions, with impacts on the weakest farms. For instance, as a result of requirements laid down on their welfare conditions, Council Directive 2008/120/EC on the protection of pigs contributed to increasing the cost per sow. The larger pig farm size, as measured by the number of sows, comes across as an efficient market response in this context. They represent a higher share of the sector in EU-15 than in the other Member States. It also reflects the disappearance of the smallest and less productive pig-farming activities.
Although the total number of pigs has decreased since 2004, pigmeat production has remained stable over the years and even registered peaks in 2007 and 2011 (Figure 7). This reflects efficiency gains in pig farming despite stronger regulatory constraints. This is more evident in EU-15 than in the other Member States.
Meat from sheep and goats
Sheep and goat meat represents 1.3 % of the total EU agricultural output.
Based on the 2010 Farm Structure Survey (FSS), 7.7 % of farms have sheep and nearly half of the sheep belong to flocks of over 500 heads. Goat farms account for 4.4 % of farms and 51.5 % of goats belong to flocks of over 200 heads. These average figures conceal somewhat the contrasts between small herds, either in small rural farms or as a side-production in larger ones, and larger herds, especially in regions with natural or environmental constraints.
Under the legislation in force (see Data sources and availability), the 14 Member States with more than 500 000 sheep and the five Member States with more than 500 000 goats must provide statistics on the relevant livestock populations. Therefore, all the figures presented in this document refer to these countries.
The 14 Member States reporting on sheep population can be distinguished depending on the share of dairy ewes in the ewe flock (Table 3). The ‘northern’ countries have no or limited dairy production whereas dairy ewe sheep farming is significant in the ‘southern’ countries.
The farming systems for sheep and goats in the southern countries have similar levels of complexity in terms of their organisation as those for bovine animals in the EU generally, with both dairy and fattening flocks co-existing together. Individual dairy animals are more profitable than meat animals and therefore they are more likely to be supported by technology than meat animals (feeding, genetic progress, farm equipment, farmer education, etc.). Several types of meat are produced, either from young animals in the dairy herd or from heavier sheep in the meat herd, fattened on grassland or with feedstuff. Milk processing on farms is more frequent, as daily milk volumes are lower than from cows’ milk, i.e. milk collection by a dairy is suitable only where dairy farm density on the territory is sufficient.
Between 2005 and 2013, the EU-28 sheep flock reduced by 10.96 million animals. During the last year of the period, the trend continued to go down but the drop was less significant than in previous years, perhaps showing that the sector was starting to be more stable. The EU drop reflects the significant fall suffered in the main sheepmeat producing countries (Figure 9). Spain lost 28 % of its flock (6.4 million sheep), Portugal 29 %, Ireland 24 % and France 18 %. The United Kingdom, which is by far the most important sheepmeat producer (20 % of EU-28 production), lost 4.7 % of its flock. In contrast, the sheep flock grew in three countries: Romania (+20 %); Greece (+9 %), where more than 90 % of ewes are dairy ewes; and Sweden (+22 %).
The overall contribution of goat meat to EU-28 meat production is modest (0.1 %) and it is concentrated in five Member States representing 80.8 % of the total EU goat meat production. It can be described as a by-product of dairy production. Goat slaughtering is recorded especially to ensure a complete overview of the sector.
Sheep and goat farming is possible in areas with limited agronomic potential (rough grazing), but only at low levels of profitability per head. The trend is either one of increasing herd size or of turning to dairy production. It can also take profit of poor lands and be part of activity for diversified farms. It is therefore important for rural development policy and no specific direct support is designed for the product at EU level. Several Member States (e.g. Greece, Spain, Italy, the Netherlands, Poland and Portugal) have introduced specific national support measures for sheep and goats under the Single Farm Payment under Article 68 of Council Regulation (EC) No 73/2009. This may have limited the decrease.
Poultry meat
Poultry meat value represents 5.3 % of total agricultural output and 20.9 % of animal output, totalling approximately EUR 21.3 billion.
Poultry meat production is therefore relatively integrated. Production constraints from legislation (environment, hygiene, welfare, etc.) have increased production costs and profitability thresholds. Further commitments under quality schemes have also increased costs, but the higher costs are more than offset by the added value gained. In a competitive market, this has favoured the development of larger poultry farms.
According to the 2010 farm structure survey, 18.5 % of all European farms raise broilers. Farms with more than 5 000 broilers (professional farms) represent barely 1 % of the total number of broiler farms, but they account for 93.5 % of broiler heads. More than three quarters of farms with more than 5 000 broilers are located in France, Spain, Poland, Italy, Germany and UK. The data also illustrates that the number of broiler farms is extremely high in Romania, Poland, Portugal and Greece but, in contrast, these countries comprise 91 % of the farms with fewer than 5 000 broilers.
In 2013, EU-28 produced 12.7 million tonnes of poultry meat, 17 % more than in 2007. Four countries together produce half of the EU’s poultry meat: France (13.3 % of the EU-28 total), closely followed by the United Kingdom (13.0 %), Poland (12.9 %) and Germany (11.4 %). Poultry meat is almost always from chicken (80 %) and turkey (15 %) whereas ducks account for only 3.5 %. The remaining 1.8 % is from other poultry (table 4).
Chicken meat (10.2 million tonnes) was mostly produced in seven Member States, each producing more than 0.8 million tonnes: the United Kingdom, Poland, Germany, France, Spain, Italy and the Netherlands. Excluding the Netherlands, the same countries together produced 92 % of EU turkey meat (1.9 million tonnes). France is by far the largest producer of duck meat, accounting for more than half of the total EU production (0.5 million tonnes). Other poultry refers, for example, to guinea fowl or geese.
Data sources and availability
- The Farm Structure Survey (FSS), a robust survey with a wide scope
Since 2009, the structure of livestock farms no longer forms part of an EU survey as such. Thus, the data are drawn from the FSS. Although this provides a wider scope (including land use, livestock, labour force, etc.) and a longer reference period, the results are less informative about the animal population than the data previously collected through the Livestock survey. Every third year, the Farm Structure Survey records data about the farm structure, which can be used for describing the structure of animal herds. The legal basis for the FSS is Regulation (EC) No 1166/2008 of the European Parliament and of the Council.
Member States collect information on land use, livestock numbers, rural development, management and farm labour input from individual agricultural holdings. Based on the share of virtual value for standard output, activities of the farm (e.g. cows, other than dairy cows) are used to classify the type of farming. If the share of standard output from a particular activity is more than two thirds of the total farm output, it is classified as ‘specialist activity’ (e.g. specialist cattle — rearing and fattening).
- Livestock and meat statistics
The legal basis of the data collection on slaughtering and meat production is Regulation (EC) No 1165/2008 on livestock and meat statistics. It establishes a common legal framework for statistics on livestock (bovine, pig, sheep and goat), slaughtering (bovine animals, pigs, sheep, goats and poultry) and production forecasts (bovine, pig, sheep and goat meat). In order to limit administrative burdens, Member States with a limited contribution to EU results are asked to deliver fewer statistics, or to deliver them less often. The threshold for bovine population is, for instance, 1.5 million heads (see table below).
| Livestock | Threshold (heads) | Member States over threshold | Coverage |
|---|---|---|---|
| Bovine | 1.5 million | BE, DK, DE, IE, ES, FR, IT, NL, AT, PT, RO, UK (12) | 83.7 %
(2013) |
| Pig | 3 million | BE, DK, DE, ES, FR, IT, HU, NL, AT, PT, RO, UK (12) | 84.7 %
(2013) |
| Sheep | 500 000 | BG, DE, IE, EL, ES, FR, HR, IT, HU, NL, PT, RO, SE, UK (14) | 97.4 %
(2009) |
| Goat | 500 000 | EL, ES, FR, IT, RO (5) | 82.3 %
(2009) |
The livestock survey provides information about the livestock population at national and regional level. Designed for this purpose, the results on the number of animals are intended to be more reliable than the farm structure survey figures. Furthermore, the nomenclature of livestock is more detailed, especially in order to establish production forecasts. The surveys are conducted in all EU countries at least once a year (in November/December). The figures on sheep population are due only by 14 Member States and the figures on goat population are due only by five of them. In this paper, the figures presented refer only to these countries. A second survey is conducted in May/June for bovine (12 Member States) and pig (12 Member States) populations where relevant. The November/December survey results are also provided at regional level.
Data on slaughtering are collected on a monthly basis; other slaughtering is estimated annually. Nevertheless, where other slaughtering is significant, the corresponding figures are provided monthly on a voluntary basis.
Gross Indigenous Production (GIP) is forecasted once a year or, where significant, twice a year. Quarterly (pig) or half-yearly forecasted production covers a one to two years period depending on the country status and on the animal species concerned.
Regulation (EC) No 1165/2008 of the European Parliament and of the Council, which entered in force in 2009, introduced a classification based on the age of the slaughtered animals instead of the weight. This may have an impact on some slaughtering figures and break the relevant time series. In particular, the figures for slaughtered young cattle (under 1 year old) and heifers (1-2 years) were affected.
- Economic Accounts for Agriculture (EAA)
The economic accounts for agriculture (EAA) is a satellite account of the European System of Accounts (ESA 95) providing complementary information and concepts adapted to the particular nature of the agricultural sector. Although their structure very closely matches that of national accounts, their compilation requires appropriate rules and methods. Agricultural output measures the value of agricultural products (crop and animal products) produced during the accounting period. It includes the value of agricultural services and excludes the intra-unit consumption (consumption by the farms of their own products).
See also
- Agriculture, forestry and fishery statistics - 2014 edition
- Pig farming in the European Union
- Agricultural census 2010
- Farm structure statistics
- All farm structure articles by country (2007)
Context
This article draws a portrait of the meat production in the EU in 2013, with a particular focus on slaughtering. It also deals with the structure of the European farms and the livestock population.
Further Eurostat information
Data visualisation
- Symbols & country abbreviations
‘:’ not available
‘c’ confidential data
‘:z’ not applicable
Main tables
- Agricultural production (t_apro)
- Livestock and meat(t_apro_cp)
- production of meat: pigs (tag00042)
- Production of meat: cattle (tag00044)
- Production of meat: sheep and goats (tag00045)
- Production of meat: poultry (tag00043)
- Livestock and meat(t_apro_cp)
Database
- Agriculture, see:
- Farm structure 2010 (ef_2010)
- Overview - Farm livestock (ef_ols)
Dedicated section
Methodology / Metadata
- Crops products: areas and productions (ESMS metadata file - ef_esms)
Source data for tables, figures and maps (MS Excel)
Other information
- Council Regulation (EC) No 73/2009 of 19 January 2009 establishing common rules for direct support schemes for farmers under the common agricultural policy and establishing certain support schemes for farmers, amending Regulations (EC) No 1290/2005, (EC) No 247/2006, (EC) No 378/2007 and repealing Regulation (EC) No 1782/2003.
- Regulation (EC) No 1166/2008 of the European Parliament and of the Council of 19 November 2008 on farm structure surveys and the survey on agricultural production methods and repealing Council Regulation 571/88.
- Regulation (EC) No 1165/2008 of the European Parliament and of the Council of 19 November 2008 concerning livestock and meat statistics and repealing Council Directives 93/23/EEC, 93/24/EEC and 93/25/EEC.
- Regulation (EC) No 853/2004 of the European Parliament and of the Council of 29 April 2004 laying down specific hygiene rules for on the hygiene of foodstuffs.
- Regulation (EC) No 882/2004 of the European Parliament and of the Council of 29 April 2004 on official controls performed to ensure the verification of compliance with feed and food law, animal health and animal welfare rules.
Notes
- ↑ The figures on sheep population are due only by Member States with at least 500 000 sheep. They are BG, DE, IE, EL, ES, FR, HR, IT, HU, NL, PT, RO, SE, UK (see Data sources and availability).
- ↑ The figures on goat population are due only by Member States with at least 500 000 goat. They are EL, ES, FR, IT, RO (see Data sources and availability).
