Archive:Electricity generation statistics – first results
- Data from December 2013. Most recent data: Further Eurostat information, Main tables and Database.
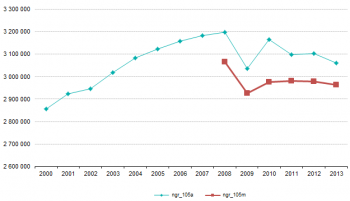
This article takes a look at the most recent statistics (provisional 2013 monthly cumulated data) on the volumes of electricity that have been produced and supplied at the level of the European Union (EU-28), the euro area (EA-18) and at the level of the individual Member States of the EU-28 and of Norway and Turkey. As illustrated by Figure 1, the supply of electricity in EU-28 decreased by 1.4% in 2013 compared to 2012.
(in GWh)
Source: Eurostat (nrg_105a), (nrg_105m)
(in %)
Source: Eurostat (nrg_105a), (nrg_105m)
(in %)
Source: Eurostat (nrg_105a), (nrg_105m)
Main statistical findings
Production of electricity
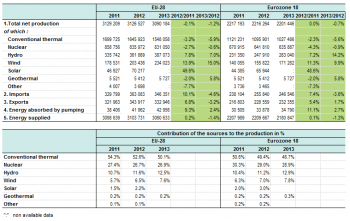
After two consecutive years of stability in the net production of electricity, the volume of produced electricity at EU-28 level decreased in 2013 by 1.2 % compared to the preceding year.
Table 1 shows the production and supply data for EU-28 and euro area (EA-18). Tables A to J (see: Source data for tables, figures and maps on this page (MS Excel)) show the production and supply data for all individual EU Member States and for Norway and Turkey, by using monthly cumulated data for 2013 (2011 and 2012 data are annual figures).
Luxembourg (-25.2 %), Hungary (-13.1 %), Sweden (-8.4 %), Ireland (-8.2 %) and Austria (-7.2 %) are the Member States that recorded the largest decreases in electricity production.
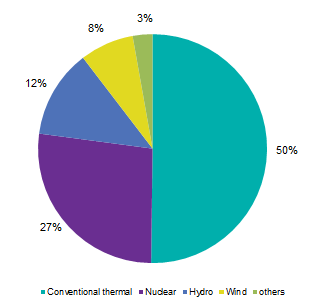
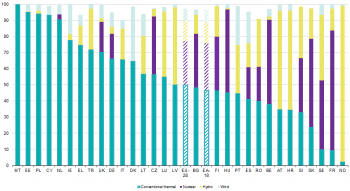
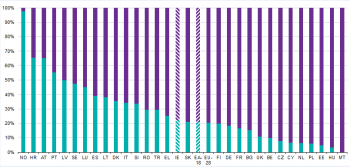
As regards the structure of electricity production in 2013 (Figures 2 and 3):
- the production of conventional thermal electricity decreased by 5.9 % in the EU-28 and accounted for 50.1 % of total production;
- the production of electricity by nuclear power plants decreased by 0.6 % in the EU-28 and accounted for 26.9 % of the total;
- the electricity production by hydro which includes pumped hydro (not necessarily of renewable origin) increased by 7 % while the production by wind increased in the EU-28 by 15 % and represented respectively 12.5 % and 7.6 % of the total;
- the electricity production by solar is not available in the monthly cumulated data.
Norway recorded a decrease in total production (-9.6 %). In Turkey, production remained in 2013 stable as compared to the previous year.
The electricity produced by nuclear power plants decreased by 0.6 % between 2012 and 2013. The largest share of electricity produced by nuclear in the 14 EU Member States that have nuclear facilities to produce electricity can be found in France (73.6 %), followed by Slovakia (54.7 %), Belgium (52.1 %), Hungary (51.5 %), Sweden (42.6 %) and Czech Republic (35.9 %). Germany that has decided to close down its nuclear power plants during the next decade has a share of 15.4 %.
Electricity supplied to the market
The volume of electricity that is supplied to the market is defined as the total net volume of produced electricity minus export plus import minus the electricity that is absorbed by pumping (pumped storage). As illustrated in Figure 1, the supply of electricity in EU-28 decreased by 1.4 % in 2013 compared to 2012.
In 2013, the aggregated EU-28 imports and exports of electricity decreased by 4.6 and 3.2 % respectively.
When looking at supply statistics at national level, minor increases were observed in France (+1.1 %), Slovakia (+0.9 %), Greece (+0.5 %) and Lithuania (+0.3 %). In Turkey, the supply increased by 1.4 % compared to 2012 while in Norway it decreased by 0.4 %.
The largest decreases in supply figures were observed in Romania (-10.1 %), Cyprus (-9.1 %), Italy (-3.4 %), Malta (-2.9 %), Spain (-2.8 %) and Sweden (-2.8 %).
Further Eurostat information
Publications
- Energy, transport and environment indicators - 2013 edition
- Energy balance sheets 2010-2011 - 2013 edition
- Panorama of energy - Panorama April 2009
- Renewable energy - Statistics in focus 44/2012
Main tables
- Energy (t_nrg), see:
- Main indicators - Energy Statistics (t_nrg_indic)
- Market share of the largest generator in the electricity market (tsier060)
- Electricity generated from renewable sources (tsien050))
- Energy Statistics - quantities (t_nrg_quant)
- Total gross electricity generation (ten00087)
- Consumption of electricity by industry, transport activities and households/services (ten00094)
- Electricity consumption of households (tsdpc310)
- Energy Statistics - prices (t_nrg_price)
- Electricity prices for industrial consumers (ten00114)
- Electricity prices for household consumers (ten00115)
Database
- Energy (nrg), see:
- Main indicators - Energy Statistics (nrg_indic)
- Market share of the largest generator in the electricity market (nrg_ind_331a)
- Energy Statistics - Euro-indicators in energy - monthly data (nrg_ind_34m)
- Supply of electricity - monthly data (nrg_ind_342m)
- Energy statistics - quantities, annual data (nrg_quant)
- Energy statistics - supply, transformation, consumption (nrg_10)
- Energy statistics - quantities, monthly data (nrg_quantm)
- Energy statistics - supply, transformation, consumption (nrg_10m)
Dedicated section
Source data for tables, figures and maps on this page (MS Excel)
Methodology / Metadata
- Energy Statistics (ESMS metadata file - nrg_indic_esms)
- Energy Statistics - quantities (ESMS metadata file - nrg_quant_esms)
Other information
- Regulation (EC) N° 1099/2008 of 22 October 2008 on energy statistics
- Regulation (EC) N° 844/2010 of 20 September 2010 on energy statistics, as regards the establishment of a set of annual nuclear statistics and the adaptation of the methodological references according to NACE Rev. 2
- Regulation (EC) N° 713/2009 of 13 July 2009 establishing an Agency for the Cooperation of Energy Regulators
- Regulation (EC) N° 714/2009 of 13 July 2009 on conditions for access to the network for cross-border exchanges in electricity
- Directive 2009/72/EC of 13 July 2009 concerning common rules for the internal market in electricity
External links
- Eurelectric - Electricity for Europe - Statistics
- European Commission - Energy - Gas & Electricity - Electricity Regulatory Forum (Florence)
- European Commission - Energy - Market observatory - Electricity
- International Energy Agency (IEA) - Electricity
