Archive:Enlargement countries - agriculture, forestry and fisheries statistics
- Data extracted in September 2016. Most recent data: Further Eurostat information, Main tables and Database. Planned article update: October 2017.
This article is part of an online publication and provides information on a range of statistics for the agriculture, forestry and fishing sectors of the EU enlargement countries, in other words the candidate countries and potential candidates. Montenegro, the former Yugoslav Republic of Macedonia, Albania, Serbia and Turkey currently have candidate status, while Bosnia and Herzegovina and Kosovo [1] are potential candidates.
The article provides an overview of recent developments in the enlargement countries, presenting indicators such as the relative importance of agriculture, forestry and fishing in terms of their contribution to total gross value added and employment. It also provides more detailed data on agricultural land use, agricultural production, livestock populations and meat production, as well as trade in food, live animals, drinks and tobacco.

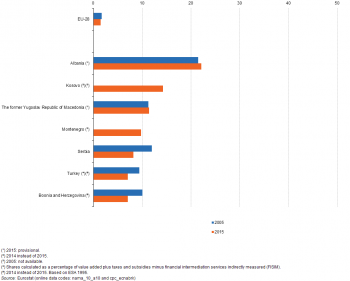
(% of total gross value added)
Source: Eurostat (nama_10_a10) and (cpc_ecnabrk)

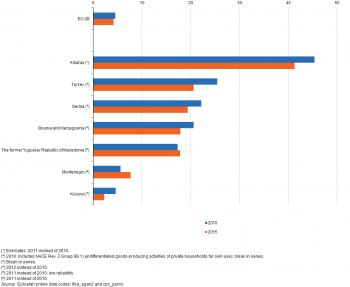
(% of total employment)
Source: Eurostat (lfsa_egan2) and (cpc_pslm)

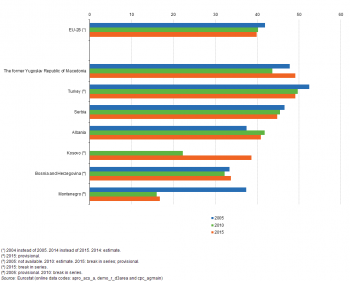
(% of total area)
Source: Eurostat (apro_acs_a), (demo_r_d3area) and (cpc_agmain)

(thousand tonnes)
Source: Eurostat (apro_acs_a), (apro_mk_farm) and (cpc_agmain)

(thousand heads)
Source: Eurostat (apro_mt_lscatl), (apro_mt_lspig), (apro_mt_lssheep), (apro_mt_lsgoat) and (cpc_agmain)

(thousand tonnes)
Source: Eurostat (apro_mt_pann) and (cpc_agmain)

(million EUR)
Source: Eurostat (ext_st_eu28sitc) and (ext_lt_intercc)

(million EUR)
Source: Eurostat (ext_st_eu28sitc) and (ext_lt_intercc)
Main statistical findings
Gross value added and employment
The share of agriculture, forestry and fishing in value added is considerably higher in enlargement countries than in the EU
The relative weight of agriculture, forestry and fishing in terms of their contribution to gross value added was 1.5 % in the EU-28 in 2015 (see Figure 1). This was considerably smaller than in any of the enlargement countries, where Turkey and Bosnia and Herzegovina recorded the lowest shares at 7.1 % (2014 data). In three of the enlargement countries these activities contributed at least one tenth of total value added, peaking at 22.1 % in Albania.
Between 2005 and 2015 the relative contribution of agriculture, forestry and fishing to value added in the EU-28 fell from 1.7 % to 1.5 %. Serbia, Bosnia and Herzegovina (2005–2014) and Turkey (2005–2014) also recorded a decline in their shares of value added from these activities, with the largest fall —3.8 percentage points — in Serbia. By contrast, the former Yugoslav Republic of Macedonia recorded a very slight increase in the share of these activities, while in Albania an increase of 0.6 percentage points was observed.
Employment in agriculture, forestry and fishing in the EU-28 accounted for 4.2 % of the total number of persons employed in 2015 (see Figure 2), some 2.8 times the contribution of these activities to total value added. The long-term reduction in the proportion of the total EU workforce employed in agriculture, forestry and fishing continued, as the proportion of total employment fell by 0.4 percentage points during the period 2005–15.
Among the enlargement countries, Kosovo (2.3 %) recorded the lowest employment share for agriculture, forestry and fishing, while the 7.7 % share in Montenegro was the only other one below 10.0 %. By contrast, close to one fifth of the workforce was employed in agriculture, forestry and fishing activities in 2015 in most of the other enlargement countries, although in Albania the share was much higher, at 41.3 %.
Land use
Close to half of the former Yugoslav Republic of Macedonia and Turkey’s area is used for agriculture
The area within each country that is used for farming varies according to climate, terrain and soil type, while the level of economic development and population density may also play a role in determining land use. Within the EU-28 roughly equal proportions of land (around 40 % of the total land area) are used for farming and for forestry, with the remainder being built-up areas (villages, towns and cities), infrastructure (roads or railways), scrub or waste land.
The utilised agricultural area (UAA) refers to the area that is actually used for agricultural purposes. In 2015, the combined utilised agricultural area for the enlargement countries was around 47 million hectares, equivalent to just over one quarter of the total for the EU-28. Among the enlargement countries, Turkey had by far the largest utilised agricultural area, some 39 million hectares. Relative to the size of each country, the former Yugoslav Republic of Macedonia and Turkey recorded the highest proportions of their total area utilised for agricultural purposes, close to half (49.2 % and 49.1 % respectively) (see Figure 3), while in Serbia the share was 44.8 % and in Albania it was 40.9 %. In the three remaining enlargement countries the share of utilised agricultural area was lower than the EU-28 average (39.9 % in 2014), with Kosovo and Bosnia and Herzegovina recording shares above one third of their total area in 2015, while Montenegro registered the lowest share, at 16.7 %.
Agricultural production
Cereals and sugar beet production in enlargement countries was around one sixth or one seventh the level in the EU-28
The production of cereals in the EU-28 was 318 million tonnes in 2015, while the combined harvest for the enlargement countries was around 50 million tonnes, equivalent to 15.7 % of the output of the EU-28 (see Table 1). A similar situation could be seen for sugar beet, where the combined production of the enlargement countries was equivalent to just over one sixth (17.9 %) of the EU-28 total, with production concentrated in Serbia and Turkey.
Crop production levels can fluctuate substantially from year to year as a result of climatic/weather conditions and variations in demand. Production of cereals was higher in 2015 than in 2005 in four of the seven enlargement countries, as it was in the EU-28 when comparing 2014 with 2005. By contrast, sugar beet production in the EU-28 was considerably lower in 2015 than in 2005, falling overall by 26 %. There were also reductions in sugar beet production in the former Yugoslav Republic of Macedonia (where output ceased) and Serbia (-34 % over the period under consideration), while Turkey registered a modest expansion between 2005 and 2015, with overall growth of 6 %.
The level of milk production (which may include milk other than cows’ milk) was approximately one tenth higher in 2014 (165million tonnes) in the EU-28 than it had been in 2005 (150 million tonnes). The latest information for six of the enlargement countries (no data for Kosovo) shows that Turkey had by far the highest milk production and reported an increase of 68 % between 2005 and 2015.
Climatic and cultural/religious particularities in the enlargement countries are reflected in their livestock production and slaughtering
The number of cattle in the EU-28 declined slightly from 90.4 million in 2005 to 89.2 million by 2015. Comparing the same years most of the enlargement countries also reported a fall in cattle numbers, the exceptions being the former Yugoslav Republic of Macedonia where there was a slight increase and Turkey where the cattle population increased more substantially, up by one third. By 2015 the total number of cattle in the enlargement countries was 16.5 million, equivalent to 18.5 % of the EU-28 total.
Cultural particularities explain many of the differences in the structure of livestock rearing in the EU and enlargement countries (see Table 2). For example, Turkey is a largely Muslim country and as such many of its citizens abstain from eating pork; the same is true in some of the Balkan countries, for example, in parts of Kosovo, Bosnia and Herzegovina and Albania. Whereas in the EU-28 there were more pigs than cattle, among the enlargement countries this situation was only repeated in Serbia and Bosnia and Herzegovina. Collectively the number of pigs in enlargement countries in 2015 was equivalent to just 2.9 % of the EU-28 total.
Turkey alone reported 41.9 million sheep and goats in 2015 and the combined total for the enlargement countries was 49.1 million. As such, the number of sheep and goats in enlargement countries was relatively high when compared with the number in the EU-28, approximately half the estimated level in 2015 (precise recent data are not available for the EU aggregate). In relation to the number of cattle and pigs, the number of sheep and goats was particularly high in Albania and relatively low in Serbia.
The livestock figures shown in Table 2 are, unsurprisingly, reflected in the meat production figures in Table 3, notably the relatively low level of pig meat production in some enlargement countries. The quantity of pig meat produced in the EU-28 in 2015 was three times the level of output from cattle. Among the enlargement countries a higher ratio was observed for Serbia where pig meat production was 3.6 times as high as the level of meat production from cattle. By contrast, less pig meat was produced than meat from cattle in Bosnia and Herzegovina, Montenegro and Albania, as well as in Turkey where pig meat production was negligible.
Among the four types of meat production shown in Table 3 pig meat had the largest share in Serbia (59 % of the total) and the former Yugoslav Republic of Macedonia (58 %), whereas the highest share of output was recorded for meat from cattle in Montenegro (53 %) and Albania (44 %), and from poultry meat in Turkey (63 %) as well as Bosnia and Herzegovina (54 %).
Trade in food, live animals, drinks and tobacco
Note that the values of imports and exports shown in Tables 4 and 5 are presented in current prices. Fluctuating prices for raw and processed food may have a considerable impact on the trade position of a country, while climatic/weather conditions can determine if there is a surplus of food for export or the need for more imports.
The EU-28 consistently ran a trade deficit in food, live animal, drinks and tobacco products over the period 2005–2011, while in the four most recent years (2012–2015) the EU-28 recorded a trade surplus in these products; note that the trade data presented for the EU-28 in Tables 4 and 5 concern extra-EU trade only. Montenegro, the former Yugoslav Republic of Macedonia, Albania, Bosnia and Herzegovina, and Kosovo recorded trade deficits during the entire period from 2005 to 2015 (in so far as data are available). By contrast, Serbia and Turkey both recorded trade surpluses for food, live animals, drinks and tobacco throughout the period shown.
Collectively, exports of food, live animals, drinks and tobacco from enlargement countries were valued at EUR 17.3 billion in 2015, equivalent to 15.2 % of the EU-28 total, while the value of imports of these goods into the enlargement countries was EUR 11.4 billion, equivalent to 10.6 % of the EU-28 total.
The highest value of exports of food, live animals, drinks and tobacco in 2015 among the enlargement countries was recorded in Turkey (EUR 14.0 billion), which was four fifths of all the food, live animal, drinks and tobacco exports from the enlargement countries. Serbia was the only other enlargement country with such exports valued in excess of EUR 0.5 billion, while exports of food, live animals, drinks and tobacco from Montenegro and Kosovo were valued at less than EUR 100 million.
Exports of food, live animals, drinks and tobacco from Montenegro were around 50 % higher in 2015 as they had been in 2006, the smallest growth among the enlargement countries. Between 2005 and 2015, such exports from Bosnia and Herzegovina (2008–2015) and the former Yugoslav Republic of Macedonia almost doubled, from Turkey they more than doubled, from Serbia they were nearly four times as high at the end of this period, in Kosovo five times as high, and in Albania nearly eight times as high.
Data sources and availability
Data for the enlargement countries are collected for a wide range of indicators each year through a questionnaire that is sent by Eurostat to partner countries which have either the status of being candidate countries or potential candidates. A network of contacts in each country has been established for updating these questionnaires, generally within the national statistical offices, but potentially including representatives of other data-producing organisations (for example, central banks or government ministries). The statistics shown in this article are made available free-of-charge on Eurostat’s website, together with a wide range of other socio-economic indicators collected as part of this initiative.
The situation for international trade statistics is somewhat different, as more detailed international trade statistics are available from Eurostat’s Comext database or the United Nations’ Comtrade database.
All statistics presented in this article as monetary values in euro terms are based on current price series.
The utilised agricultural area describes the area used for farming. It includes arable land, permanent grassland, permanent crops (such as orchards, olive trees and vineyards) and other agricultural land such as kitchen gardens.
Statistics on crop production relate to harvested production. Cereals include wheat (common wheat and spelt and durum wheat), rye, maslin, barley, oats, mixed grain other than maslin, grain maize, sorghum, triticale, and other cereal crops such as buckwheat, millet, canary seed and rice.
Meat production is based on the activity of slaughterhouses regarding meat fit for human consumption.
Tables in this article use the following notation:
| Value in italics | data value is forecasted, provisional or estimated and is therefore likely to change; |
| : | not available, confidential or unreliable value. |
Context
Agriculture was one of the first sectors of the economy (following coal and steel) to receive the attention of EU policymakers, and statistics on agriculture were initially designed to monitor the main objectives of the common agricultural policy (CAP). While the CAP remains one of the EU’s most important policies there have been wide ranging reforms, which have led to a range of new objectives designed to correct imbalances and overproduction.
In December 2013, the latest reform of the CAP was formally adopted by the European Parliament and the Council. The main elements of the CAP post-2013 concern: a fairer distribution of direct payments (with targeted support and convergence goals); strengthening the position of farmers within the food production chain (such as through: the promotion of professional and inter-professional organisations; changes to the organisation of the sugar and wine sectors; revisions to public intervention and private storage aid; and new crisis management tools); and continued support for rural development, safeguarding the environment and biodiversity.
While basic principles and institutional frameworks for producing statistics are already in place, the enlargement countries are expected to increase progressively the volume and quality of their data and to transmit these data to Eurostat in the context of the EU enlargement process. EU standards in the field of statistics require the existence of a statistical infrastructure based on principles such as professional independence, impartiality, relevance, confidentiality of individual data and easy access to official statistics; they cover methodology, classifications and standards for production.
Eurostat has the responsibility to ensure that statistical production of the enlargement countries complies with the EU acquis in the field of statistics. To do so, Eurostat supports the national statistical offices and other producers of official statistics through a range of initiatives, such as pilot surveys, training courses, traineeships, study visits, workshops and seminars, and participation in meetings within the European statistical system (ESS). The ultimate goal is the provision of harmonised, high-quality data that conforms to European and international standards.
Additional information on statistical cooperation with the enlargement countries is provided here.
See also
- All articles on agriculture
- Enlargement countries - statistical overview — online publication
- International statistical cooperation — online publication
Further Eurostat information
Publications
- Basic figures on enlargement countries — 2015 edition
- Key figures on the enlargement countries — 2014 edition
- Key figures on the enlargement countries — 2013 edition
- Enlargement countries — Agriculture, forestry and fishing — 2014 edition
Database
- Agriculture, forestry and fisheries (cpc_ag)
Dedicated section
Methodology / Metadata
- Candidate countries and potential candidates (ESMS metadata file — cpc_esms)
Source data for tables and figures (MS Excel)
External links
Notes
- ↑ This designation is without prejudice to positions on status, and is in line with UNSCR 1244 and the ICJ Opinion on the Kosovo Declaration of Independence.