Tutorials
Log in
Statistics Explained
menu
search
search
Navigation
Main page
Statistical themes
Glossary
Categories
Statistics 4 beginners
Tutorials
Help
Eurostat home
Education corner
Online publications
Regional yearbook
Sustainable development
Full list
Tools
User contributions
Logs
View user groups
Special pages
search
Navigation
Main page
Statistical themes
Glossary
Categories
Statistics 4 beginners
Tutorials
Help
Eurostat home
Education corner
Online publications
Regional yearbook
Sustainable development
Full list
Tools
User contributions
Logs
View user groups
Special pages
Navigation
Main page
Statistical themes
Glossary
Categories
Statistics 4 beginners
Tutorials
Help
Eurostat home
Education corner
Online publications
Regional yearbook
Sustainable development
Full list
Tools
User contributions
Logs
View user groups
Special pages
Uploads by Barbiis
This special page shows all uploaded files.
File list
Items per page:
20
50
100
250
500
Search for media name:
Username:
Include old versions of files
Go
First page
Previous page
Next page
Last page
Date
Name
Thumbnail
Size
Description
Versions
08:42, 12 June 2024
20240517 Consumption of pesticides tables and figures - upload rev.xlsx
(
file
)
137 KB
1
08:40, 12 June 2024
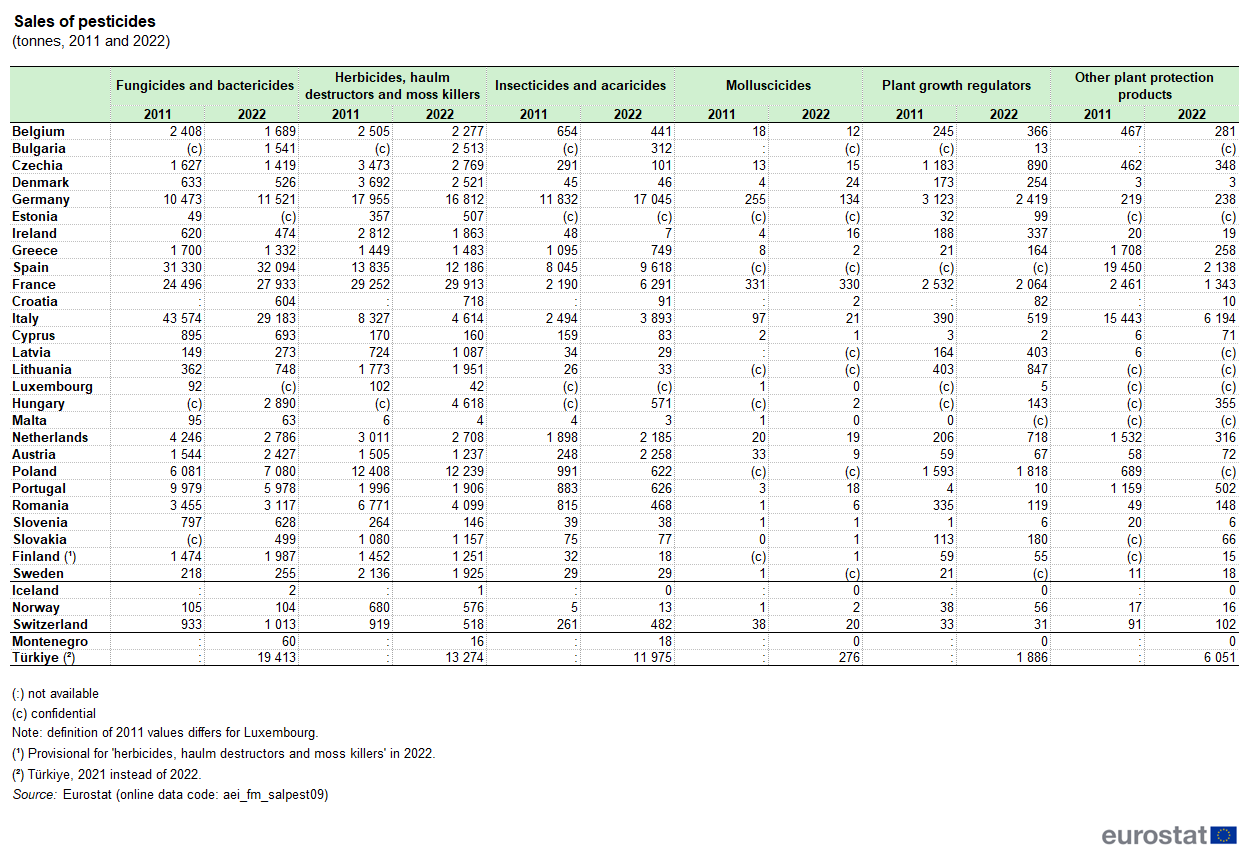
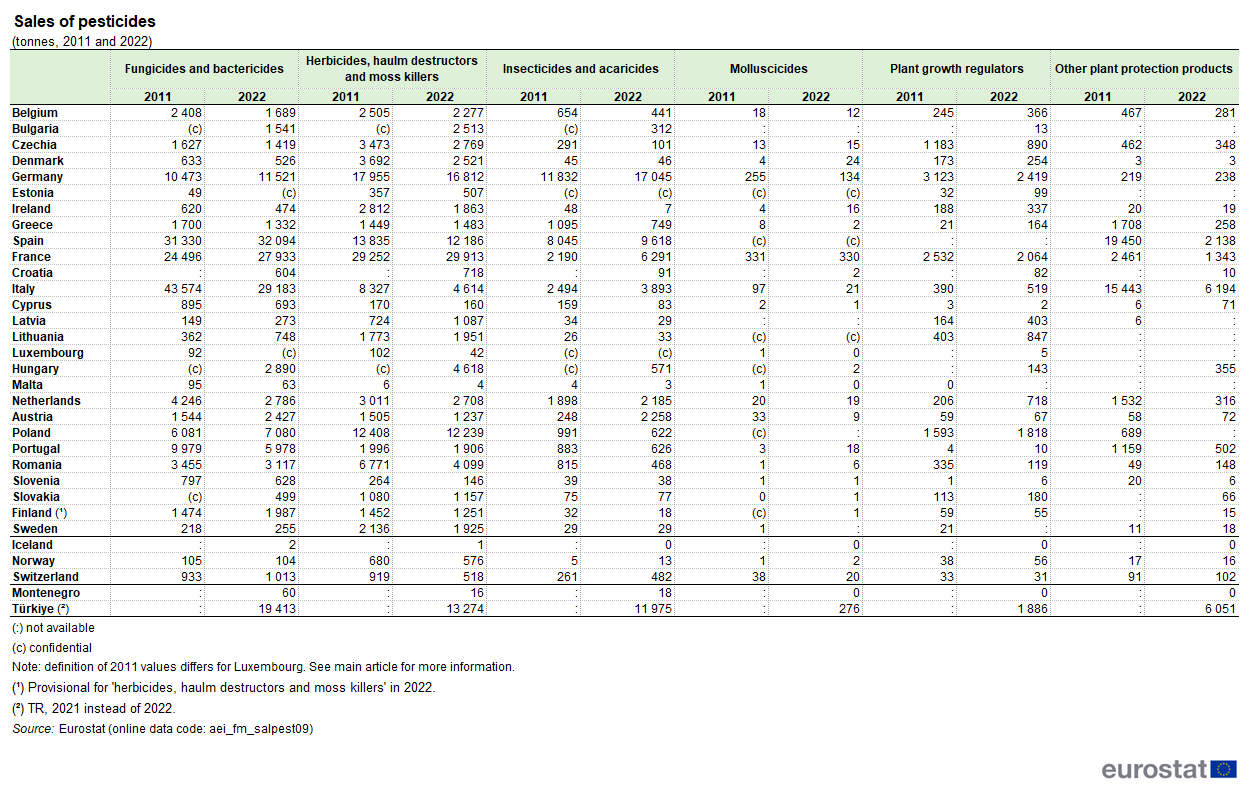
Tab1 Sales of pesticides (tonnes, 2011 and 2022) rev.png
(
file
)
77 KB
1
11:49, 16 May 2024
20240516 Consumption of pesticides tables and figures.xlsx
(
file
)
164 KB
1
10:44, 16 May 2024
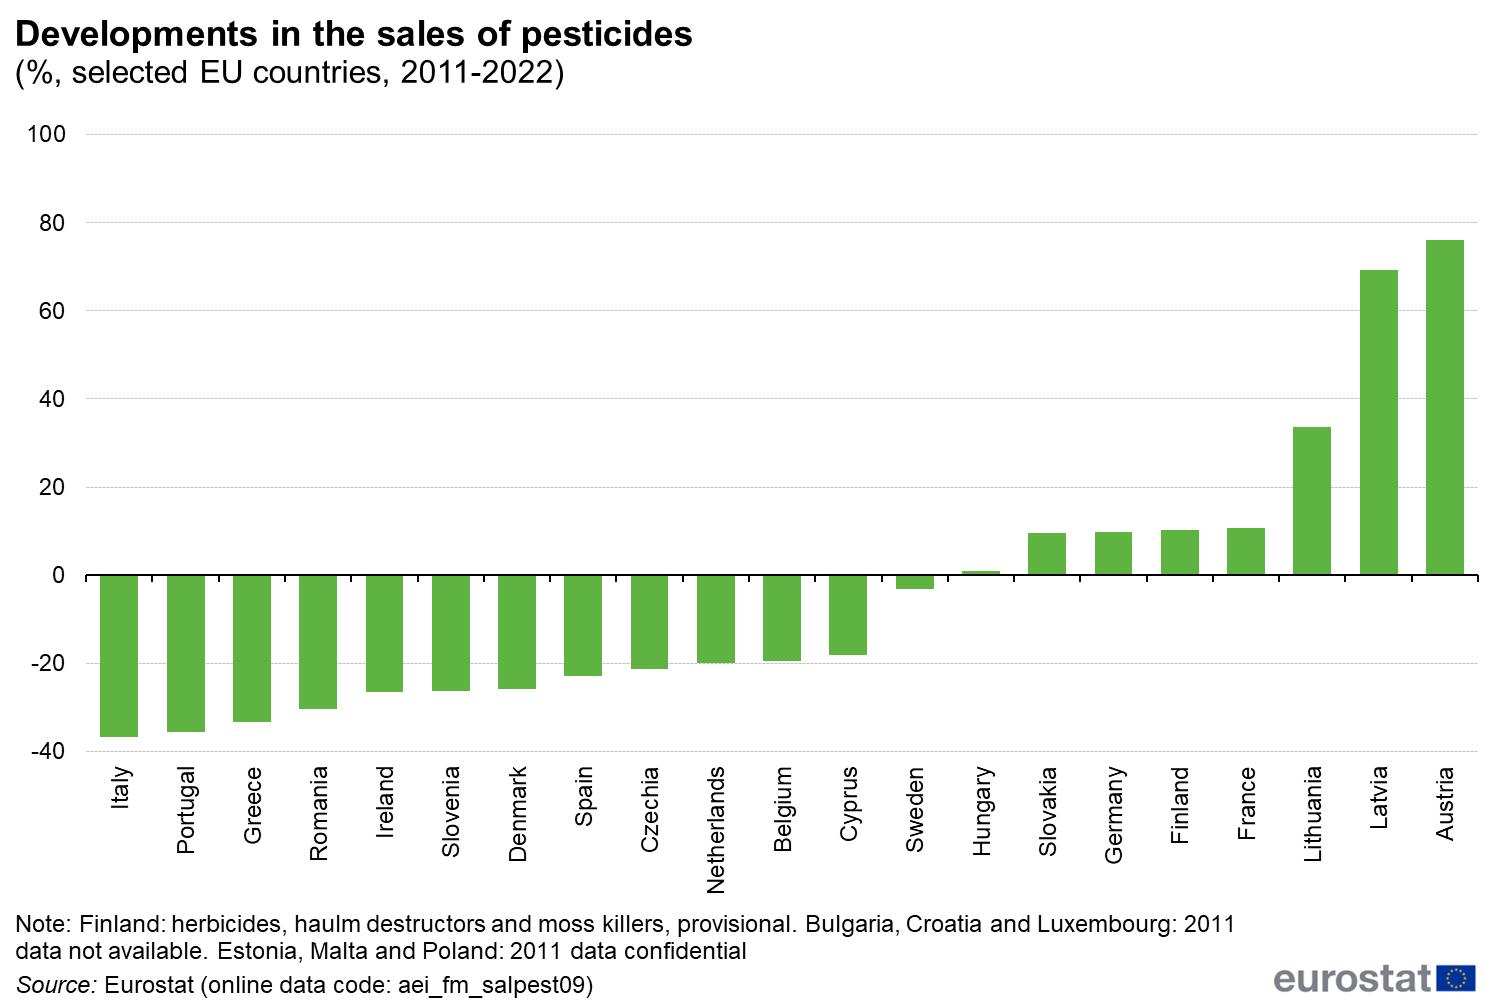
Fig2 Developments in the sales of pesticides (%, selected EU countries, 2011-2022) 1.png
(
file
)
66 KB
1
16:40, 15 May 2024
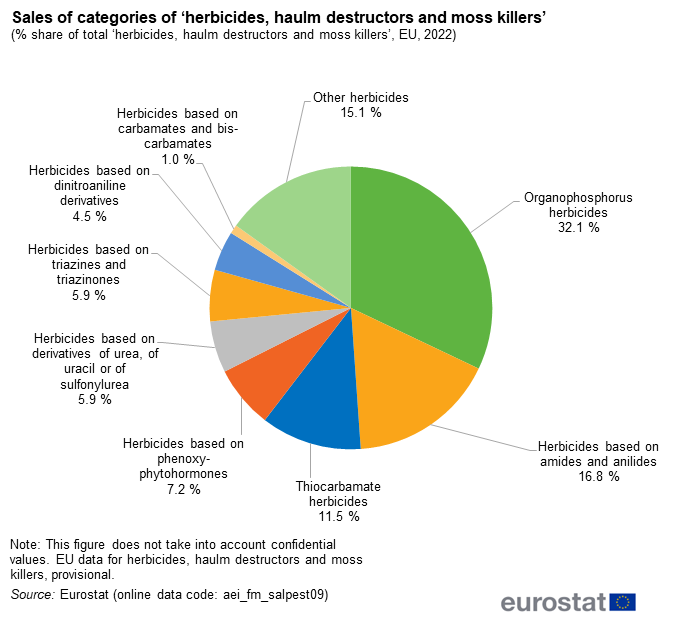
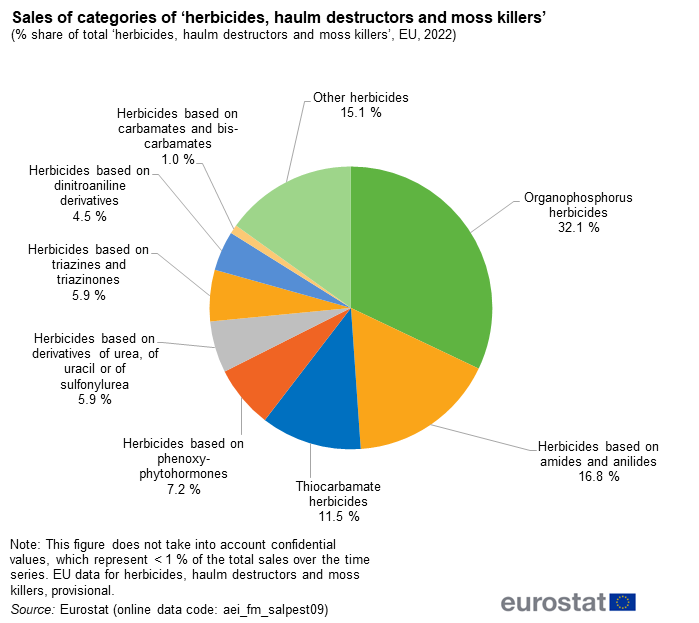
Fig4 Sales of categories of ‘herbicides, haulm destructors and moss killers’ (% share of total ‘herbicides, haulm destructors and moss killers’, EU, 2022).png
(
file
)
40 KB
null
1
16:40, 15 May 2024
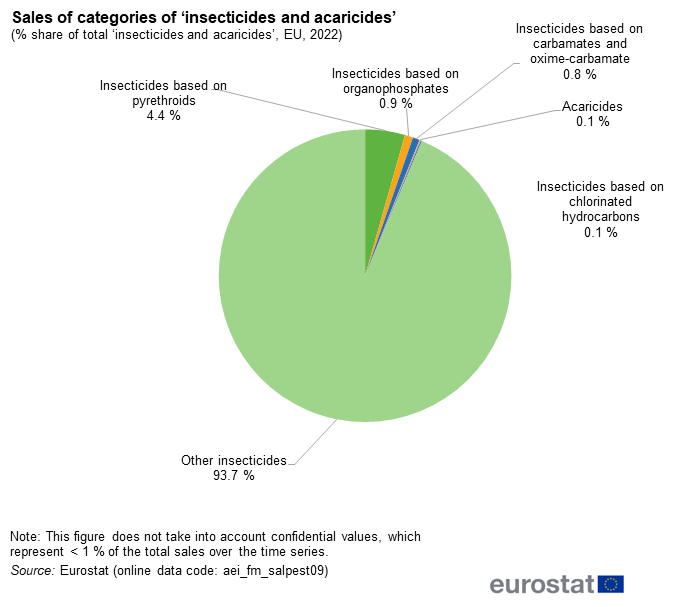
Fig5 Sales of categories of ‘insecticides and acaricides’ (% share of total ‘insecticides and acaricides’, EU, 2022).png
(
file
)
30 KB
null
1
16:40, 15 May 2024
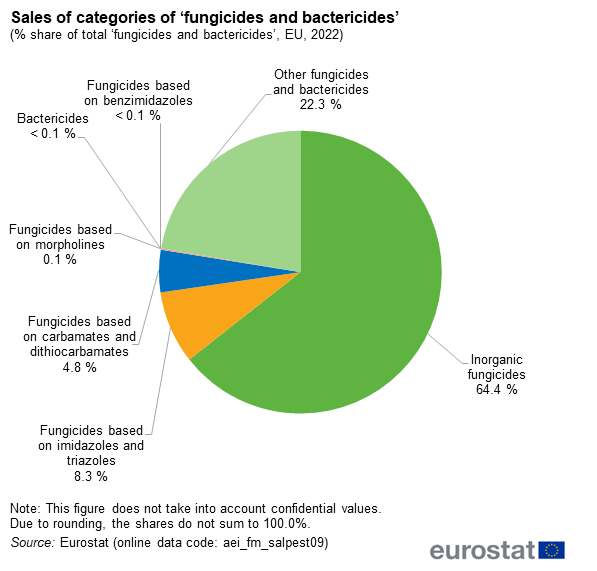
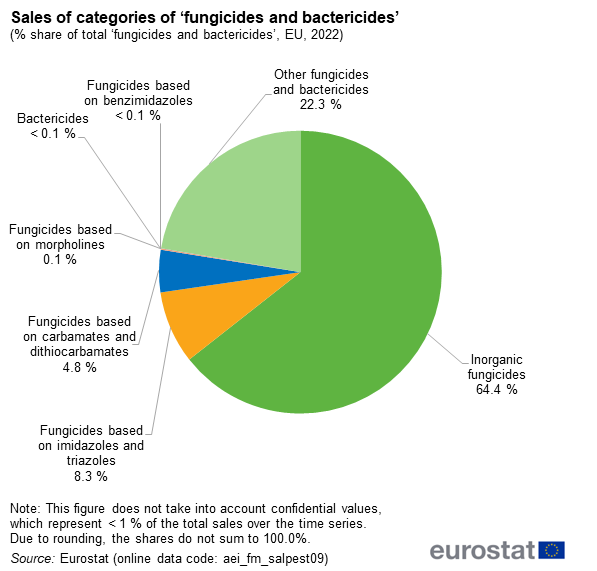
Fig3 Sales of categories of ‘fungicides and bactericides’ (% share of total ‘fungicides and bactericides’, EU, 2022).png
(
file
)
32 KB
null
1
16:22, 14 May 2024
20240514 Consumption of pesticides tables and figures 1.xlsx
(
file
)
145 KB
1
16:22, 14 May 2024
Fig5 Sales of categories of ‘herbicides, haulm destructors and moss killers’ (% share of total ‘herbicides, haulm destructors and moss killers’, EU, 2022) 1.png
(
file
)
41 KB
1
15:23, 14 May 2024
Fig5 Sales of categories of ‘herbicides, haulm destructors and moss killers’ (% share of total ‘herbicides, haulm destructors and moss killers’, EU, 2022).png
(
file
)
41 KB
null
1
15:23, 14 May 2024
20240514 Consumption of pesticides tables and figures.xlsx
(
file
)
145 KB
null
1
15:22, 14 May 2024
Tab1 Sales of pesticides (tonnes, 2011 and 2022).png
(
file
)
71 KB
null
1
15:22, 14 May 2024
Fig6 Sales of categories of ‘insecticides and acaricides’ (% share of total ‘insecticides and acaricides’, EU, 2022).png
(
file
)
31 KB
null
1
15:22, 14 May 2024
Fig4 Sales of categories of ‘fungicides and bactericides’ (% share of total ‘fungicides and bactericides’, EU, 2022).png
(
file
)
33 KB
null
1
15:22, 14 May 2024
Fig3 Developments in the sales of pesticides (%, selected EU countries, 2018-2022).png
(
file
)
34 KB
null
1
15:22, 14 May 2024
Fig2 Developments in the sales of pesticides (%, selected EU countries, 2011-2022).png
(
file
)
35 KB
null
1
15:22, 14 May 2024
Fig1 Sales of pesticides (tonnes, EU, 2011-2022).png
(
file
)
27 KB
null
1
10:17, 4 May 2023
Tab1 Sales of pesticides (tonnes, 2011 and 2021).png
(
file
)
796 KB
1
10:16, 4 May 2023
Fig5 Sales of categories of ‘insecticides and acaricides’ (% share of total ‘insecticides and acaricides’, EU, 2021).png
(
file
)
75 KB
1
10:16, 4 May 2023
Fig4 Sales of categories of ‘herbicides, haulm destructors and moss killers’ (% share of total ‘herbicides, haulm destructors and moss killers’, EU, 2021).png
(
file
)
100 KB
1
10:16, 4 May 2023
Fig3 Sales of categories of ‘fungicides and bactericides’ (% share of total ‘fungicides and bactericides’, EU, 2021).png
(
file
)
83 KB
1
10:15, 4 May 2023
Fig2 Developments in the sales of pesticides (%, selected EU countries, 2011-2021).png
(
file
)
88 KB
1
10:14, 4 May 2023
Fig1 Sales of pesticides (tonnes, EU, 2011-2021).png
(
file
)
63 KB
1
10:14, 4 May 2023
20230504 Consumption of pesticides tables and figures.xlsx
(
file
)
130 KB
1
11:53, 26 April 2022
Fig5 Share of sales of 'insecticides and acaricides' by category of products, EU, 2020 (% of total 'insecticides and acaricides') new.png
(
file
)
38 KB
1
11:53, 26 April 2022
Fig4 Share of sales of 'herbicides, haulm destructors and moss killers' by category of products, EU, 2020 (% of total 'herbicides, haulm destructors and moss killers') new.png
(
file
)
49 KB
1
11:51, 26 April 2022
Fig3 Share of sales of 'fungicides and bactericides' by category of products, EU, 2020 (% of total 'fungicides and bactericides') new.png
(
file
)
41 KB
1
11:50, 26 April 2022
Tab1 Sales of pesticides, by country, 2011 and 2020 (tonnes) new.png
(
file
)
93 KB
1
11:17, 26 April 2022
20220426 Consumption of pesticides tables and figures.xlsx
(
file
)
115 KB
1
11:15, 26 April 2022
Fig5 Share of sales of 'insecticides and acaricides' by category of products, EU, 2020 (% of total 'insecticides and acaricides').png
(
file
)
38 KB
null
1
11:15, 26 April 2022
Fig4 Share of sales of 'herbicides, haulm destructors and moss killers' by category of products, EU, 2020 (% of total 'herbicides, haulm destructors and moss killers').png
(
file
)
49 KB
null
1
11:15, 26 April 2022
Fig3 Share of sales of 'fungicides and bactericides' by category of products, EU, 2020 (% of total 'fungicides and bactericides').png
(
file
)
41 KB
null
1
10:20, 26 April 2022
Fig4 Share of sales of 'Herbicides, haulm destructors and moss killers' by category of product, EU, 2020 (% of total 'Herbicides, haulm destructors and moss killers').png
(
file
)
49 KB
1
10:20, 26 April 2022
Fig3 Share of sales of 'Fungicides and bactericides' by category of product, EU, 2020 (% of total 'Fungicides and bactericides').png
(
file
)
41 KB
1
10:17, 26 April 2022
Fig5 Share of sales of 'Insecticides and acaricides' by category of product, EU, 2020 (% of total 'Insecticides and acaricides').png
(
file
)
38 KB
null
1
10:17, 26 April 2022
Fig2 Sales of pesticides, 16 EU Member States, percentage change 2020 compared with 2011.png
(
file
)
49 KB
null
1
10:17, 26 April 2022
Fig1 Sales of pesticides, EU, 2011-2020 (tonnes).png
(
file
)
34 KB
null
1
10:16, 26 April 2022
Tab1 Sales of pesticides, by country, 2011 and 2020 (tonnes).png
(
file
)
93 KB
1
20:28, 15 April 2021
20210415 Consumption of pesticides tables and figures.xlsx
(
file
)
101 KB
1
20:27, 15 April 2021
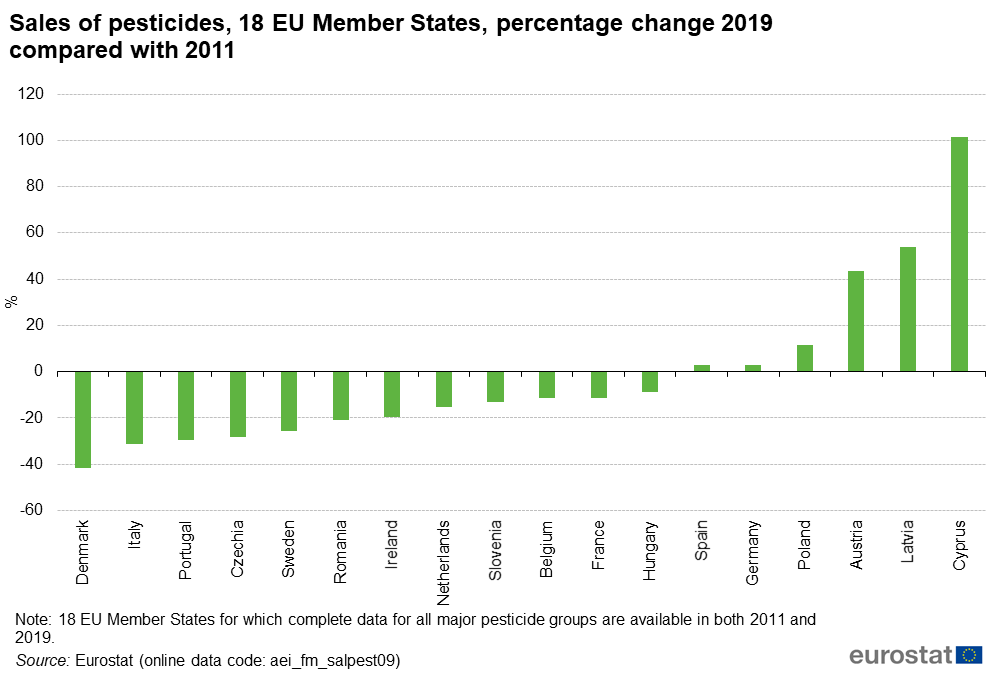
Fig2 Sales of pesticides, 18 EU Member States, percentage change 2019 compared with 2011.png
(
file
)
50 KB
1
10:57, 15 April 2021
20210414 Consumption of pesticides tables and figures.xlsx
(
file
)
101 KB
1
10:52, 15 April 2021
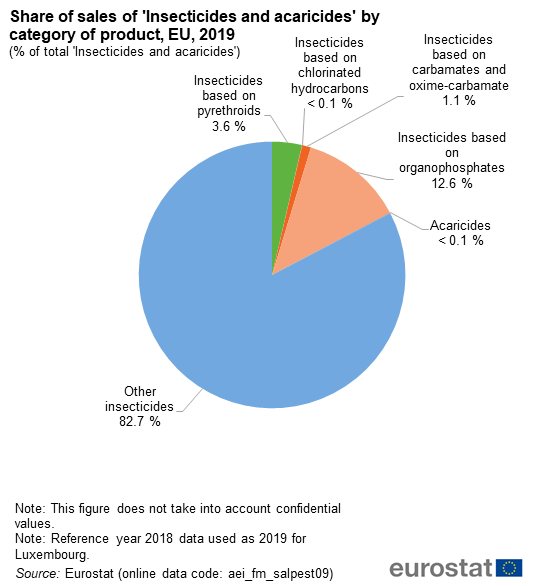
Fig5 Share of sales of 'Insecticides and acaricides' by category of product, EU, 2019 (% of total 'Insecticides and acaricides').png
(
file
)
40 KB
1
10:51, 15 April 2021
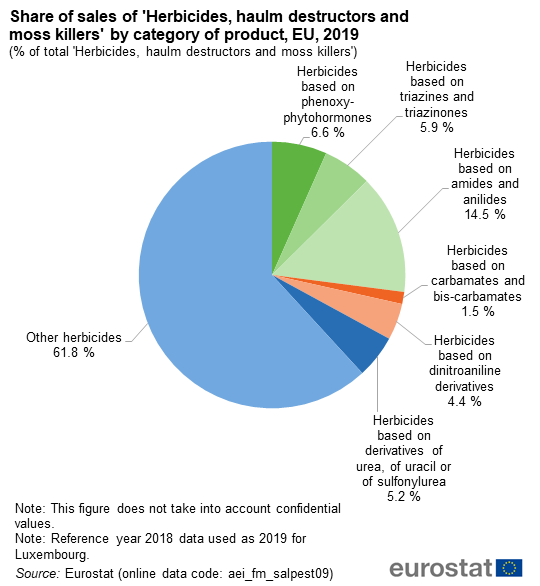
Fig4 Share of sales of 'Herbicides, haulm destructors and moss killers' by category of product, EU, 2019 (% of total 'Herbicides, haulm destructors and moss killers').png
(
file
)
46 KB
1
10:51, 15 April 2021
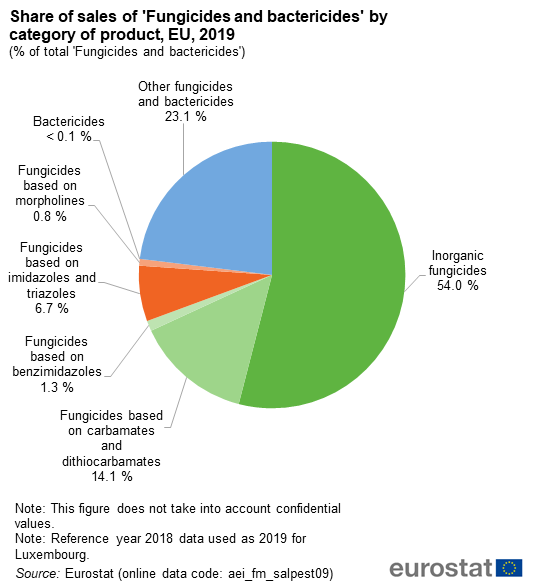
Fig3 Share of sales of 'Fungicides and bactericides' by category of product, EU, 2019 (% of total 'Fungicides and bactericides').png
(
file
)
43 KB
1
10:50, 15 April 2021
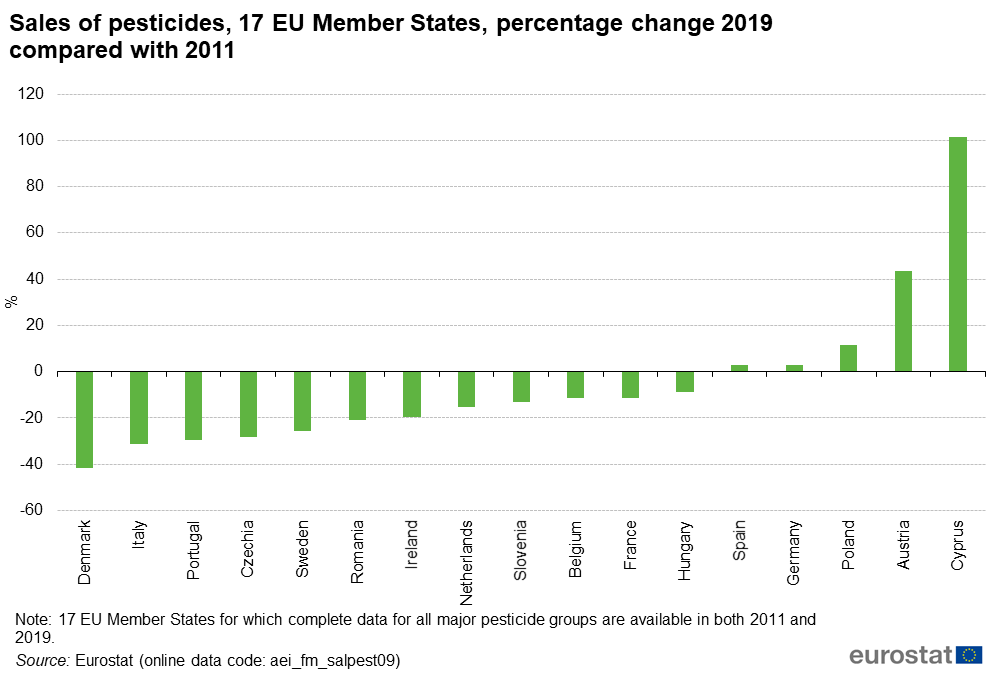
Fig2 Sales of pesticides, 17 EU Member States, percentage change 2019 compared with 2011.png
(
file
)
49 KB
1
10:49, 15 April 2021
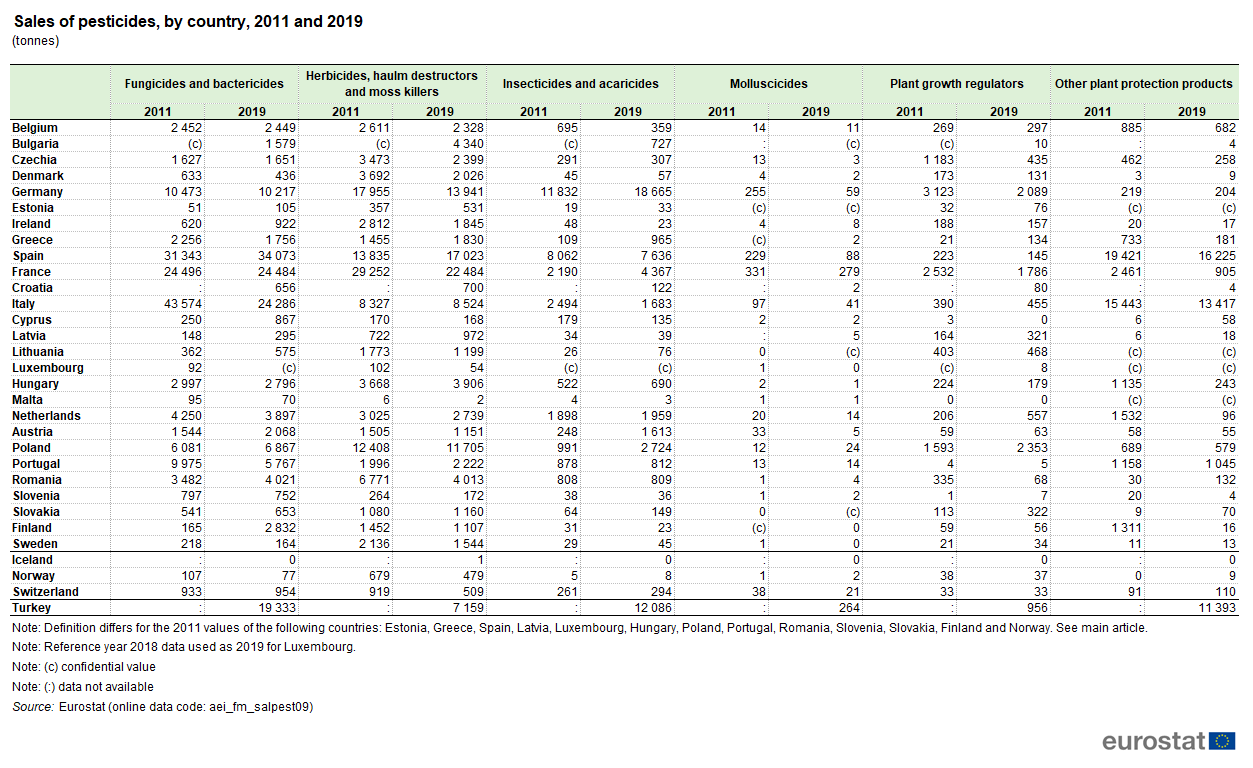
Tab1 Sales of pesticides, by country, 2011 and 2019 (tonnes).png
(
file
)
93 KB
1
10:49, 15 April 2021
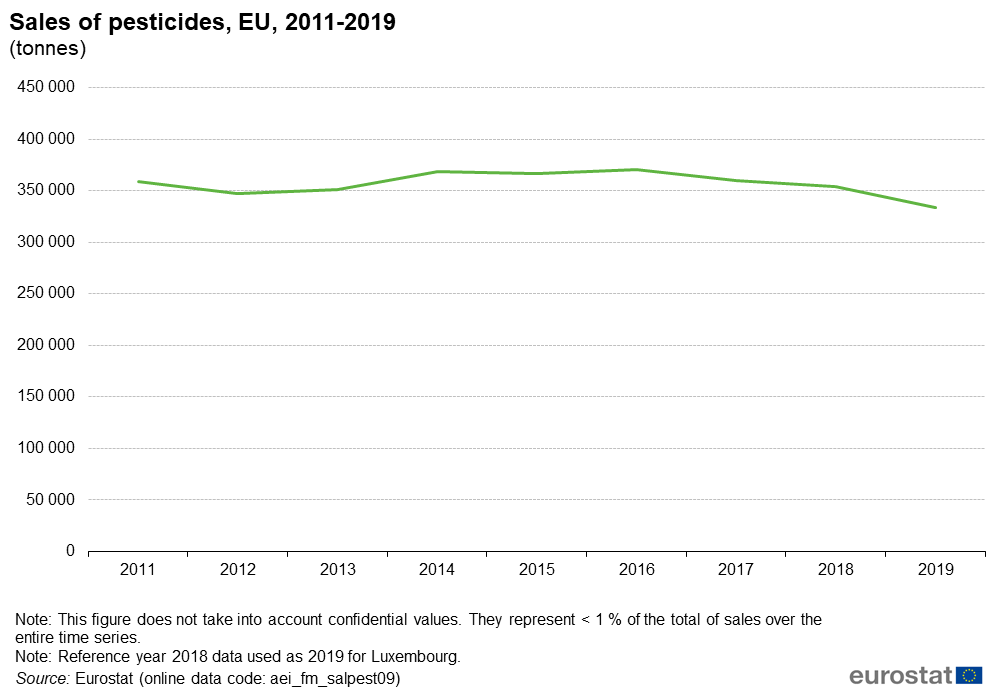
Fig1 Sales of pesticides, EU, 2011-2019 (tonnes).png
(
file
)
37 KB
1
07:31, 21 January 2021
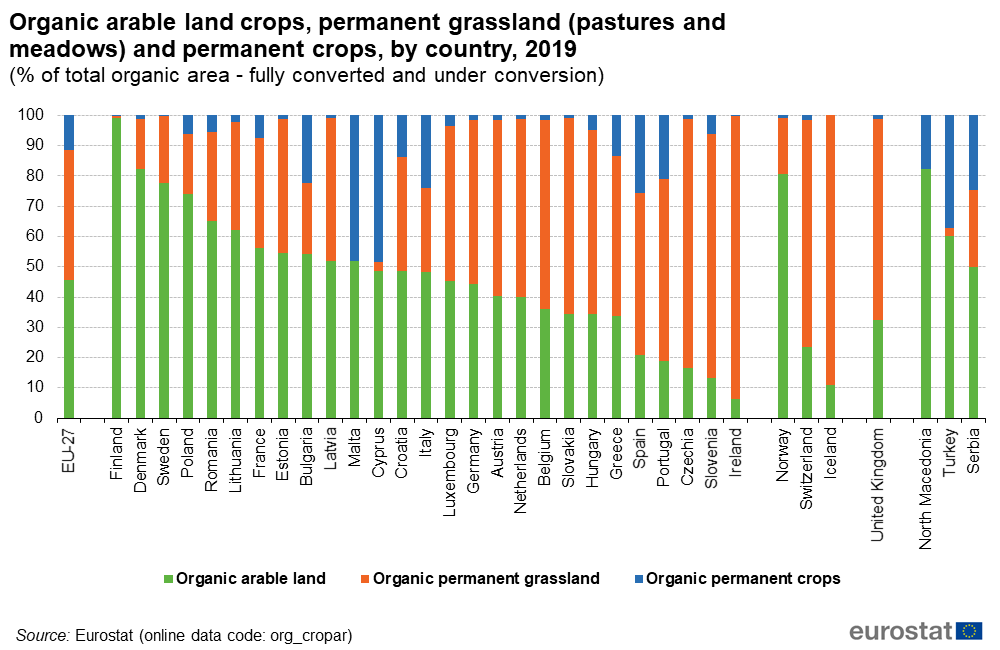
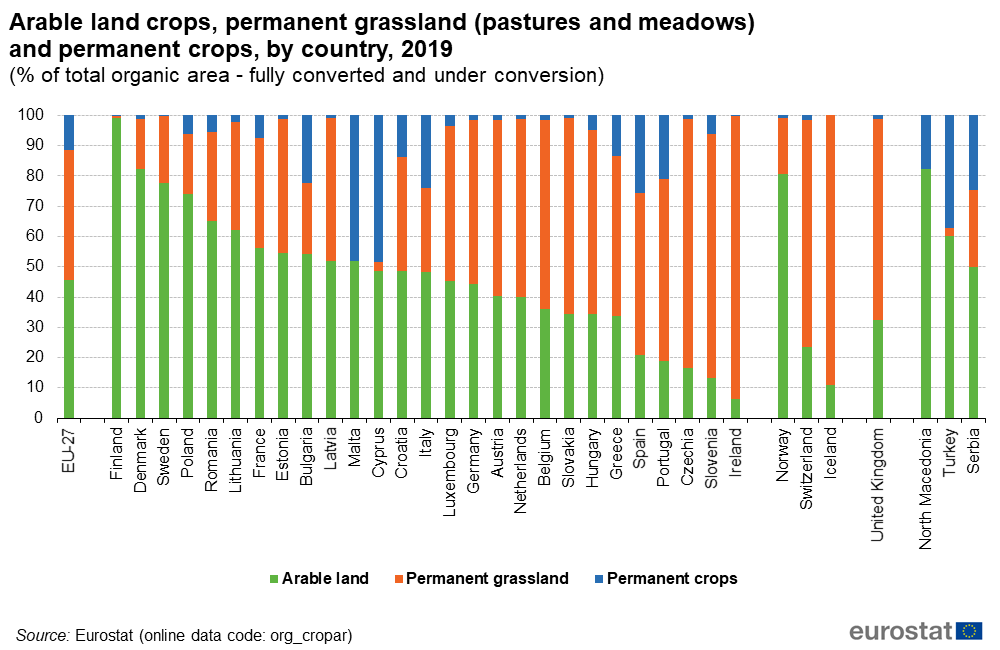
Fig5 Organic arable land crops, permanent grassland (pastures and meadows) and permanent crops, by country, 2019 (% of total organic area - fully converted and under conversion).png
(
file
)
89 KB
1
08:40, 15 January 2021
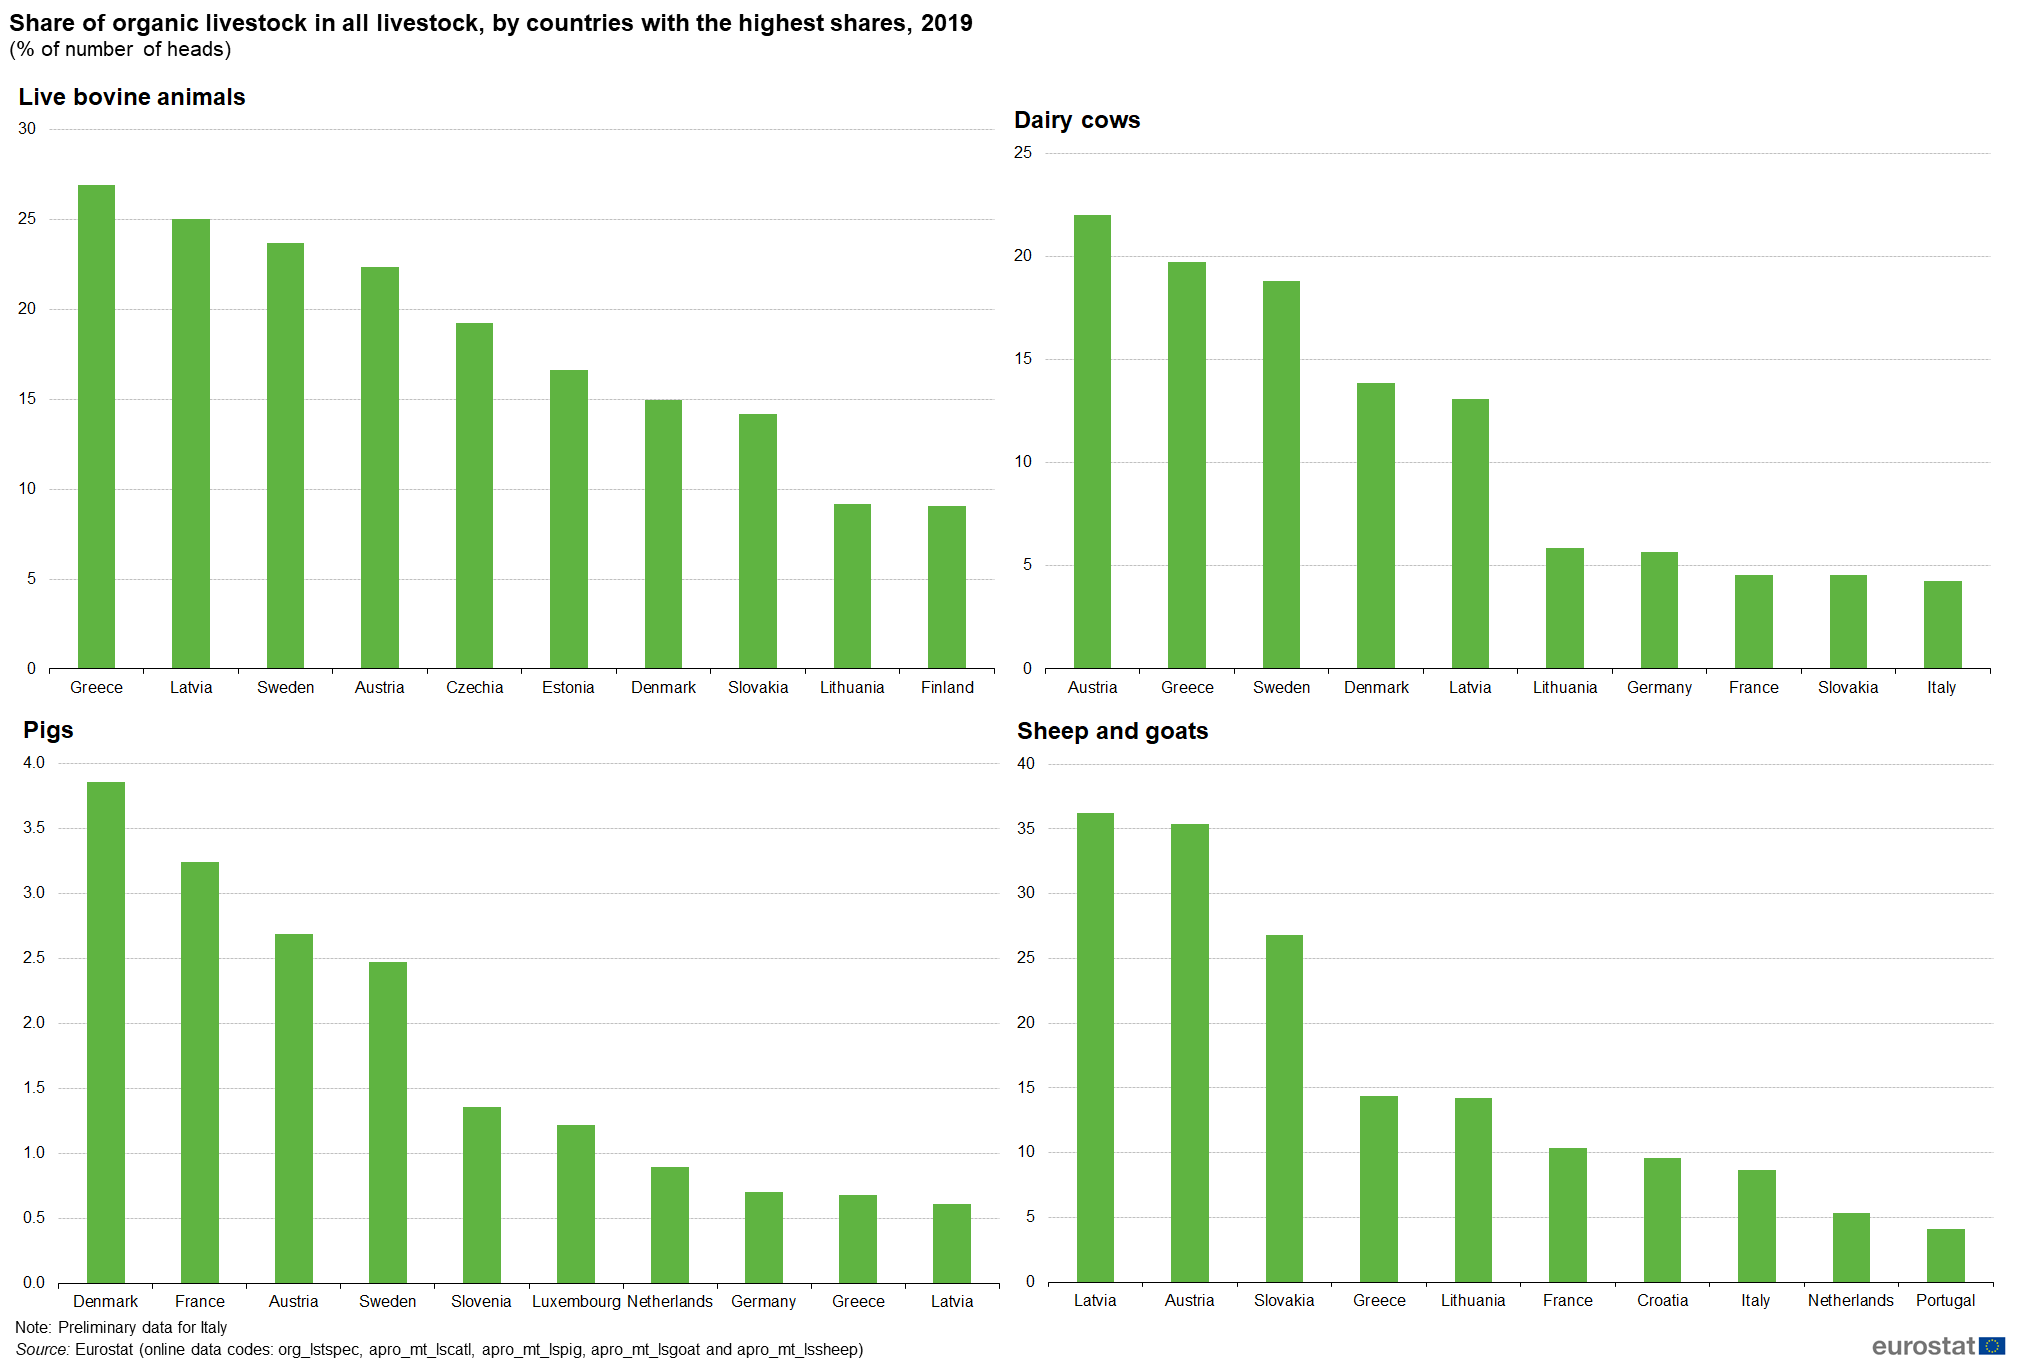
Fig6 Share of organic livestock in all livestock, by countries with the highest shares, 2019 (% of number of heads).png
(
file
)
135 KB
1
08:39, 15 January 2021
Fig5 Arable land crops, permanent grassland (pastures and meadows) and permanent crops, by country, 2019 (% of total organic area - fully converted and under conversion).png
(
file
)
88 KB
1
First page
Previous page
Next page
Last page
Special page
ISSN 2443-8219
_rev.png)
_1.png)
.png)
.png)
.png)
_1.png)
.png)
.png)
.png)
.png)
.png)
.png)
.png)
.png)
.png)
.png)
.png)
.png)
.png)
_new.png)
_new.png)
_new.png)
_new.png)
.png)
.png)
.png)
.png)
.png)
.png)

.png)
.png)

.png)
.png)
.png)

.png)
.png)
_and_permanent_crops,_by_country,_2019_(%25_of_total_organic_area_-_fully_converted_and_under_conversion).png)
.png)
_and_permanent_crops,_by_country,_2019_(%25_of_total_organic_area_-_fully_converted_and_under_conversion).png)