Tutorials
Log in
Statistics Explained
menu
search
search
Navigation
Main page
Statistical themes
Glossary
Categories
Statistics 4 beginners
Tutorials
Help
Eurostat home
Education corner
Online publications
Regional yearbook
Sustainable development
Full list
Tools
User contributions
Logs
View user groups
Special pages
search
Navigation
Main page
Statistical themes
Glossary
Categories
Statistics 4 beginners
Tutorials
Help
Eurostat home
Education corner
Online publications
Regional yearbook
Sustainable development
Full list
Tools
User contributions
Logs
View user groups
Special pages
Navigation
Main page
Statistical themes
Glossary
Categories
Statistics 4 beginners
Tutorials
Help
Eurostat home
Education corner
Online publications
Regional yearbook
Sustainable development
Full list
Tools
User contributions
Logs
View user groups
Special pages
Uploads by EXT-A-Redpath
This special page shows all uploaded files.
File list
Items per page:
20
50
100
250
500
Search for media name:
Username:
Include old versions of files
Go
First page
Previous page
Next page
Last page
Date
Name
Thumbnail
Size
Description
Versions
17:46, 7 December 2010
Crime 2011.xls
(
file
)
387 KB
2
12:34, 10 December 2010
Foreign language learning 2011.xls
(
file
)
96 KB
2
10:14, 16 December 2010
R&D personnel 2011.xls
(
file
)
439 KB
1
09:51, 4 January 2011
Agriculture and the environment 2011.xls
(
file
)
411 KB
2
19:29, 3 February 2011
Housing statistics 2011.xls
(
file
)
146 KB
4
11:14, 8 February 2011
Agriculture and environment 2011.xls
(
file
)
400 KB
4
17:31, 8 February 2011
Wages and labour costs 2011.xls
(
file
)
233 KB
11
11:42, 11 February 2011
Government finance 2011.xls
(
file
)
354 KB
4
10:53, 12 April 2011
Consumption of energy 2011.xls
(
file
)
89 KB
5
10:54, 12 April 2011
Energy production and imports 2011.xls
(
file
)
241 KB
6
10:54, 12 April 2011
Renewable energy 2011.xls
(
file
)
81 KB
6
10:58, 12 April 2011
Electricity 2011.xls
(
file
)
61 KB
6
10:00, 10 June 2011
Tertiary education 2011.xls
(
file
)
306 KB
6
17:59, 25 October 2011
Tourism statistics YB2012.xls
(
file
)
349 KB
1
15:30, 13 September 2012
Foreign direct investment YB2013.xls
(
file
)
1 MB
4
09:53, 3 December 2012
Waste statistics YB2013.xls
(
file
)
1.06 MB
1
14:55, 14 January 2013
Carbon dioxide emissions YB2013.xls
(
file
)
190 KB
1
09:18, 7 February 2013
Unemployment and beyond YB2013.xls
(
file
)
152 KB
1
14:23, 6 May 2013
DG signature.png
(
file
)
42 KB
1
15:18, 13 May 2013
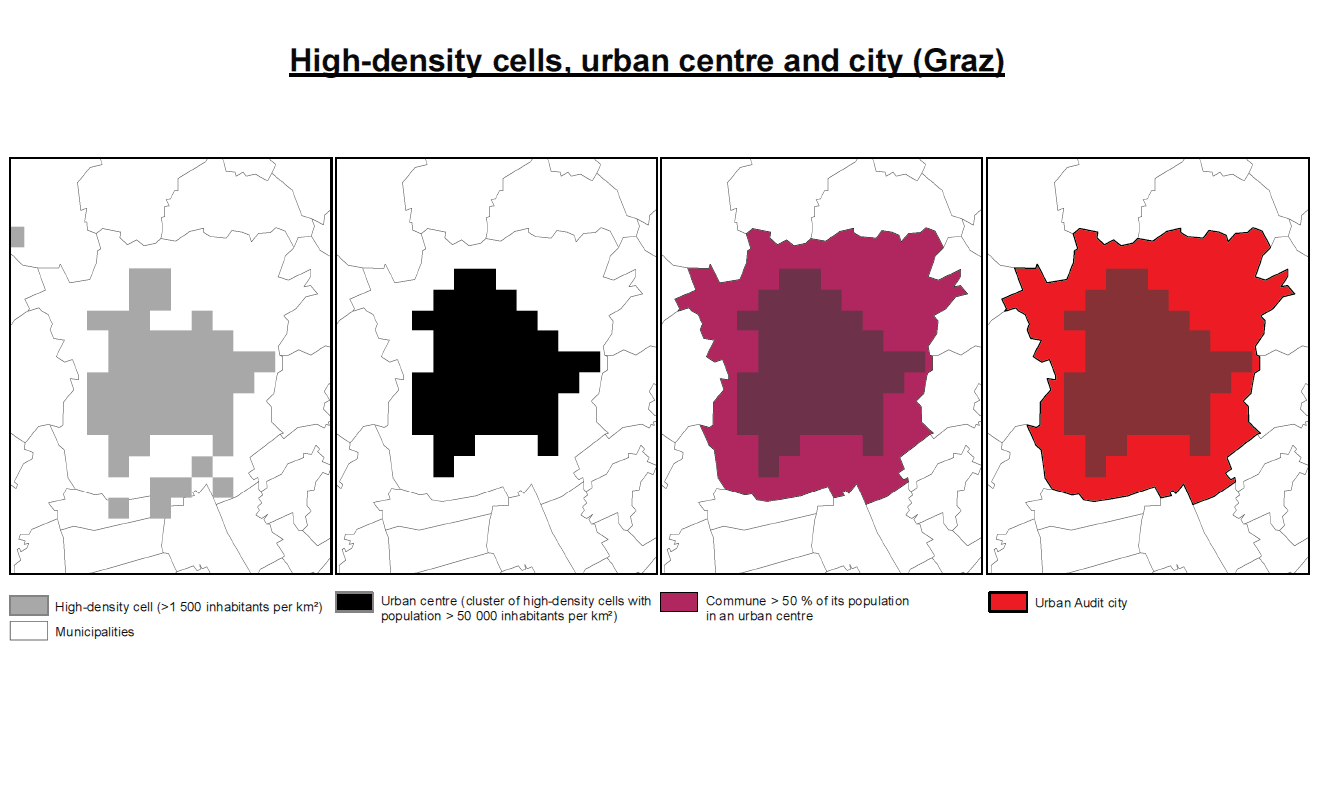
Defining a city — high-density cells, urban centre and city (Graz, Austria).png
(
file
)
68 KB
Reverted to version as of 13:14, 13 May 2013
3
15:19, 13 May 2013
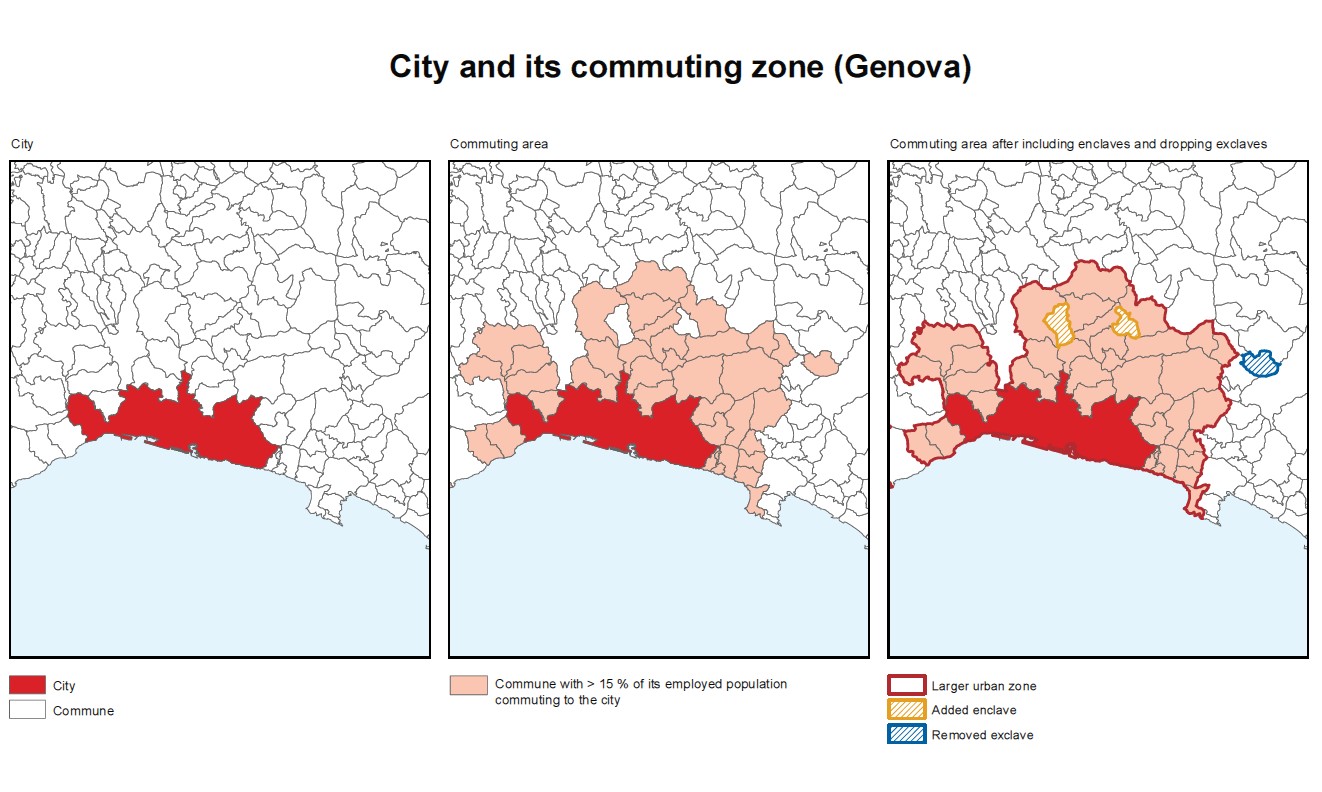
How to define a city and its commuting zone (Genova, Italy).png
(
file
)
236 KB
1
15:29, 13 May 2013
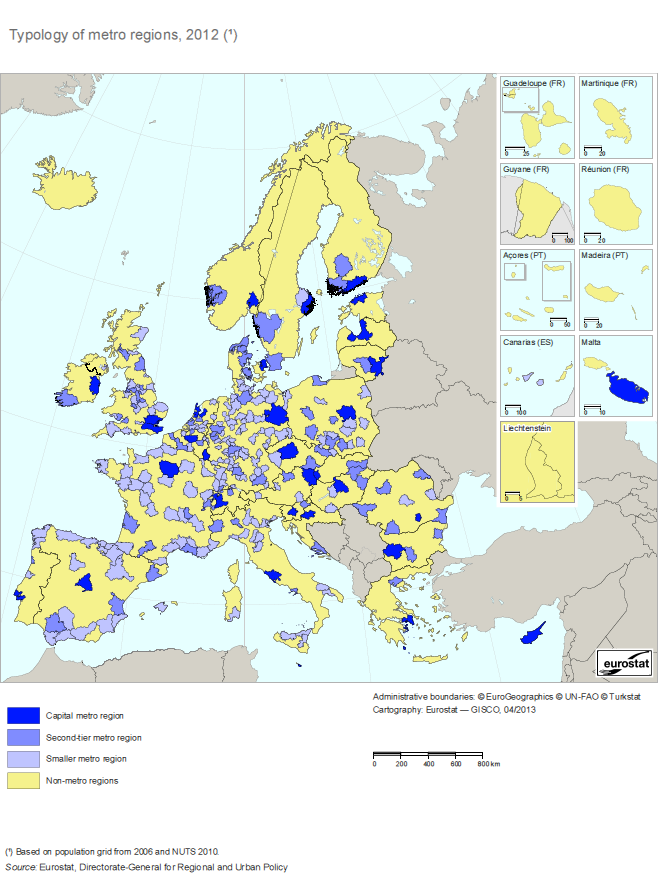
Typology of metro regions, 2012 (1).png
(
file
)
191 KB
2
09:31, 6 June 2013
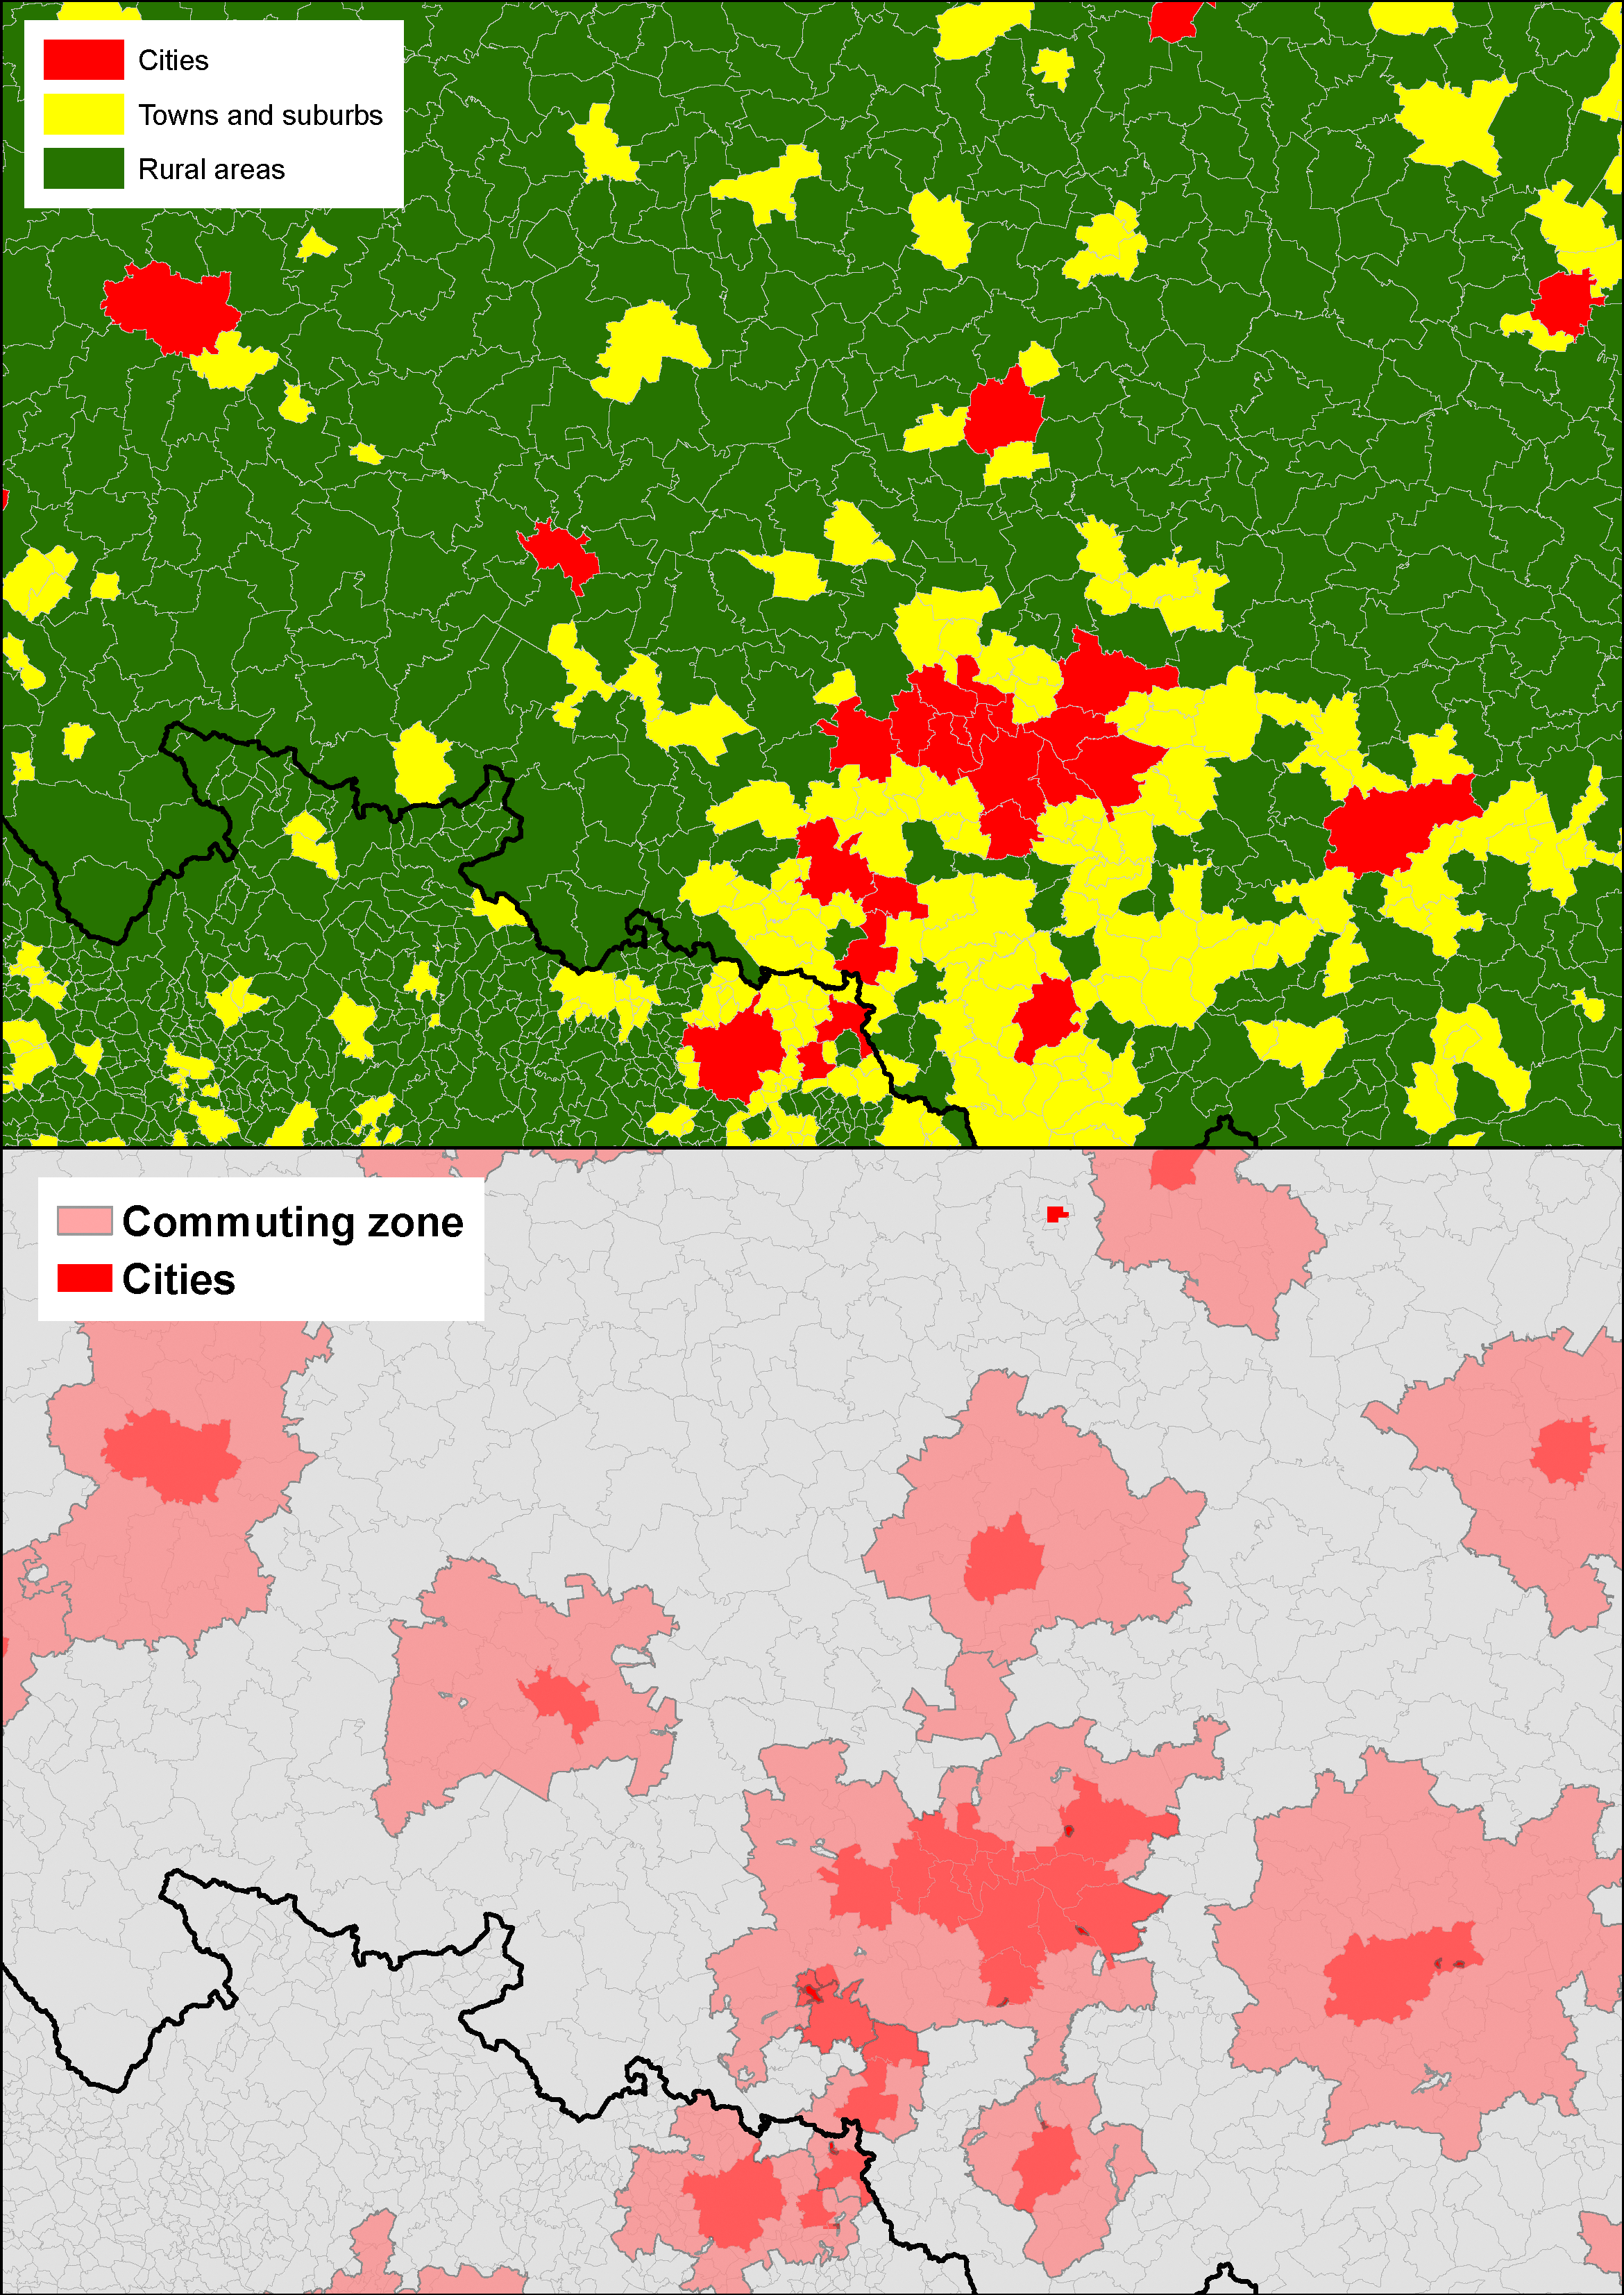
Cities and commuting zones compared with the degree of urbanisation on the Polish–Slovakian border.png
(
file
)
2.96 MB
4
10:05, 6 June 2013
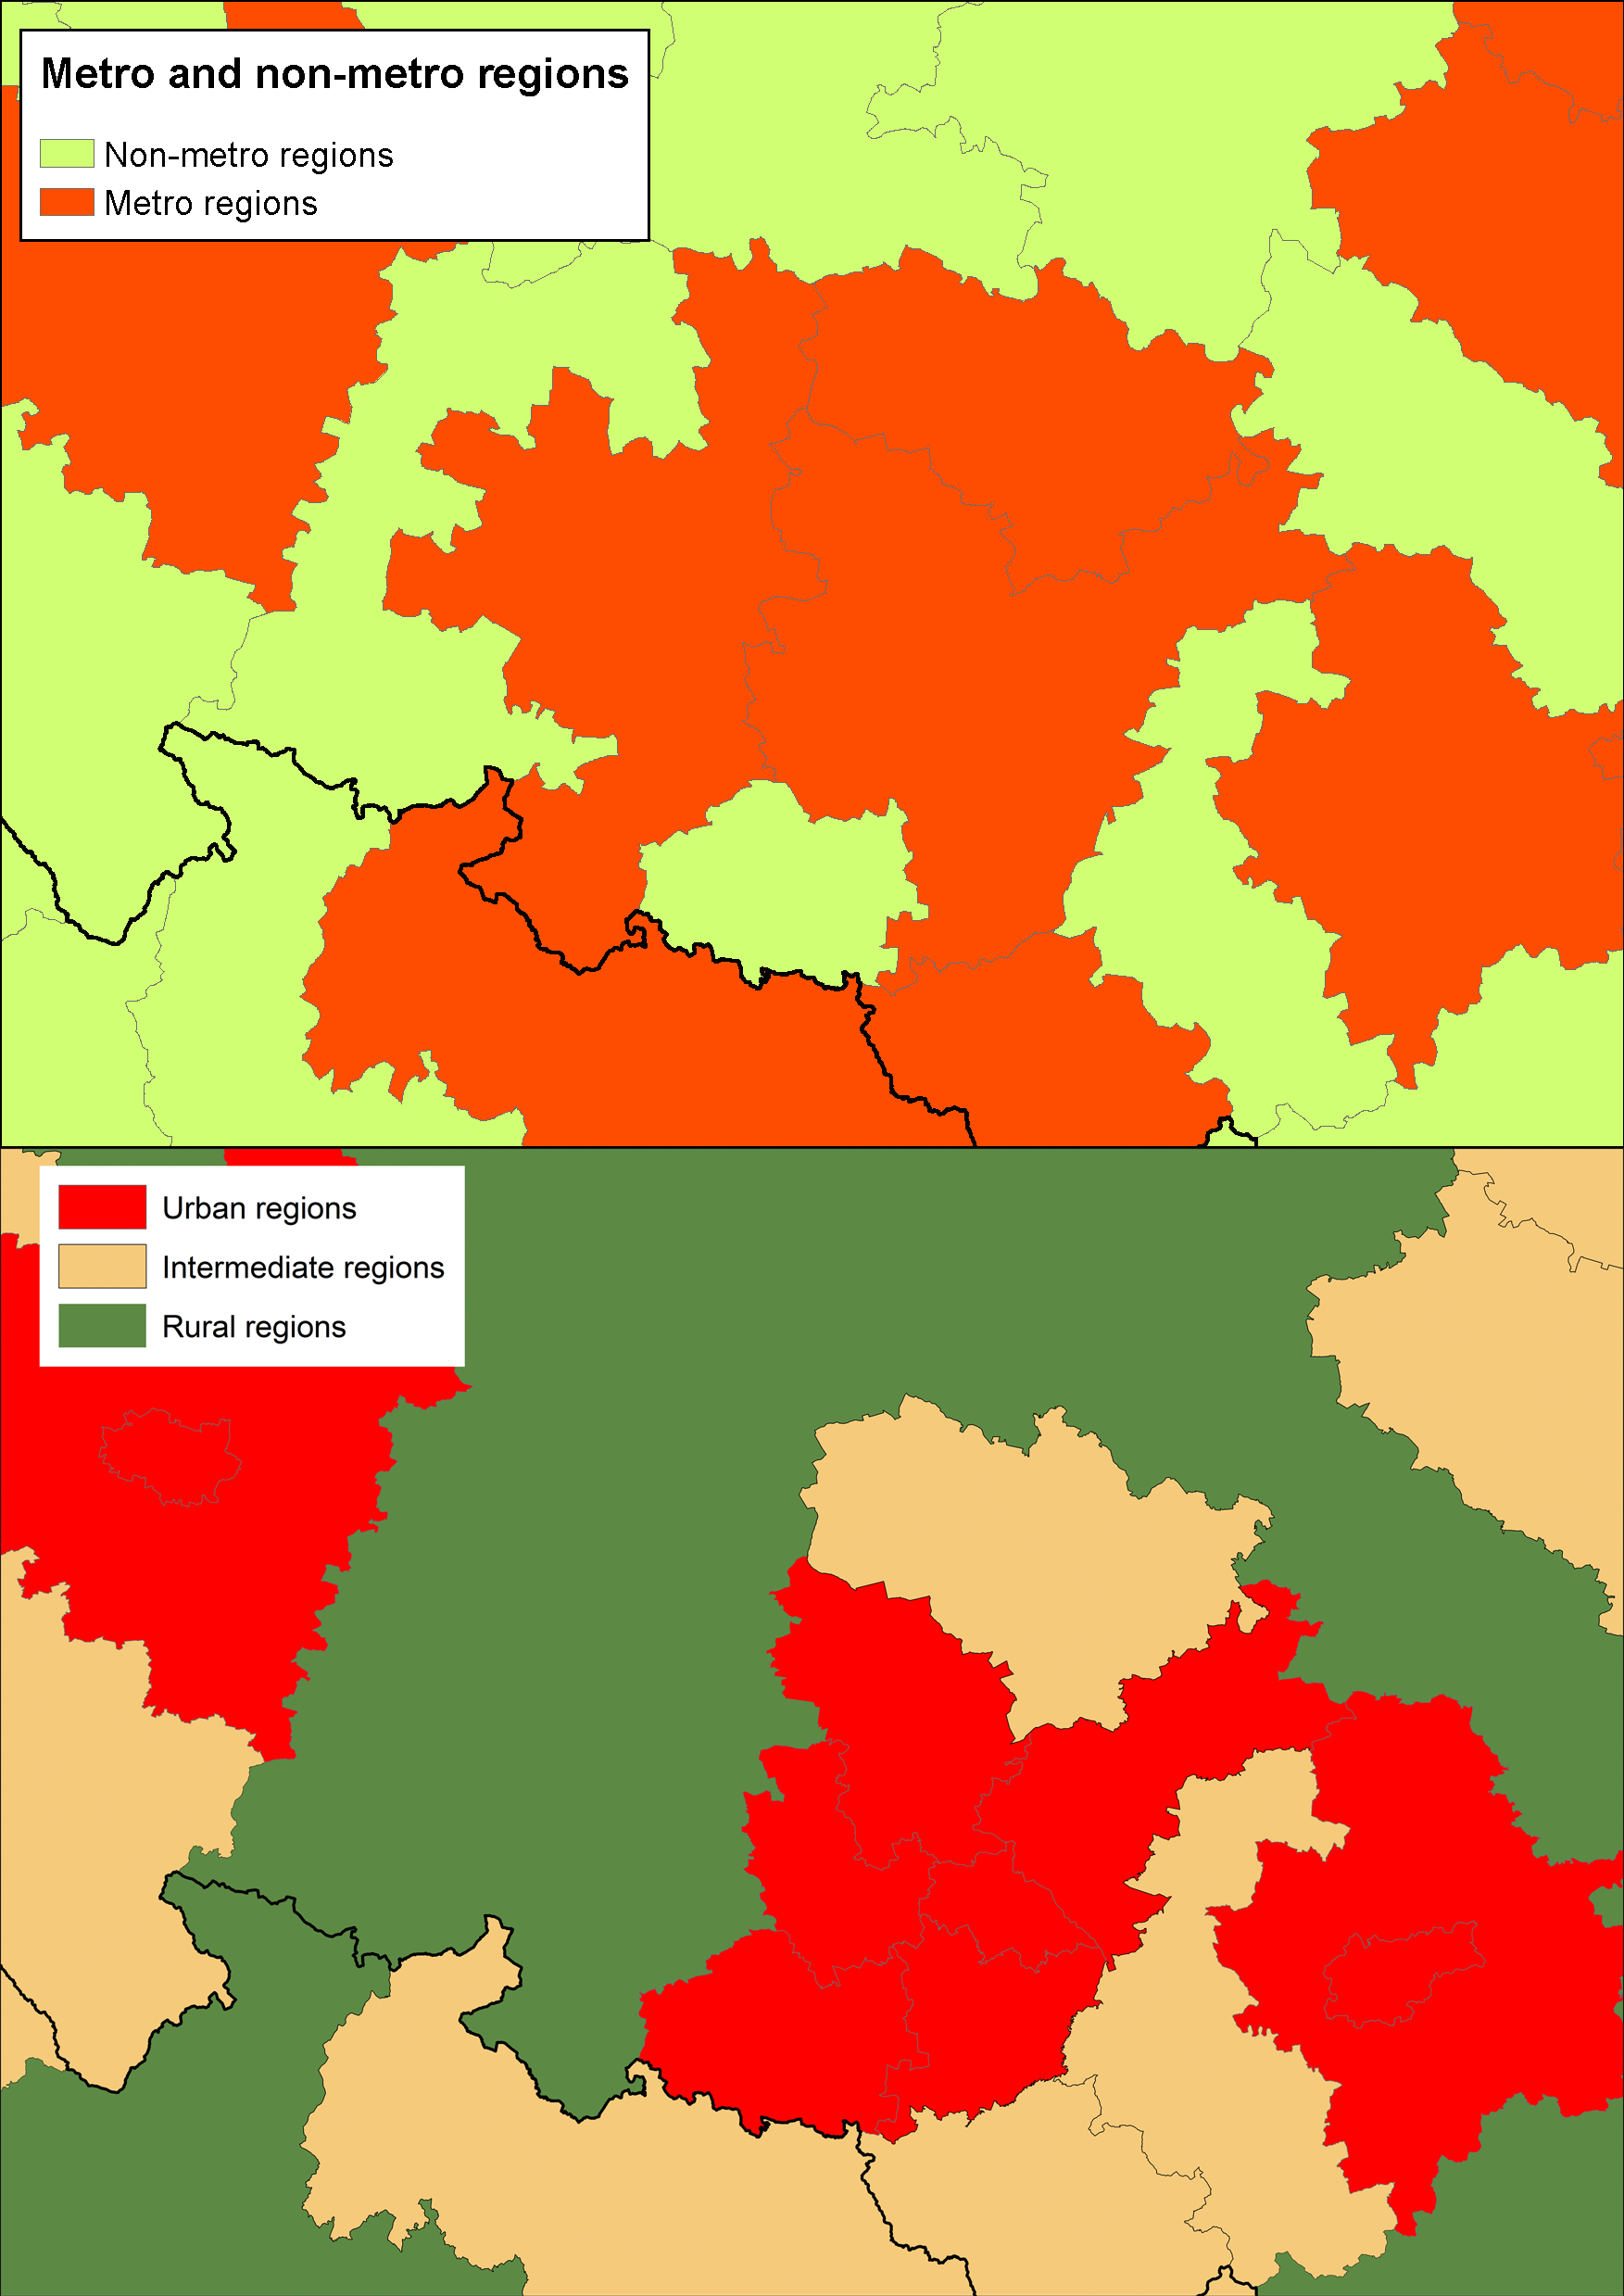
Metro and non-metro regions compared with the urban–rural typology on the Polish–Slovakian border.png
(
file
)
812 KB
2
16:21, 6 June 2013
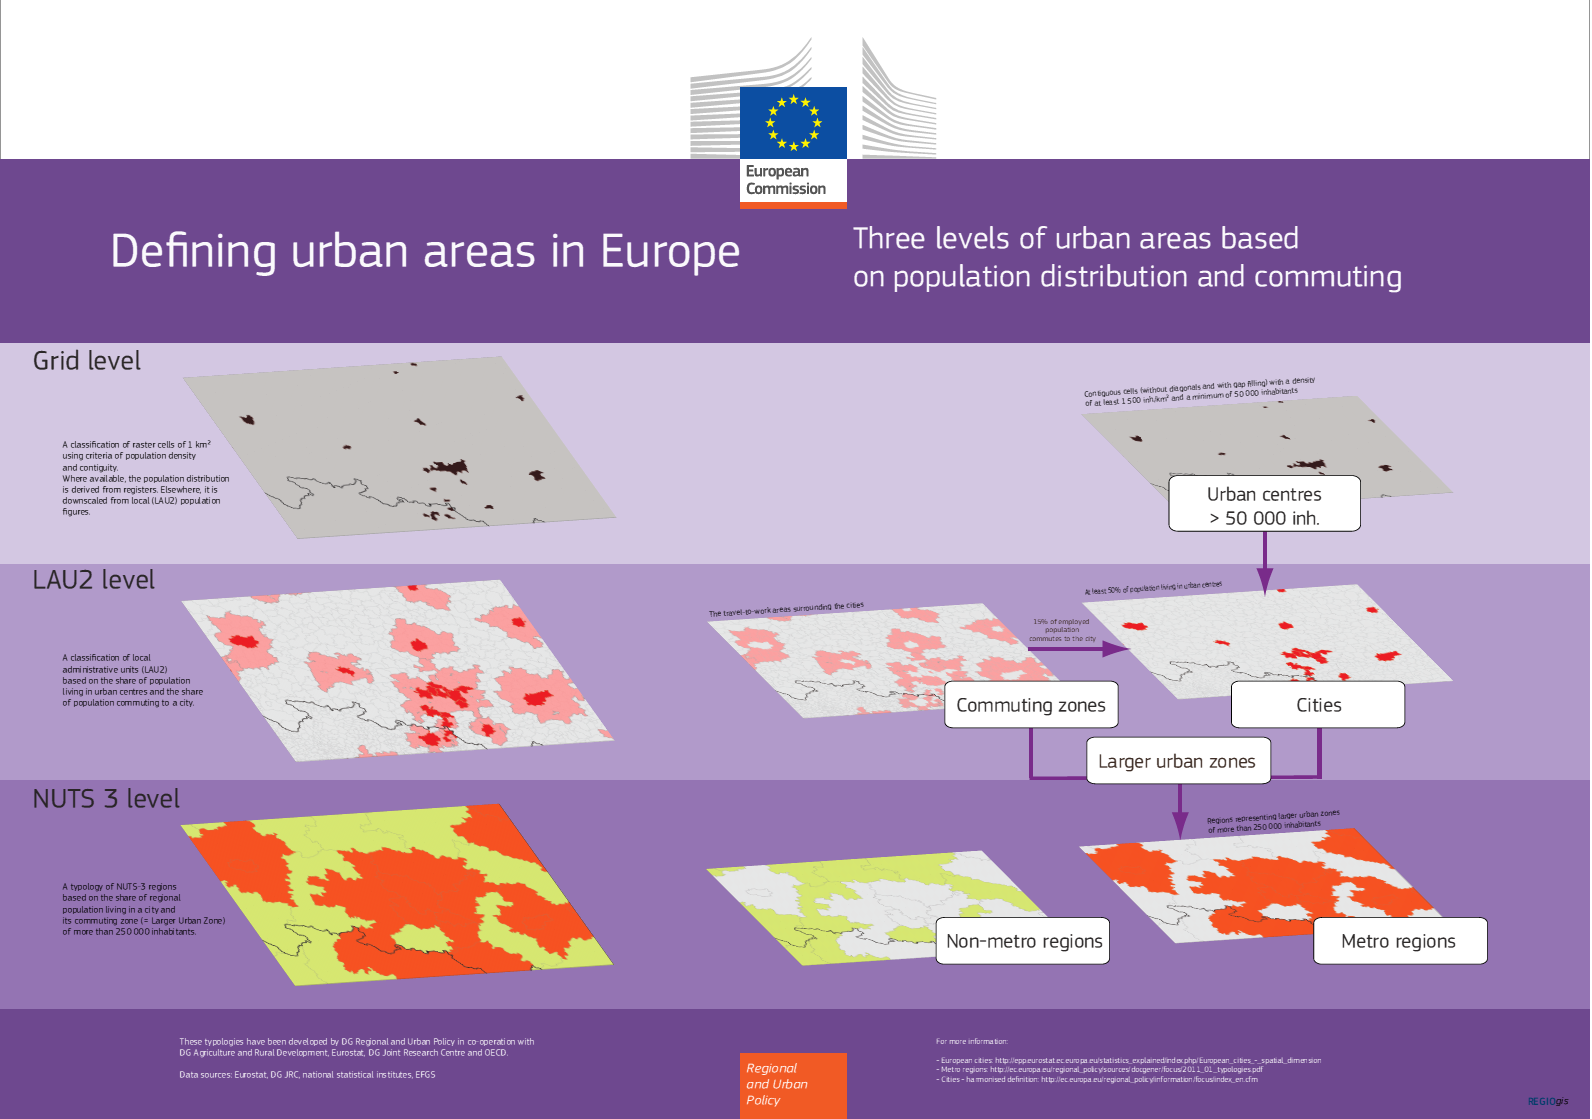
Defining urban areas in Europe.png
(
file
)
381 KB
1
17:28, 12 June 2013
Labour market RYB2013.xls
(
file
)
390 KB
4
17:29, 12 June 2013
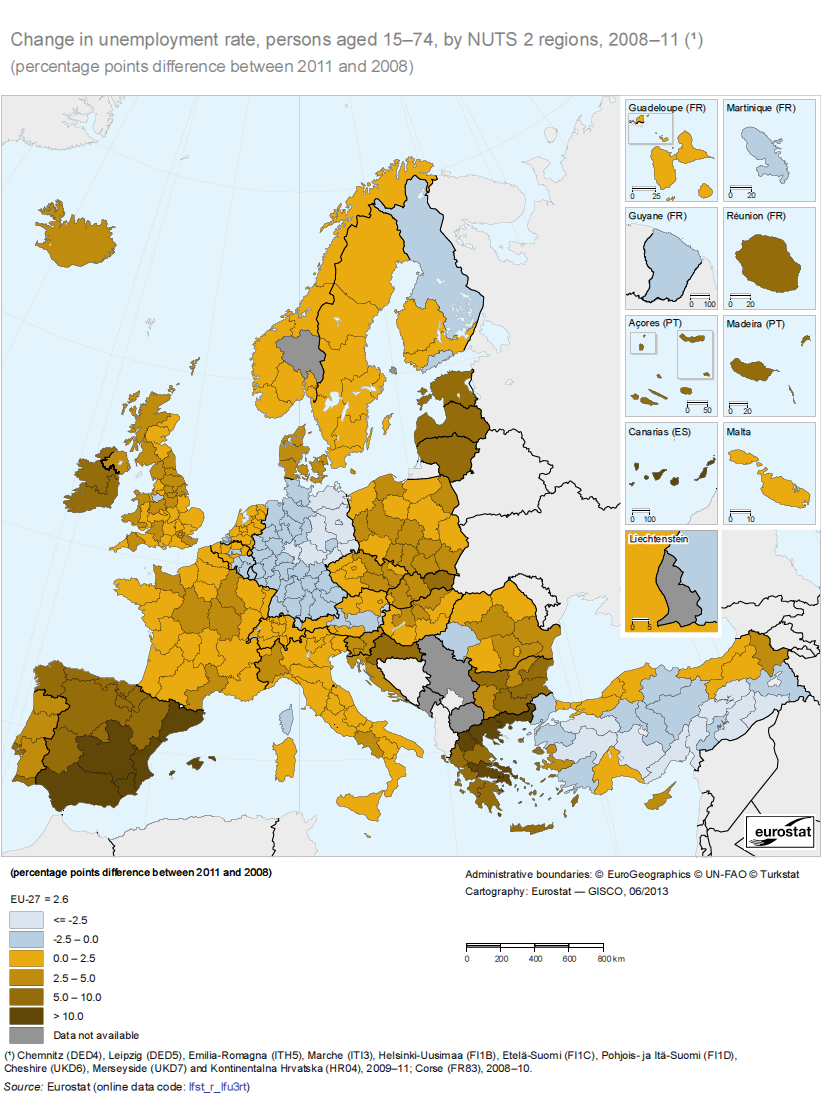
Change in unemployment rate, persons aged 15–74, by NUTS 2 regions, 2008–11 (1) (percentage points difference between 2011 and 2008).png
(
file
)
271 KB
2
17:29, 12 June 2013
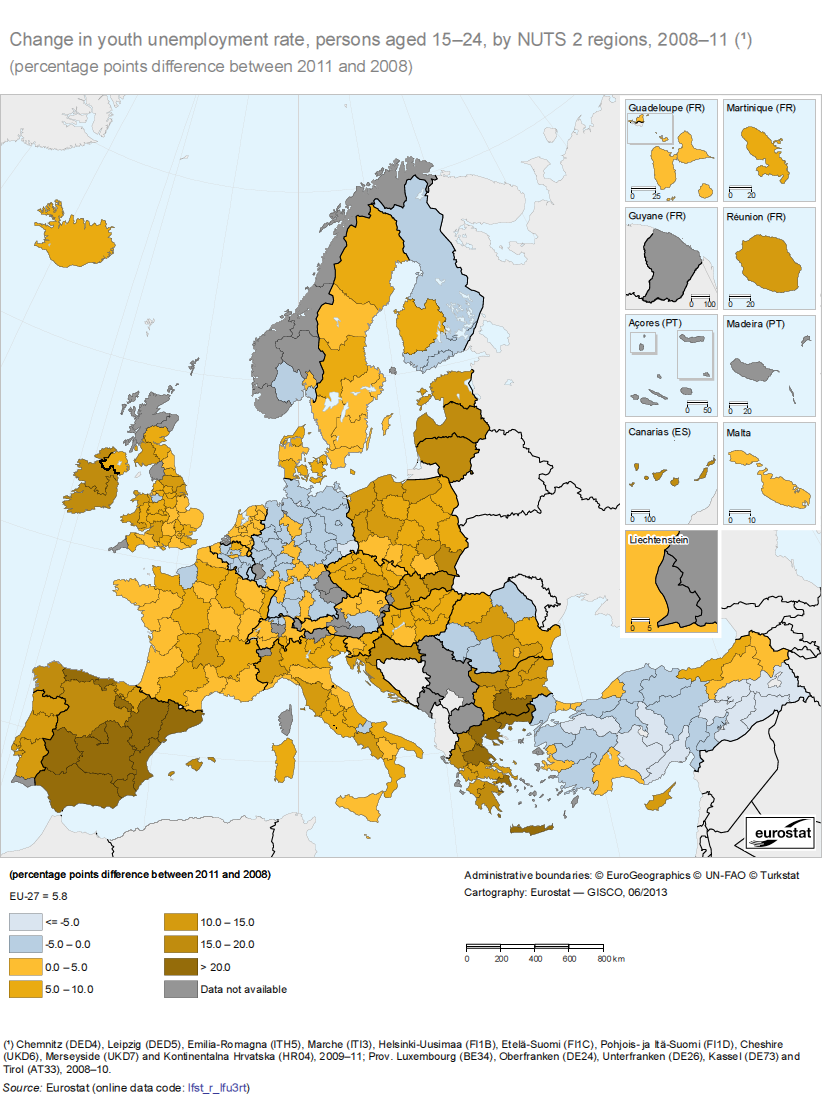
Change in youth unemployment rate, persons aged 15–24, by NUTS 2 regions, 2008–11 (1) (percentage points difference between 2011 and 2008).png
(
file
)
274 KB
2
17:29, 12 June 2013
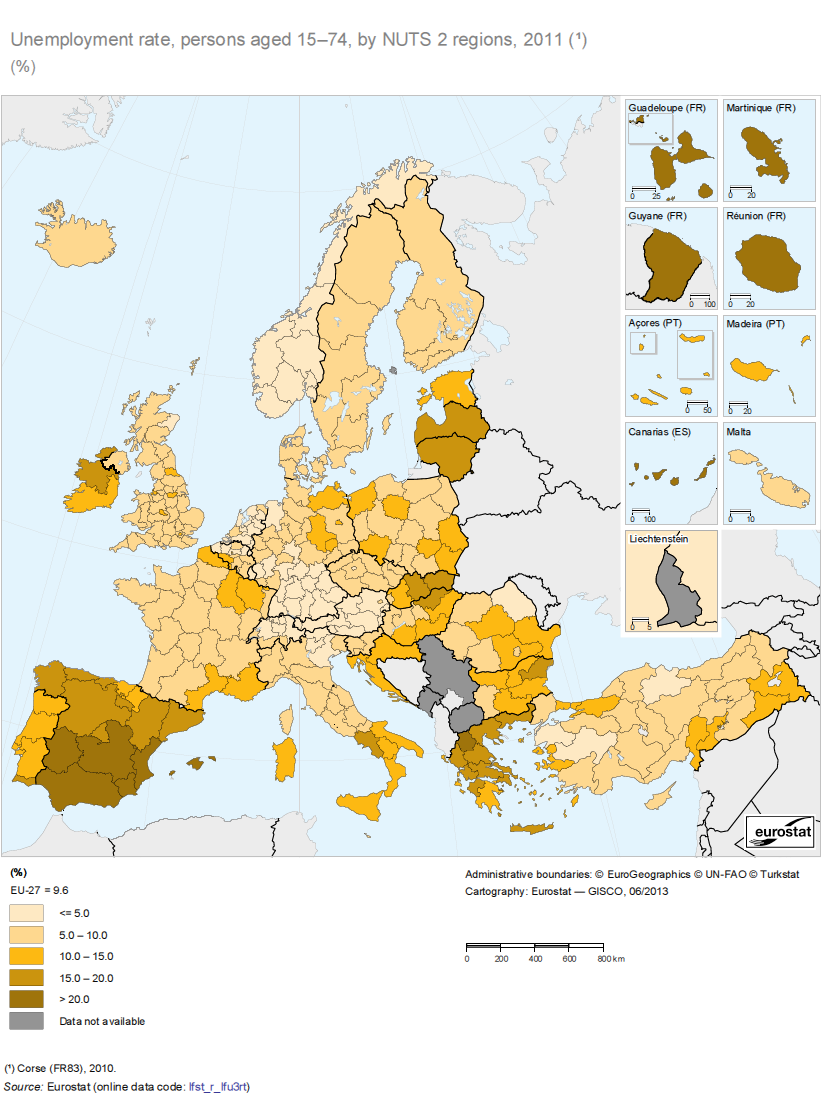
Unemployment rate, persons aged 15–74, by NUTS 2 regions, 2011 (%).png
(
file
)
261 KB
2
17:30, 12 June 2013
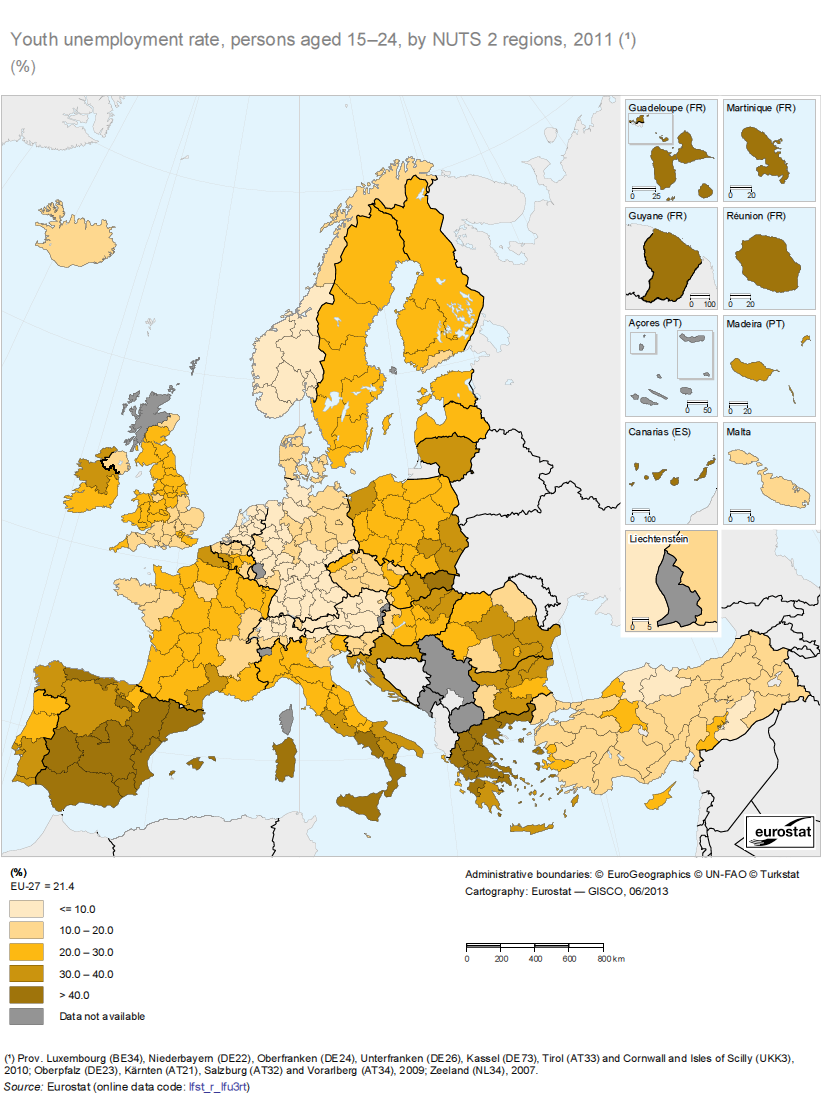
Youth unemployment rate, persons aged 15–24, by NUTS 2 regions, 2011 (1) (%).png
(
file
)
267 KB
2
11:45, 17 June 2013
GDP at regional level RYB2013.xls
(
file
)
514 KB
5
16:40, 17 June 2013
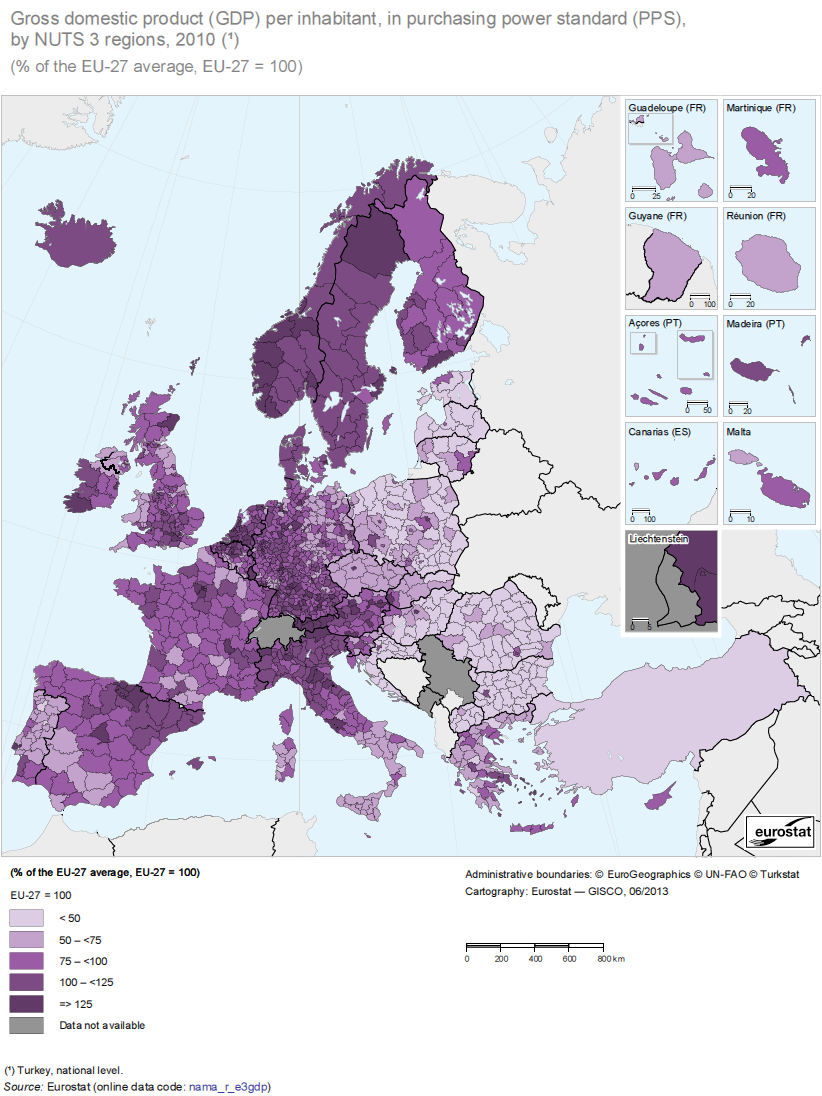
Gross domestic product (GDP) per inhabitant, in purchasing power standard (PPS), by NUTS 3 regions, 2010 (1) (% of the EU-27 average, EU-27 = 100).png
(
file
)
317 KB
2
16:42, 17 June 2013
Gross domestic product (GDP) per inhabitant, in purchasing power standard (PPS), by NUTS 2 regions, 2010 (1) (% of the EU-27 average, EU-27 = 100).png
(
file
)
255 KB
1
11:30, 4 July 2013
Education RYB2013.xls
(
file
)
249 KB
1
11:31, 4 July 2013
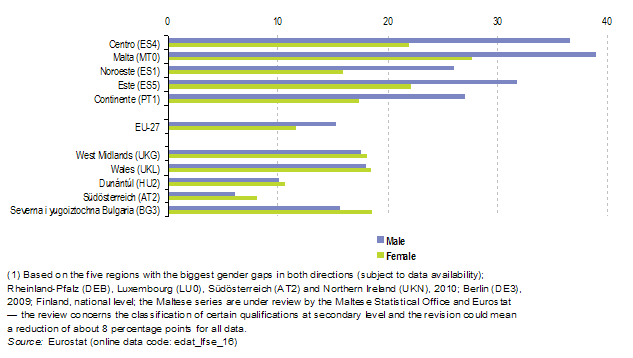
Early leavers from education and training, NUTS 1 regions with atypical gender gaps, 2011 (1) (%).png
(
file
)
16 KB
1
12:20, 4 July 2013
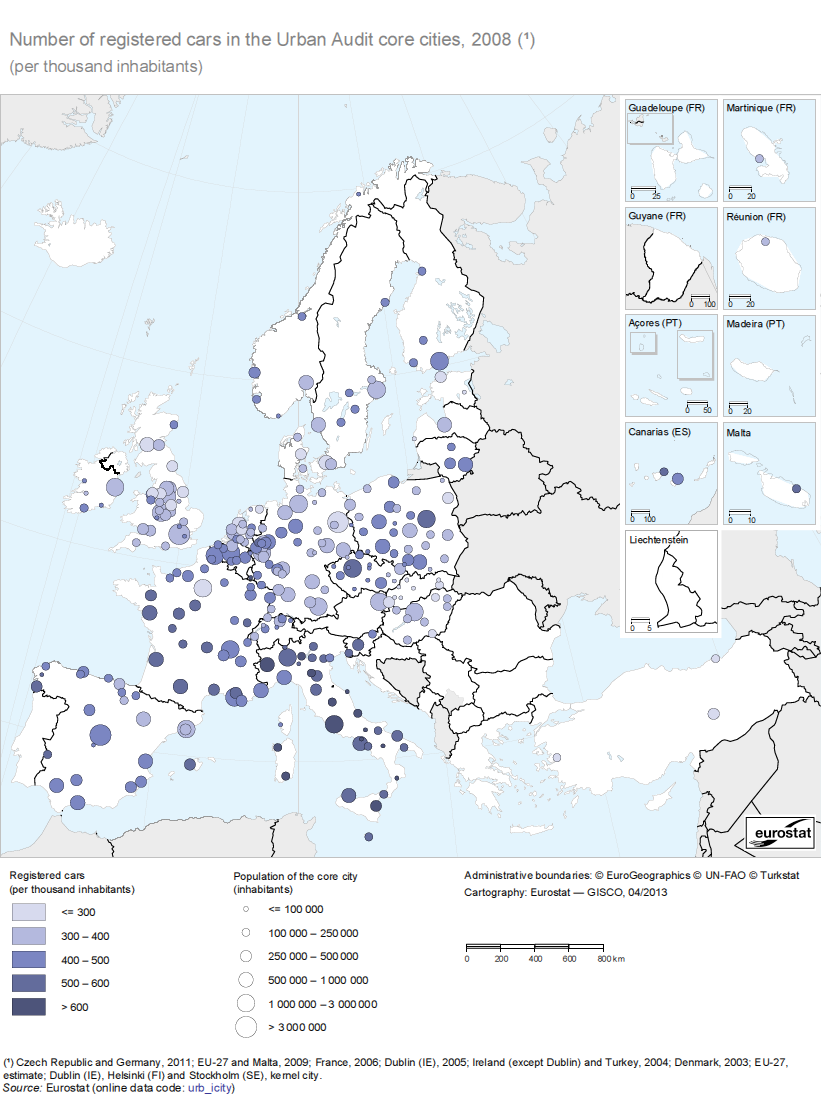
Number of registered cars in the Urban Audit core cities, 2008 (1) (per thousand inhabitants).png
(
file
)
224 KB
2
12:21, 4 July 2013
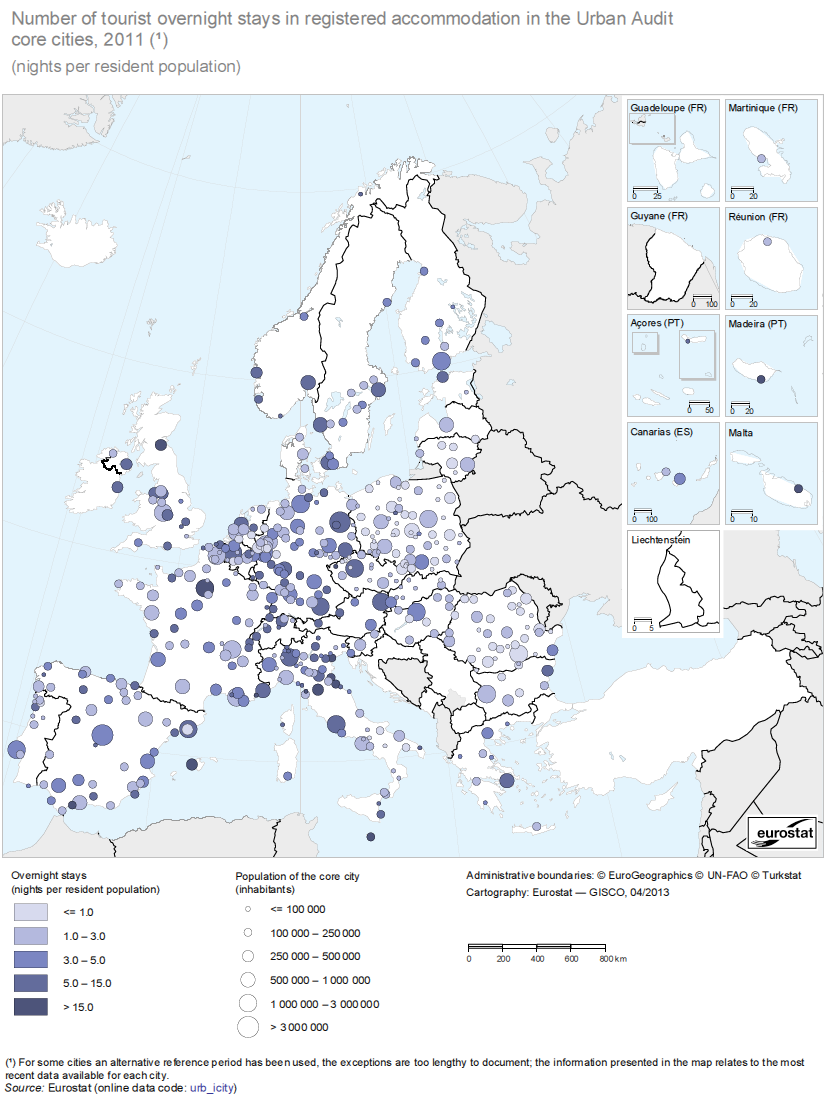
Number of tourist overnight stays in registered accommodation in the Urban Audit core cities, 2011 (1) (nights per resident population).png
(
file
)
241 KB
2
12:21, 4 July 2013
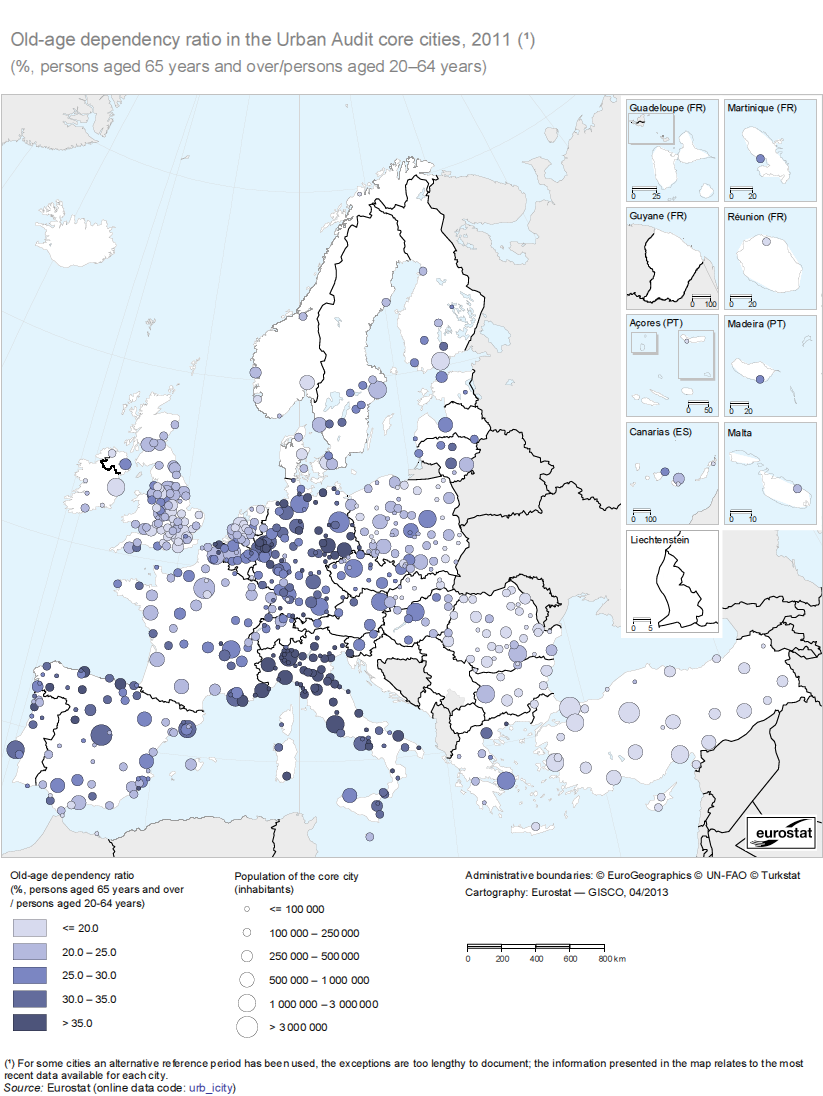
Old-age dependency ratio in the Urban Audit core cities, 2011 (1) (%, persons aged 65 years and over compared with persons aged 20–64 years) map.png
(
file
)
256 KB
2
12:21, 4 July 2013
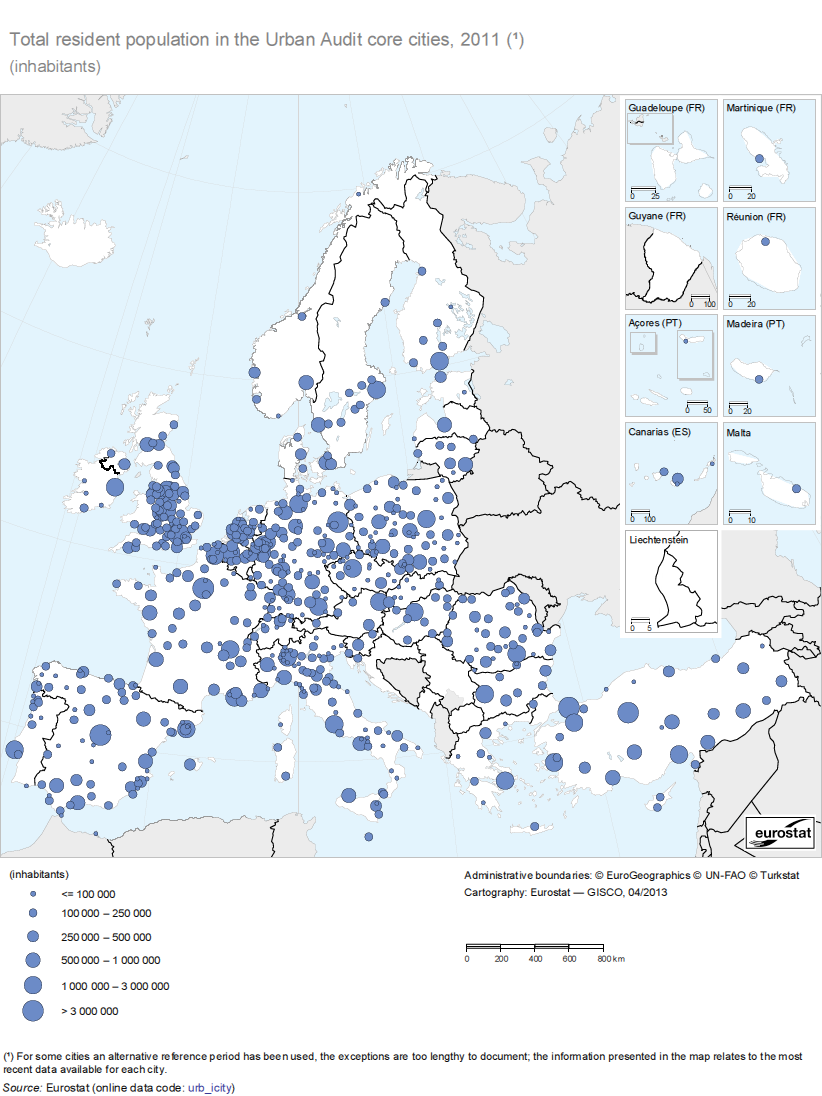
Total resident population in the Urban Audit core cities, 2011 (1) (inhabitants).png
(
file
)
241 KB
1
17:05, 23 October 2013
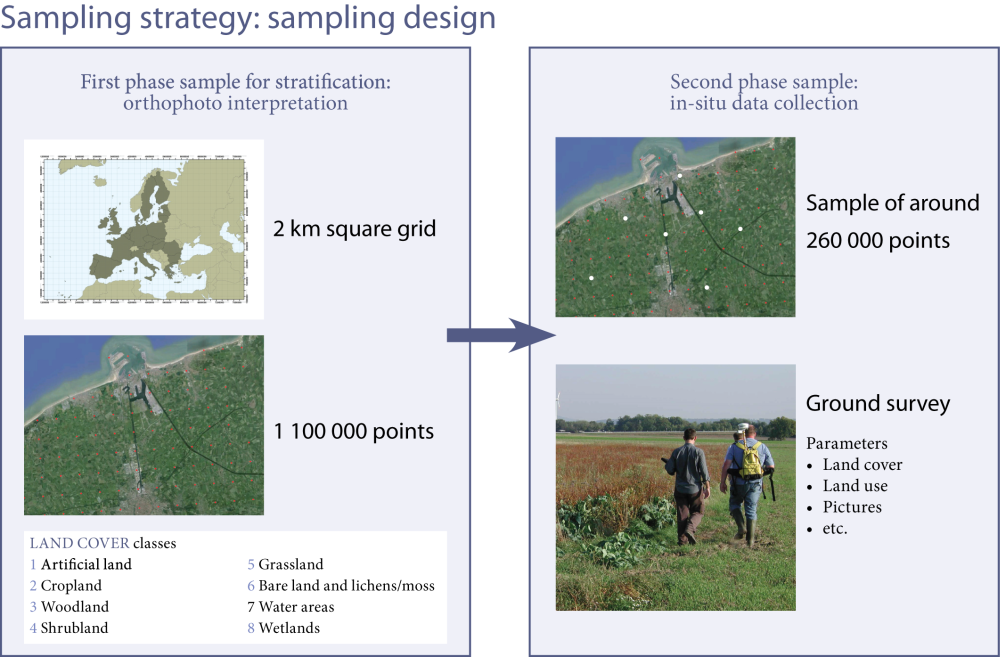
Image1 LUCAS.jpg
(
file
)
458 KB
1
17:05, 23 October 2013
Image2 LUCAS.png
(
file
)
400 KB
1
17:06, 23 October 2013
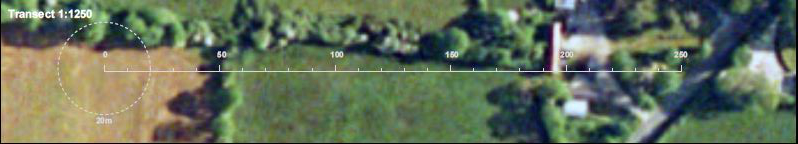
Transect 1.JPG
(
file
)
153 KB
1
17:06, 23 October 2013
Transect 2.JPG
(
file
)
112 KB
1
17:16, 23 October 2013
Image3 LUCAS.jpg
(
file
)
65 KB
1
17:16, 23 October 2013
Image4 LUCAS.jpg
(
file
)
39 KB
1
18:53, 23 October 2013
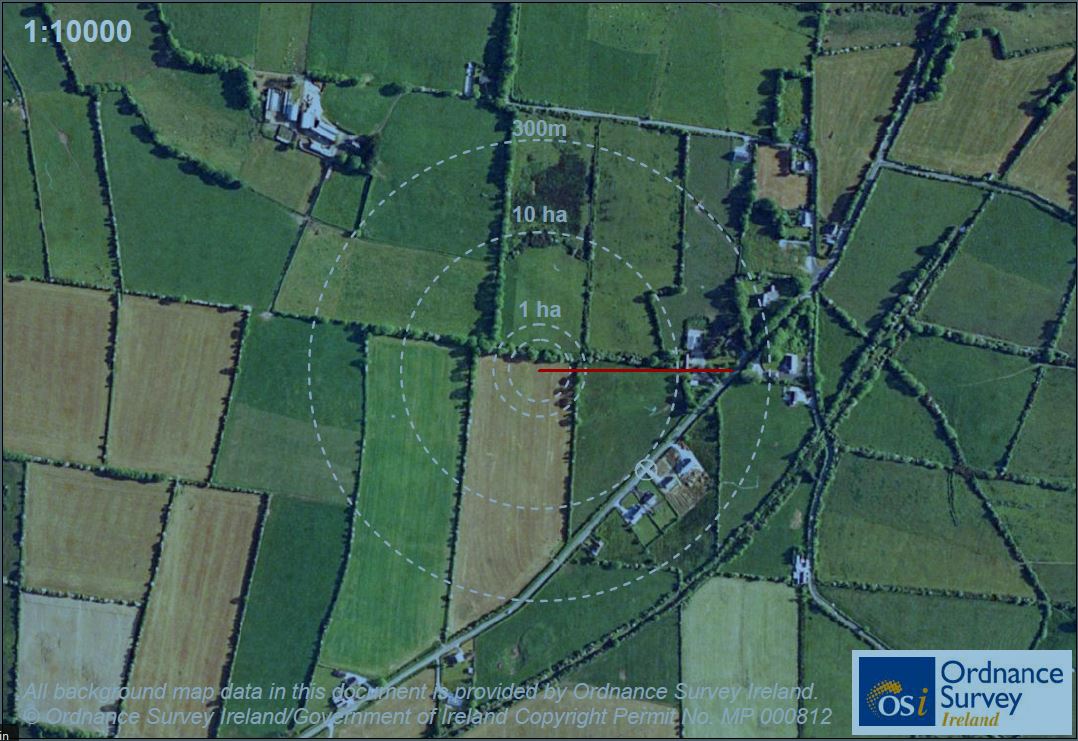
Transect information collected by LUCAS overview.png
(
file
)
1.14 MB
1
19:36, 23 October 2013
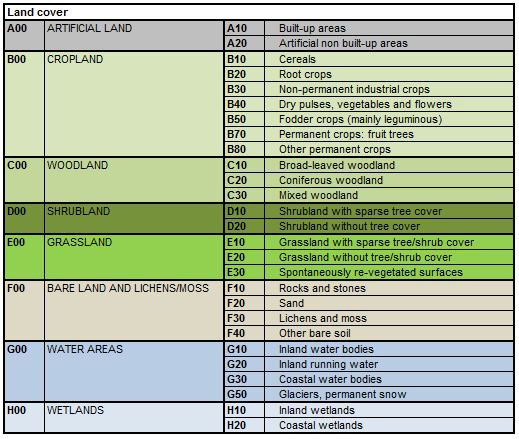
LUCAS — classification of landuse.png
(
file
)
217 KB
1
18:59, 25 October 2013
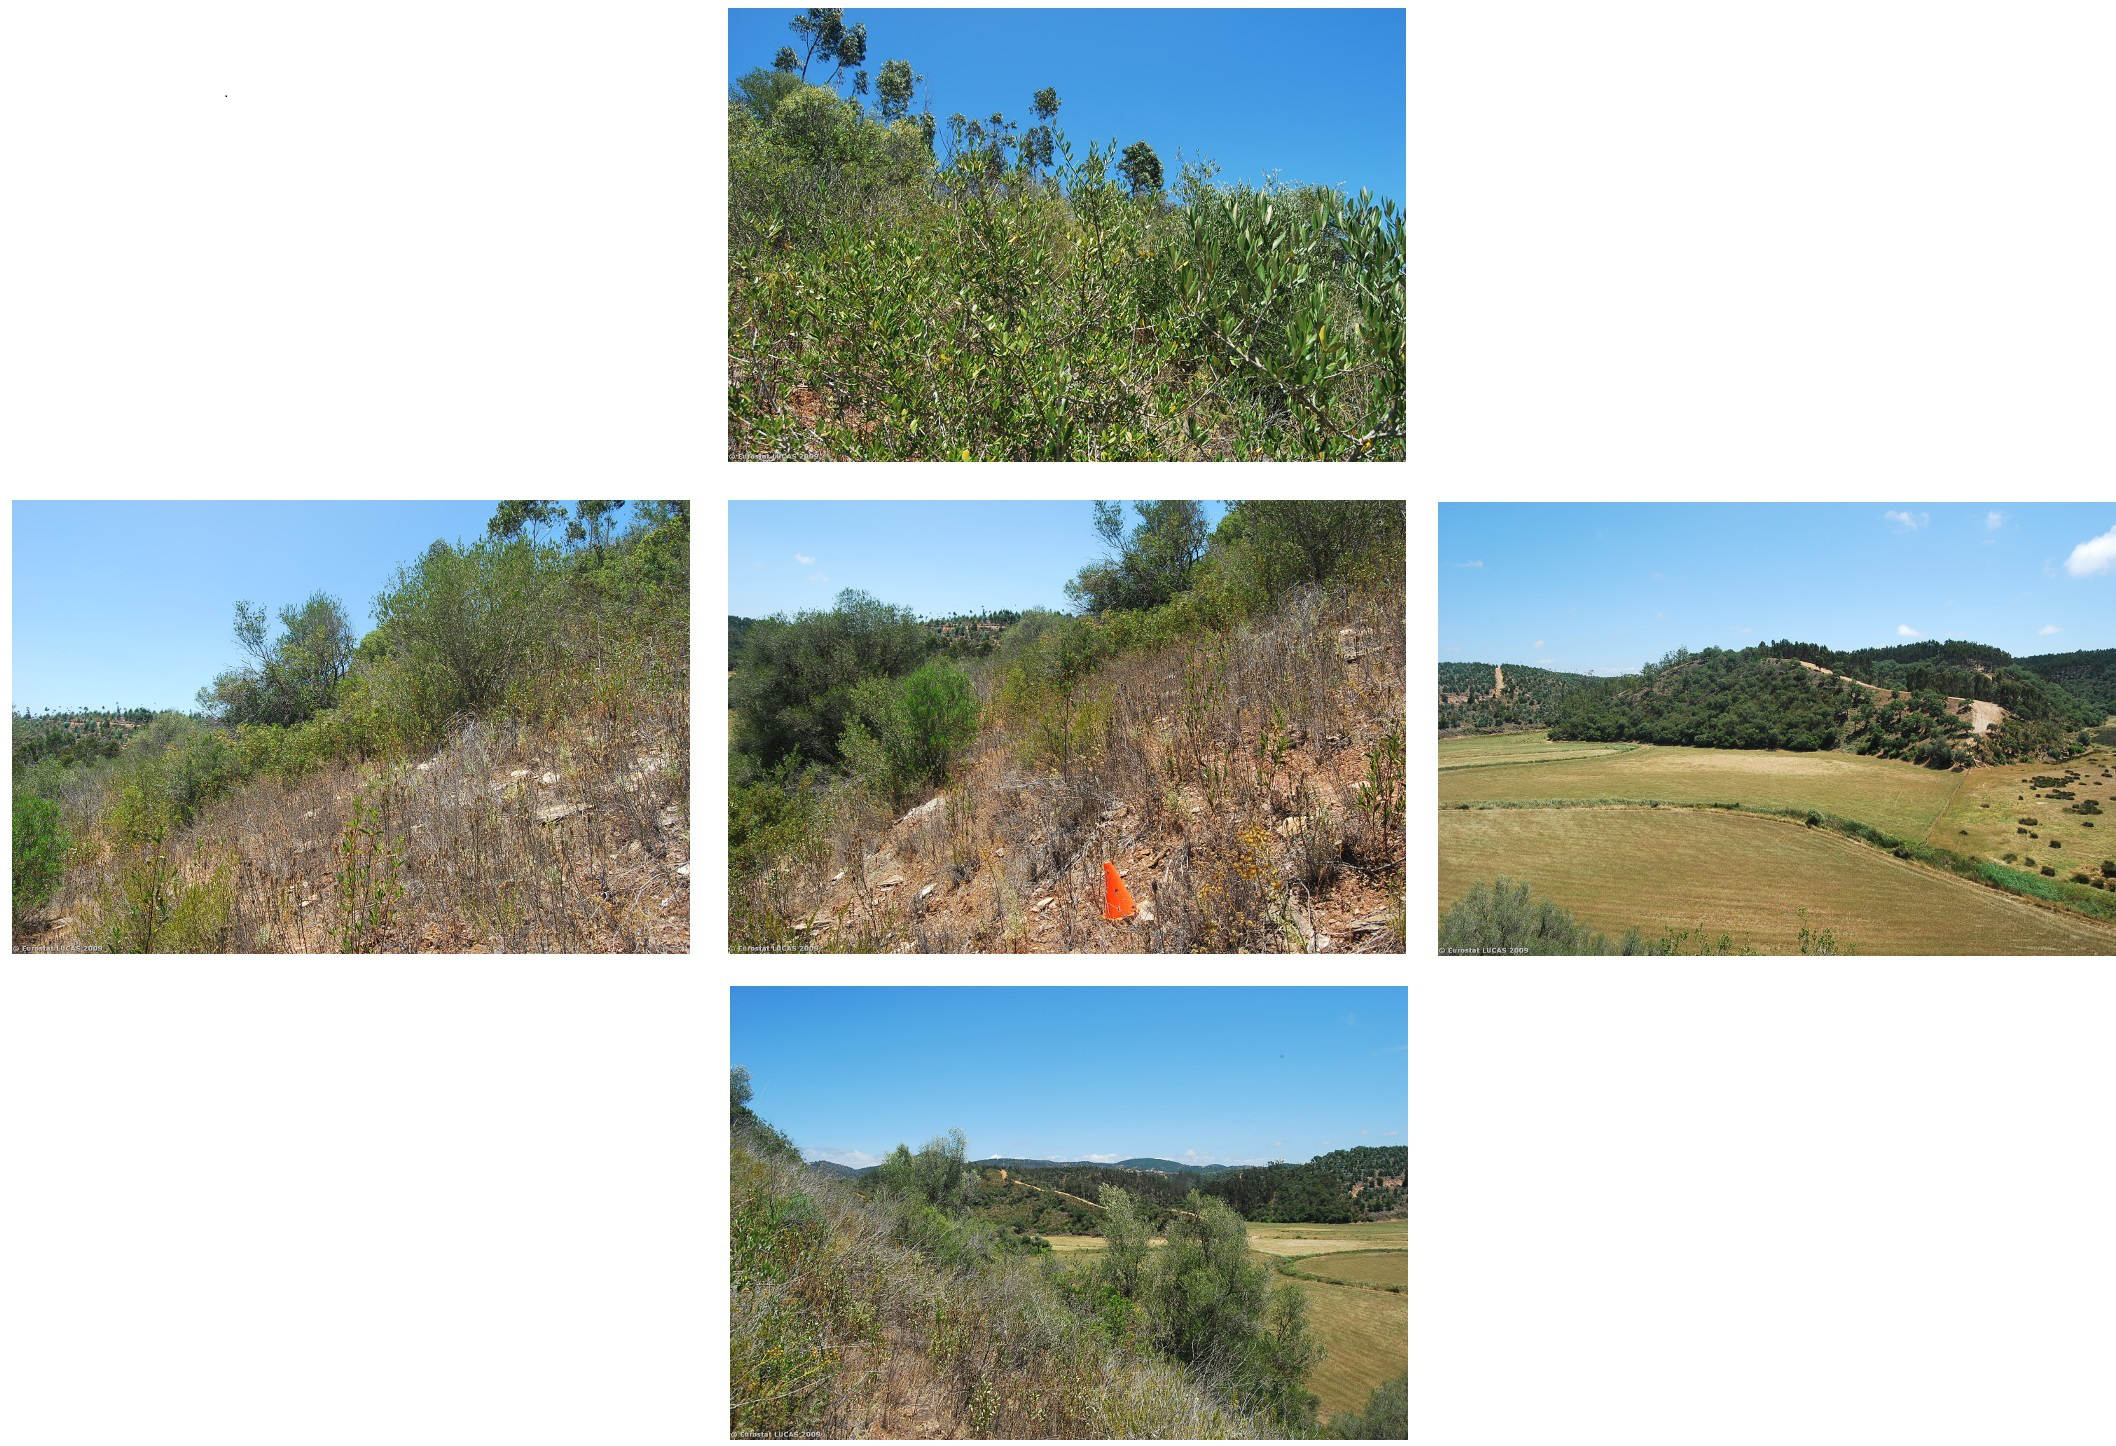
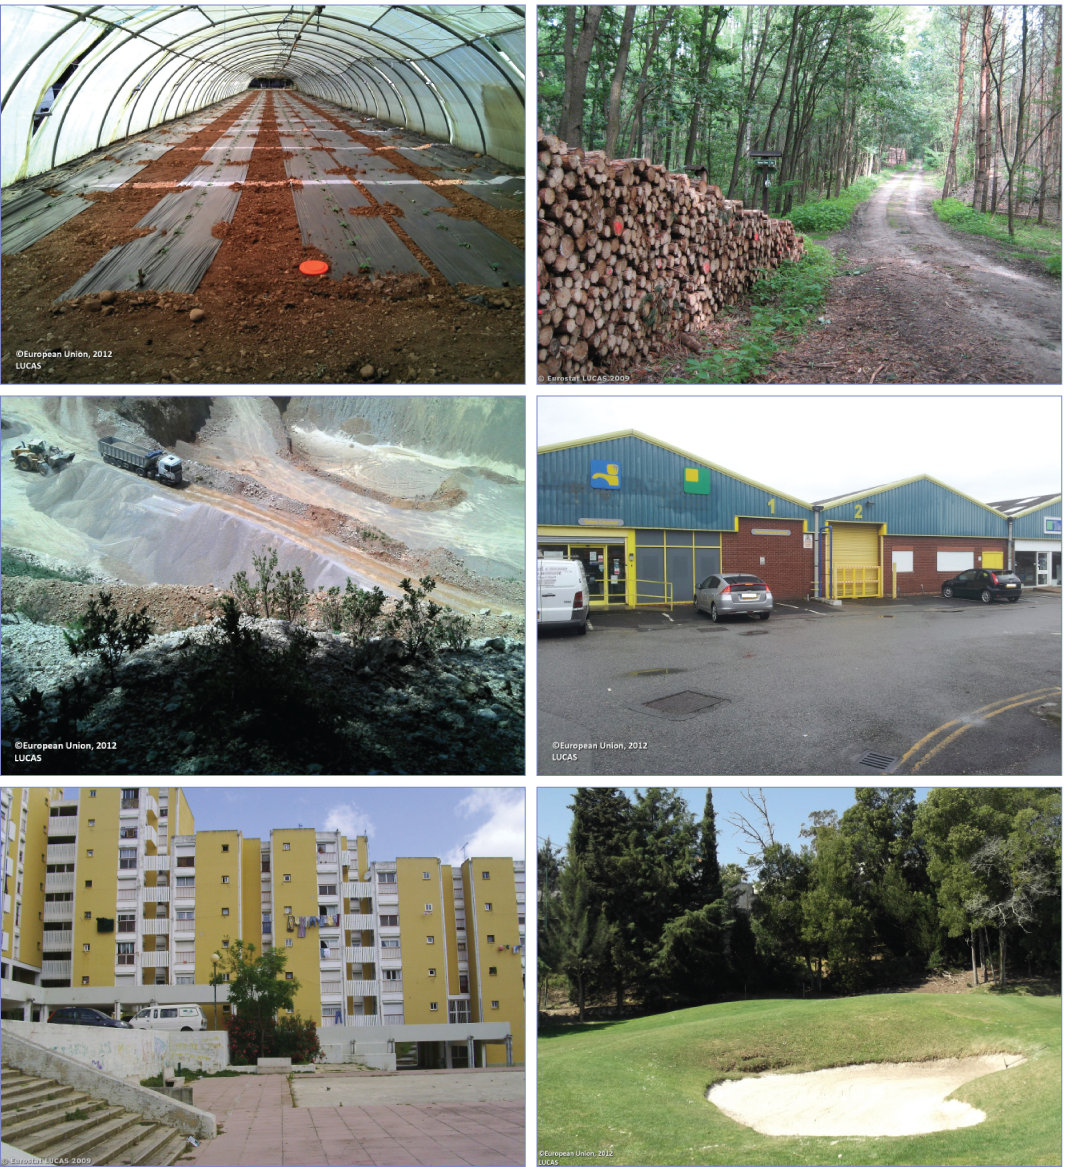
LUCAS — examples of land cover.png
(
file
)
1.78 MB
2
19:00, 25 October 2013
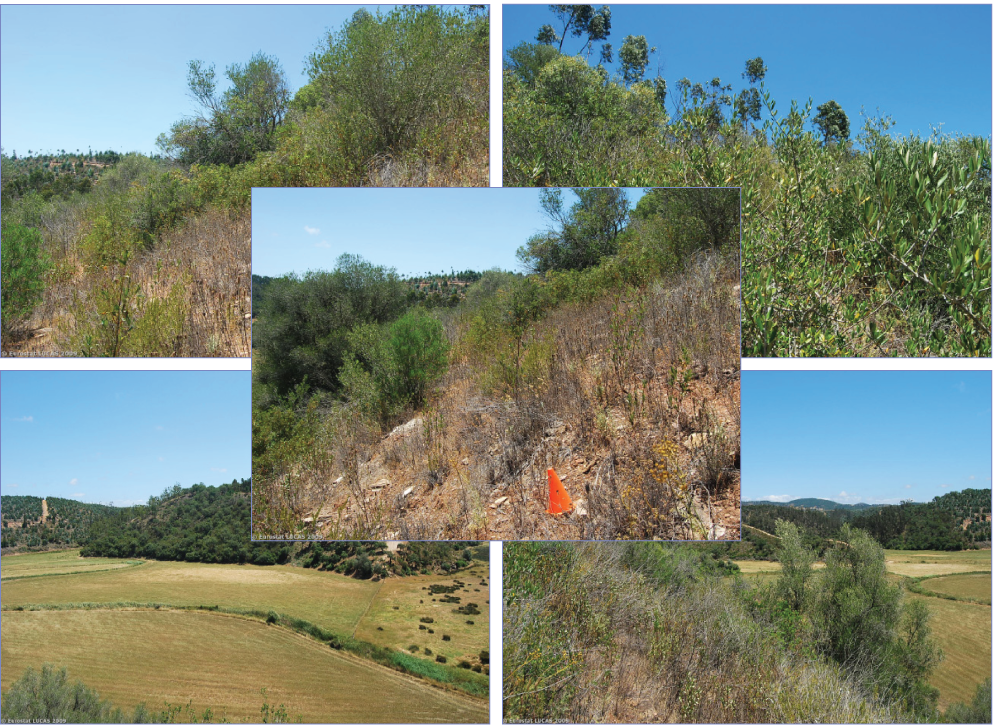
LUCAS — examples of land use.png
(
file
)
2.12 MB
2
19:00, 25 October 2013
LUCAS geo-referenced point in a field and pictures to the north south east and west.png
(
file
)
1.29 MB
3
First page
Previous page
Next page
Last page
Special page
ISSN 2443-8219

.png)
.png)
.png)


_(percentage_points_difference_between_2011_and_2008).png)
_(percentage_points_difference_between_2011_and_2008).png)
.png)
_(%25).png)
_per_inhabitant,_in_purchasing_power_standard_(PPS),_by_NUTS_3_regions,_2010_(1)_(%25_of_the_EU-27_average,_EU-27_%3D_100).png)
_per_inhabitant,_in_purchasing_power_standard_(PPS),_by_NUTS_2_regions,_2010_(1)_(%25_of_the_EU-27_average,_EU-27_%3D_100).png)
_(%25).png)
_(per_thousand_inhabitants).png)
_(nights_per_resident_population).png)
_(%25,_persons_aged_65_years_and_over_compared_with_persons_aged_20%E2%80%9364_years)_map.png)
_(inhabitants).png)


