Data extracted in April 2025.
Planned article update: April 2026
Highlights
In 2022, value added by the EU’s ICT sector was equivalent to 5.5% of Gross Value Added (GVA).
Over the decade (2012-2022), the ICT services share of Gross Value Added in the EU saw steady growth (+24.8% in the period), though 2022 marked a slight decline. The share of ICT manufacturing was stabler (+0.6% in the period).
In every EU country, labour productivity in the ICT sector is higher than in the rest of the business economy. Ireland leads with an impressive 578%.
Developments in the information and communication technology (ICT) sector have led to significant changes in the methods of production and patterns of employment across the European Union (EU). This article provides an overview of economic developments within the EU’s ICT sector; the primary sources of information that are used for this article are structural business statistics (SBS), national accounts and research and development (R & D) statistics.
The size of the ICT sector in terms of value added
The value added of the ICT sector in the EU was over €791 billion in 2022, 5.5% of the EU’s Gross value added.
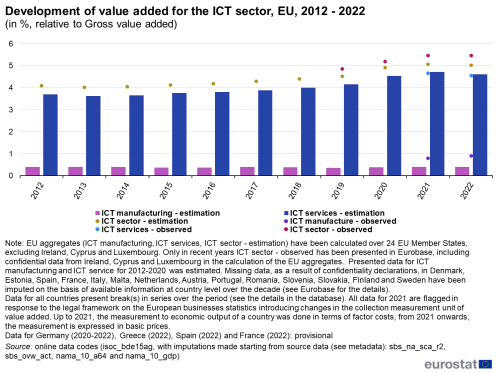
Figure 1 shows the development of the ICT sector (in %, relative to Gross value added) for the aggregates 'ICT sector', 'ICT manufacturing' and 'ICT services'. For the period 2012-2022, the EU averages are estimated on the basis of the data from 24 EU countries for which a complete time series for at least one of the aggregates 'ICT manufacturing' or 'ICT services' was available, allowing for consistent imputation in the other series. This excludes Ireland, Cyprus and Luxembourg from the average estimation. For the last 4 reference years, from 2019 to 2022, the observed aggregate 'ICT sector' is available for the EU. From 2021, the observed 'ICT manufacturing' and 'ICT services' are also available. The observed EU averages include Ireland, Cyprus and Luxembourg.
The contribution of the ICT sector to Gross value added steadily increased over the decade, with a notable growth between 2019 and 2020. The estimated 'ICT sector’ is lower than the observed 'ICT sector' from 2019 to 2022. For 2021 and 2022, both the aggregates ‘ICT manufacturing’, and ‘ICT services’ are observed at EU level and suggest that the gap among ‘ICT sector’ estimated and observed data is driven by higher observed values for ‘ICT services’ compared to the estimated ones.
Among the possible factors to explain the difference between the estimation of the aggregate ICT sector, and the observed data is that some countries hosting many businesses in the ICT sector provide confidential data used for the observed aggregate. Considering for example the share of ICT sector in GVA in Ireland, which provided non confidential data–in 2022, it was 34.78%. This is the highest value among the EU countries for which data are not confidential, unreliable, or partially unavailable, and it is three times higher than the second highest country (Malta, with 10.14%).
Source: Eurostat (isoc_bde15ag), (sbs_ovw_act), (sbs_na_sca_r2), (nama_10_gdp) and (nama_10_a64)
Figure 2 shows the development of value added for the EU’s ICT manufacturing and ICT services sectors during the period 2012-2022: this index is based on information expressed in current prices and for which complete coverage is limited to 11 of the EU countries, the only countries for which information on both ICT manufacturing and ICT services is available. For all the other countries with confidential information, data were imputed. Imputations did not involve Ireland, Cyprus and Luxembourg, which were excluded from the analysis since they had not enough non confidential data for reliable imputations. Considering the average of the 24 EU countries with available time series, the value added for ICT services increased every year during the decade, rising overall by 24.8%. During the same period, the value added for ICT manufacturing showed more diversity in its growth pace leading to amount an overall increase of 0.6%.

Source: Eurostat (isoc_bde15ag), (sbs_ovw_act), (sbs_na_sca_r2), (nama_10_gdp) and (nama_10_a64)
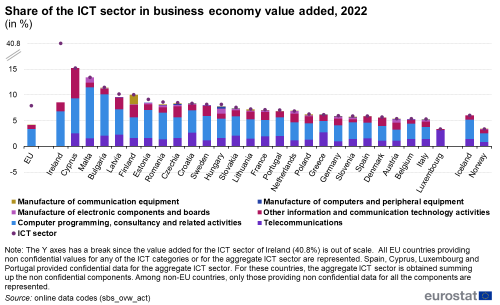
Figure 3 presents the share of the ICT sector in gross value added across EU countries and other countries for which data are available in 2022. The ICT sector contributed 5.5% of total value added in the EU27, with services (4.6%) accounting for the majority compared to manufacturing (0.9%).
The Y axis reports a break due to the presence of Ireland, which provided for the first time non confidential data for the ICT sector in 2022. Its exceptionally high figure (34.8%) confirms the country's heavy reliance on the ICT sector. After Ireland, Cyprus (10.4%) and Malta (10.1%) recorded the highest shares, both driven almost entirely by ICT services—note that no data for ICT manufacturing were available for Cyprus. Several countries, such as Bulgaria (7.4%), Latvia (6.5%), and Sweden (6.2%), also exceeded the EU average. Finland and Hungary were among the few where ICT manufacturing contributed significantly (1.2%). At the lower end, Greece (3.0%) and Italy (3.2%) showed more modest ICT value added. These results point to differing national specialisations and the growing economic importance of ICT services across Europe.
Among EFTA countries, Switzerland (5.0%) performed similarly to the EU average, while Norway (2.7%) remained well below it. Considering instead the 2 candidate countries for which data are presented (Bosnia and Herzegovina and Serbia), they both exceed the EU average.
Figure 4 illustrates the share of the ICT sector in the overall Business economy value added across European countries for 2022, breaking down the information by main NACE sectors. Significant variations across nations underscore different specialisation levels and economic focus within the ICT sector.
Ireland stands out markedly, with ICT accounting for 40.8% of its business economy value added. Cyprus (15.2%), Malta (13.4%), and Bulgaria (11.4%) also display high relative contributions from ICT, highlighting their strategic orientation towards digital industries.
Within specific ICT subsectors, Telecommunications and Computer programming, consultancy, and related activities are dominant across most countries. Telecommunications particularly contributes significantly in Luxembourg (3.2%), Greece, Croatia (both 2.7%) and Cyprus (2.5%), whereas computer programming services are notably influential in Malta (9.9%) and Bulgaria (8.0%).
Manufacturing of ICT products, including electronic components, computers, and communication equipment, remains generally minor across the EU, though Finland (1.8% communication equipment), Hungary (1.0% electronic components, 0.4% computers), Malta (1.0% electronic components) and Austria (0.7% electronic components) are notable exceptions.
Overall, the data emphasizes the ICT sector's varied but generally significant role in European economies, reflecting diverse strategic choices and competitive advantages. Among the non-European economies, only 2 EFTA countries, Iceland and Norway, provided complete data. The ICT sector contribution to the overall business economy was lower (Iceland 6.0%, Norway 3.4%) compared to the EU average (7.9%).
Source: Eurostat (sbs_ovw_act)
Employment
The EU’s ICT sector employed almost 7.1 million people in 2022.
Figure 5 highlights significant employment trends in the ICT sector within the EU between 2012 and 2022, distinguishing clearly between manufacturing and service activities, which respectively represent 7.4% and 92.4% of total ICT sector. For the period 2012-2022, the EU averages are calculated on the basis of the data from 23 EU countries for which a complete time series for at least one of the aggregates 'ICT manufacturing' or 'ICT sector' was available, allowing for consistent imputation of 'ICT service' or 'ICT manufacturing' when data are confidential. This excludes Ireland, Cyprus, Luxembourg and the Netherlands from the average estimation.
ICT services experienced consistent and robust growth over the decade, with employment levels reaching 145.1 in 2022 relative to the baseline of 100 set in 2012. This increase reflects a substantial expansion of employment, likely driven by the growing digitalization and increased demand for ICT-related skills in various sectors. Conversely, employment in ICT manufacturing showed a clear downward trajectory over the same period, declining from 100 in 2012 to 83.9 in 2022. This reduction indicates structural shifts, potentially due to factors like automation, increased productivity, offshoring, and the competitive pressures affecting manufacturing employment in Europe. Overall, the data underscores a clear divergence within the ICT sector: significant employment gains in services contrast starkly with diminishing employment in manufacturing, reflecting broader economic trends towards service-oriented digital economies in the EU.
Figure 6 illustrates the share of ICT sector employment in total employment across EU countries, comparing 2012 and 2022. The data highlight a general upward trend in ICT employment's importance within national labour markets.
Ireland, Estonia, and Malta emerge as prominent examples, with Ireland leading in 2022 at 6.2%, closely followed by Estonia at 6.0%, representing a substantial increase from 2012 levels. Similarly, significant growth is evident in Latvia (from 2.5% to 4.6%), Lithuania (from 2.0% to 3.8%), and Bulgaria (from 2.0% to 3.8%).
In contrast, countries such as Italy and Greece exhibit more modest growth, indicating potential challenges in expanding digital employment opportunities or structural limitations in labour market adaptation. Among EFTA countries, Switzerland (3.4%) and Norway (3.5%) performed similarly to the EU (3.3%).

Source: Eurostat (isoc_bde15ap)
Source: Eurostat ( isoc_bde15 ap)
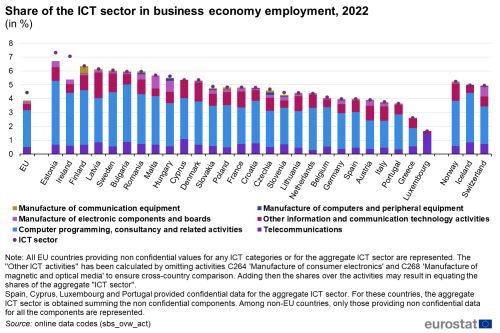
Figure 7 provides insights into the share of ICT sector employment within the business economy across European and EFTA countries in 2022. The data illustrate significant variations in ICT employment by subsector and country.
Estonia, Ireland, and Finland exhibit notably high overall ICT employment shares, with Estonia leading at 7.3%, Ireland closely behind at 7.1%, and Finland at 6.4%. Countries like Greece (2.6%) and Portugal (3.7%) show comparatively lower overall shares of ICT employment. Computer programming, consultancy, and related activities dominate the sector, particularly in Estonia (4.6%), Bulgaria (4.2%), Finland and Sweden (both 3.9%). Manufacturing activities generally represent a smaller proportion, although countries such as Malta (0.9%) and Hungary (0.8%) stand out with higher employment in the manufacture of electronic components and boards. Telecommunications also form a significant subsector, contributing notably in Luxembourg (1.5%), Cyprus (1.1%), and Latvia (0.8%).
Overall, Figure 7 underlines the ICT sector's diverse composition and varying significance across European economies, reflecting different strategic focuses, industrial specializations, and competitive advantages. In the reported EFTA countries, the share of ICT sector employment within the business economy is generally higher (above 5.0%) than the EU average (4.5%)
Source: Eurostat (sbs_ovw_act)
Apparent labour productivity
There are large differences in productivity levels between the individual EU countries. Many of these may be of a structural nature and therefore relevant to any activities, rather than being specific to the ICT sector. It can therefore be more revealing to analyse Apparent labour productivity based on a ratio comparing this indicator for the ICT sector with an average value for the business economy.
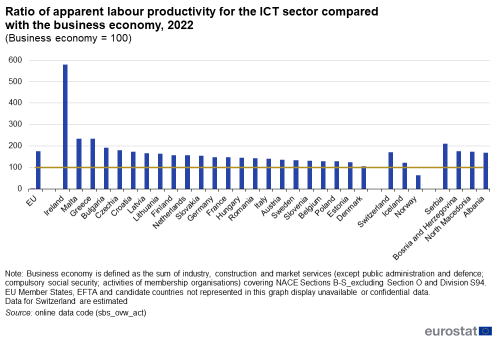
Figure 8 presents the ratio of apparent labour productivity in the ICT sector relative to the broader business economy across various European countries for 2022. This indicator provides a straightforward interpretation: a value above 100 indicates that labour productivity in the ICT sector is higher than the overall business economy, while a value below 100 indicates lower productivity. Notably, all EU countries included in this analysis have productivity ratios above 100, highlighting the ICT sector's uniformly high productivity compared to their broader national economies.
Ireland shows exceptionally high ICT sector productivity, with 578.2% indicating that ICT workers produce significantly more value added than the average across the entire business economy. Malta (235.0%) and Greece (233.8%) also exhibit notably high ICT productivity, suggesting specialised and efficient ICT sectors. Among EFTA and candidate countries, Serbia (210.8%) exhibit high ICT productivity. However, a lower ratio, such as Norway's at 64.2%, does not necessarily imply low productivity within the ICT sector itself. Rather, it could reflect the overall high productivity levels in other economic sectors of the country, making the ICT sector appear comparatively less productive.
Overall, this indicator highlights variations in ICT productivity across European and non-European countries, influenced both by the intrinsic productivity of the ICT sector and by the broader context of each country's economic productivity.
(in EUR thousand per person employed)
Source: Eurostat (sbs_ovw_act)
Research and development (R & D)
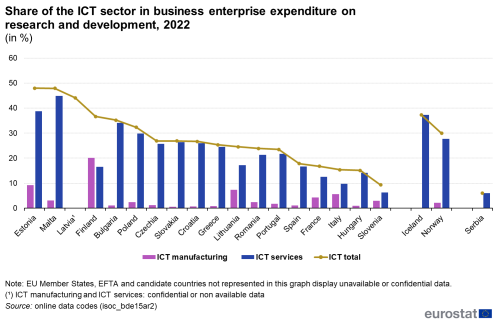
This section explores the ICT sector's role in driving business innovation. Figure 9 illustrates the share of the ICT sector in total business enterprise expenditure on research and development (R&D) in 2022. The figure breaks down the contribution of ICT manufacturing and ICT services, offering a more granular view of national R&D priorities within the digital economy.
The results reveal that in several countries for which data is available, ICT-related activities account for a substantial portion of overall business R&D. Estonia (48.0%), Malta (47.9%), and Latvia (44.1%) lead the group, where nearly half of private R&D expenditure is linked to the ICT sector. These figures highlight a strong strategic focus on digital innovation as a national development priority. At the lower end of the spectrum, countries like Slovenia (9.3%), Hungary (15.1%) and Italy (15.4%) report comparatively modest ICT shares in R&D expenditure, indicating either a smaller ICT sector or a more diversified R&D landscape.
A closer look at the breakdown between ICT services and manufacturing reveals different specialisations. Most countries show a dominance of ICT services in R&D, especially Malta (44.8%) and Bulgaria (34.1%), while Finland stands out as a country where ICT manufacturing plays a greater role (20.2% vs. 16.5% for services). This suggests a stronger focus on hardware and product development in Finland, compared to the predominance of software and service-based R&D in other nations.
In EFTA and candidate countries, Iceland took the lead with a share of the ICT sector in total R&D personnel of 37.4% followed by Norway (29.9%) while Serbia report a low ICT share in ICT expenditure (6.1%).
Source: Eurostat (isoc_bde15ar2)
Figure 10 complements this picture by focusing on R&D personnel, providing insight into the human capital dedicated to ICT-related innovation in 2022. Once again, Estonia (45.3%), Malta (44.4%), and Finland (38.4%) top the list, with a high proportion of business R&D staff employed in ICT. These countries not only invest heavily in digital innovation but also mobilize a substantial share of their research workforce in this domain.
The breakdown by subsector shows that ICT services dominate in nearly all countries, accounting for the bulk of ICT R&D personnel. For instance, Poland (35.0%) and Croatia (34.3%) have particularly high shares of R&D staff in ICT services. Notable exceptions include Finland, where ICT manufacturing employs a larger proportion (14.8%) of R&D personnel compared to most other countries, reinforcing its strength in hardware and engineering-focused innovation. At the other end of the scale, countries like Slovenia (15.1%), Italy (18.2%) and France (19.1%) report the lowest shares of R&D personnel in the ICT sector, reflecting more modest capacities or different innovation priorities.
Among EFTA and candidate countries, only Norway and Serbia are shown and provide opposite pictures. Norway (32.8%) has a percentage similar to the top EU countries, while Serbia (14.6%) is closer to the bottom of the EU distribution.
Altogether, Figures 9 and 10 illustrate how countries vary not just in investment, but in the organisation of research efforts—offering a richer understanding of the structural role of ICT in European innovation ecosystems.
Source data for tables and graphs
Data sources
The ICT sector is delineated according to a definition first published by the OECD in 2006; see the OECD Guide to Measuring the Information Society (2011) for more details. It provides, among others, a classification of those activities that produce ICT goods and services, following the statistical classification of economic activities, NACE Rev. 2. At an aggregated level, information on the ICT sector may be analysed for the total ICT sector, ICT manufacturing and ICT services; definitions for these sectors are provided below.
The primary data sources that are used in this article include structural business statistics (SBS), national accounts and research and development (R & D) statistics. As ICT sector data are derived from these sources, the statistical concepts and definitions employed for the ICT sector are based on these primary sources of information. This approach has the virtue of ensuring cost-efficient and high-quality data collection. However, it also results in some limitations, such as restrictions when considering the introduction/design of new indicators or a lack of control over the timing of new data releases. For the most detailed methodological information and metadata, users should refer to the information available for the three primary sources of data.
Structural business statistics (SBS)
Structural business statistics (SBS) describe the structure and performance of businesses in the EU. These statistics can be broken down into a detailed sectoral level of several hundred economic activities; the information available from SBS is more detailed than data from national accounts. The data concerning structural business statistics are provided up to reference year 2020 in accordance with Commission Regulation (EU) No 446/2014 amending Regulation (EC) No 295/2008. From reference year 2021 onwards, data are collected under the legal framework for European Business Statistics (EBS) by Commission Regulation (EU) 2019/2152 and Commission Implementing Regulation (EU) 2020/1197 (EBS General Implementing Act).
From 2021 onwards, SBS cover the 'business economy', which includes mining and quarrying, industry, supply and sewerage, construction, trade and most of the service activities. SBS do not cover agriculture, forestry and fishing, nor public administration and (largely) non-market services such as education or health. To date, this is the only primary source that provides information pertaining to the economic activity of the aggregated ICT sector, ICT manufacturing and ICT services.
National accounts
National accounts provide statistics on the structure and development of economies. The European System of national and regional Accounts (ESA 2010) is the latest internationally compatible accounting framework used within the EU. It provides a systematic and detailed description of the economy; its legal basis is Regulation (EU) No 549/2013 on the European system of national and regional accounts in the European Union.
National accounts describe and analyse the economic interactions (transactions) within an economy; they may be used to observe economic activity within the domestic territory. The most well-known indicator from national accounts is gross domestic product (GDP), which provides a measure of the overall size of a country’s economy, measured by the sum of the gross value added of all resident institutional units engaged in production, plus any taxes on products and minus any subsidies on products.
Research and development (R & D)
The main concepts and definitions used in research and development (R & D) statistics are presented in the Frascati Manual; it provides guidelines for collecting and reporting data on R & D. The manual also provides a definition of R & D which comprises creative and systematic work undertaken in order to increase the stock of knowledge — including knowledge of humankind, culture and society — and to devise new applications of available knowledge (§2.5, Frascati Manual 2015).
From 2012 until the end of 2020, the legal basis for the collection of R & D statistics is provided for by Commission Implementing Regulation (EU) No 995/2012 laying down detailed rules for the implementation of Decision No 1608/2003/EC concerning the production and development of Community statistics on science and technology. From 2021 onwards, the collection of R&D statistics is based on the Commission Implementing Regulation (EU) 2020/1197 of 30 July 2020. The Regulation sets the framework for the collection of R&D statistics and specifies the main variables of interest and their breakdowns at predefined level of detail.
The business enterprise sector includes: all firms, organisations and institutions whose primary activity is the market production of goods or services (other than higher education) for sale to the general public at an economically significant price, and the private non-profit institutes mainly serving them. The core of the sector is made up of private enterprises (corporations or quasi-corporations) whether or not they distribute profit. Among these enterprises may be found some firms for which R & D is the main activity (commercial R & D institutes and laboratories). Any private enterprises producing higher education services should be included in the higher education sector. In addition, this sector includes public enterprises (public corporations and quasi-corporations owned by government units) mainly engaged in market production and sale of the kind of goods and services which are often produced by private enterprises, although, as a matter of policy, the price set for these may be less than the full cost of production. This sector also includes non-profit institutions (NPIs) who are market producers of goods and services other than higher education. Definitions employed to monitor indicators for the ICT sector
Total ICT sector, ICT manufacturing and ICT services are based on an OECD definition (2006). Using the statistical classification of economic activities, NACE Rev. 2, Eurostat has applied this definition to data from reference year 2008 onwards; prior to this date, an alternative definition was used (based on NACE Rev 1.1). As a result of this break in series, users are advised not to combine the two different data collections.
The ICT sector is defined in terms of the following NACE Rev. 2 activities:
- Total ICT sector: NACE (Groups and Divisions) [26.1 - 26.4] + 26.8 + 46.5 + 58.2 + 61 + 62 + 63.1 + 95.1
- ICT manufacturing: NACE Groups [26.1 - 26.4] + 26.8
- Manufacture of electronic components and boards: NACE Group 26.1
- Manufacture of computers and peripheral equipment: NACE Group 26.2
- Manufacture of communication equipment: NACE Group 26.3
- Manufacture of consumer electronics: NACE Group 26.4
- Manufacture of magnetic and optical media: NACE Group 26.8
- ICT services: NACE (Groups and Divisions) 46.5 + 58.2 + 61 + 62 + 63.1 + 95.1
- Wholesale of information and communication equipment: NACE Group 46.5
- Software publishing: NACE Group 58.2
- Telecommunications: NACE Division 61
- Computer programming, consultancy and related activities: NACE Division 62
- Data processing, hosting and related activities; web portals: NACE Group 63.1
- Repair of computers and communication equipment: NACE Group 95.1
- ICT manufacturing: NACE Groups [26.1 - 26.4] + 26.8
Indicator definitions
Gross value added (GVA) - NA: is defined as output (at basic prices) minus intermediate consumption (at purchaser prices); it is the balancing item of the national accounts' production account. GVA can be broken down by industry and institutional sector. The sum of GVA over all industries or sectors plus taxes on products minus subsidies on products gives gross domestic product.
Value added – SBS: Value added is a composite indicator of net operating income, adjusted for depreciation, amortisation and employee benefits, all components being recognised as such by the statistical unit during the reference period. Its value is given by the formula: + Net turnover + Income from product- or turnover-related subsidies + Capitalised output ± Change in stock of goods - Total purchases of goods and services. From 2021 onwards, EBS framework introduced measuring value added at basic prices for businesses, when prior it was collected at factor cost. Consequently, data on value added in businesses collected for reference year 2021 onwards are flagged with a break in series and are not directly comparable with 2020 data.
Persons employed - SBS: is defined as the total number of persons who work in the observation unit (inclusive of working proprietors, partners working regularly in the unit and unpaid family workers), as well as persons who work outside the unit who belong to it and are paid by it (e.g. sales representatives, delivery personnel, repair and maintenance teams). It excludes manpower supplied to the unit by other enterprises, persons carrying out repair and maintenance work in the enquiry unit on behalf of other enterprises, as well as those on compulsory military service.
Apparent labour productivity: is defined as the value added divided by the number of persons employed. This ratio measures how efficiently labour input is combined with other factors of production and how it is used in the production process. This ratio is generally presented in thousands of euros per person employed. R & D personnel in a statistical unit include all persons employed directly in the field of R & D, including persons providing direct services, such as managers, administrators, and clerical staff. A R & D researcher can be employed in the public or the private sector - including academia - to create new knowledge, products, processes and methods, as well as to manage the projects concerned.
Context
Digitalisation and automation can generate new business opportunities through the development of new production processes, new products and new markets. Indeed, the impact of ICT has generally resulted in increased productivity and efficiency, as well as in a range of possibilities for more flexible working practices. ICT plays a strategic role in promoting growth and competitiveness across European economies. A developed ICT sector is essential for capitalising on digitalisation, keeping up with competitors in globalised markets, and establishing Europe’s technological leadership. Awareness of the importance of the ICT sector is reflected in the political guidelines of the European Commission Political guidelines 2024-2029, stressing the need for Europe to boost productivity with digital tech diffusion.
Explore further
Other articles
Database
- ICT sector (isoc_se)
- Percentage of the ICT sector in gross value added (isoc_bde15ag)
- Business expenditure on R&D (BERD) in ICT sector as % of total R&D expenditure by NACE Rev. 2 activity (isoc_bde15ar2)
- R&D personnel in ICT sector as % of total R&D personnel by NACE Rev. 2 activity (isoc_ic_biper2)
- SBS - main indicators (sbs_na)
- Annual enterprise statistics for special aggregates of activities (NACE Rev. 2) (sbs_na_sca_r2)
- SBS - industry and construction (sbs_ind_co)
- Annual detailed enterprise statistics - industry and construction (sbs_na_ind)
- SBS - trade
- Annual detailed enterprise statistics - trade (sbs_na_dt)
- SBS - services
- Annual detailed enterprise statistics - services (sbs_na_serv)
- National accounts, see:
- Annual national accounts (nama10)
- Main GDP aggregates (nama_10_ma)
- GDP and main components (output, expenditure and income) (nama_10_gdp)
- Main GDP aggregates (nama_10_ma)
Thematic section
Publications
Methodology
Eurostat
- ICT sector (isoc_se) (ESMS metadata file — isoc_se_esms)
- Annual national accounts (nama10) (ESMS metadata file — nama10_esms)
- Structural business statistics (sbs) (ESMS metadata file — sbs_esms)
- Structural business statistics - historical data (sbs) (ESMS metadata file — sbs_h_esms)
- Statistics on research and development (rd) (ESMS metadata file — rd_esms)
OECD


