Data extracted: October 2025
Planned article update: 12 February 2026
Highlights
This article presents the Eurostat Business Cycle Clock (BCC), a tool showing different economic cycle phases for the euro area using a clock-type graph. The clock is designed to represent the empirically observed sequence of turning points of the business, growth and acceleration cycles. Its indications are based on three synthetic indicators: the growth cycle coincident indicator (GCCI), the business cycle coincident indicator (BCCI) and the acceleration cycle coincident indicator (ACCI), which are all experimental in nature (see Context for more methodological information).
Business Cycle Clock's indications for the euro area
According to the latest Business Cycle Clock's indications, the euro area economy appears to be in a slowdown phase with accelerating growth. Due to revisions in the input data, the previous signal indicating an exit from the slowdown phase in the second quarter is no longer valid.
This situation is confirmed by the latest dating exercise covering the period up to the second quarter of 2025.
However, the economic situation continues to be characterised by a high degree of uncertainty due to several factors, such as ongoing geopolitical instability and the effects of recent increases in tariffs.
The BCC tool signal shown in Figure 1 is based on three coincident cyclical indicators: the growth cycle coincident indicator (GCCI), the business cycle coincident indicator (BCCI) and the acceleration cycle coincident indicator (ACCI). They are estimated in the detecting exercise (see Context for more methodological information).
Growth cycle coincident indicator
In the third quarter of 2025, the growth cycle coincident indicator (GCCI) remained closed to one, indicating the persistence of the slowdown phase in the euro area economy.
Figure 2: Growth cycle coincident indicator for the euro area (probabilities for slowdown).
Source: Eurostat (own calculations)
Business cycle coincident indicator
The business cycle coincident indicator (BCCI) remained steady at zero in the third quarter of 2025, indicating the absence of recessionary signals.
Figure 3: Business cycle coincident indicator for the euro area (probabilities for slowdown).
Source: Eurostat (own calculations)
Acceleration cycle coincident indicator
In the third quarter of 2025, the acceleration cycle coincident indicator (ACCI) increased slightly from 0.75 in July to 0.83 in September 2025, confirming the persistence of an accelerating growth phase within the ongoing slowdown.
Figure 4: Acceleration cycle coincident indicator for the euro area (probabilities for slowdown).
Source: Eurostat (own calculations)
Source data for tables and graphs
Data sources
The GCCI and BCCI are estimated using the following input variables:
- industrial production index (IPI),
- unemployment rate,
- manufacturing employment expectations for the months ahead,
- financial situation of consumers over the last 12 months.
The last 2 variables are from the Business and consumer surveys (BCS) conducted by the European Commission's Directorate-General for Economic and Financial Affairs. The ACCI is estimated using the Economic Sentiment Indicator, a synthetic indicator from the BCS.
Context
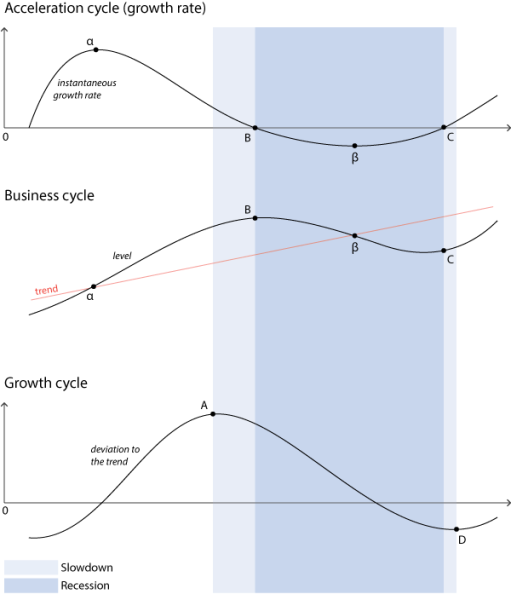
The main purpose of the Business Cycle Clock (BCC) is to complement the information contained in the euro indicators dashboard by extracting signals on the state of the economy. The BCC tool depicts in a visually appealing and intuitively understandable way cyclical developments in the euro area economy. The clock is structured according to the so-called αABβCD approach, which is based on an empirically observed sequence of turning points of the acceleration, business and growth cycles (see Figure 5).
The business cycle is meant to reproduce the cycle of the global level of activity of an economy. The turning points of this cycle, named B for peaks and C for troughs, separate periods of negative growth (recessions) from periods of positive growth (expansions). The growth cycle can be defined as the deviation of the reference series (GDP for example) to the trend. The growth cycle has turning points named A for peaks and D for troughs. Peak A is reached when the growth rate decreases below the trend growth rate. Symmetrically, trough D is reached when the growth rate overpasses it again. The acceleration cycle, also called the growth rate cycle, relating to increases and decreases in the growth rate of the economic activity. The peak, turning point α, represents a local maximum of the growth rate. On the contrary, the trough (turning point β) indicates a local minimum of the growth rate. The acceleration cycle is characterised by the highest number of fluctuations and a high degree of volatility. The BCC tool is based on two complementary exercises: the dating system with the results shown in the line chart in the lower part of the tool and the detecting system with the results appearing in the clocks in the upper part of the tool (see Figure 6).
The dating exercise is designed to identify past turning points simultaneously in the acceleration, business and growth cycles having the αABβCD framework as reference. The turning points are identified by means of a non-parametric dating rule very similar to the one proposed by Harding and Pagan (2002)[1]. The main reference series for the dating exercise is the quarterly GDP in volume, complemented by the industrial production index (IPI). The dating exercise is carried out on a quarterly basis. The turning points identified in the last 3 years are considered provisional and are then subject to revisions.
The detecting exercise is based on a purely parametric approach using the Markov switching models as the main modelling methodology. Three coincident cycle indicators are estimated: the business cycle coincident indicator (BCCI), the growth cycle coincident indicator (GCCI) and the acceleration cycle coincident indicator (ACCI). The business cycle coincident indicator (BCCI) provides the probability of a recession and signals the peaks and troughs of the business cycle. The growth cycle coincident indicator (GCCI) provides the probability of a slowdown in the economy and signals the peaks and troughs of the growth cycle. The acceleration cycle coincident indicator (ACCI) provides the probability of a deceleration in the growth rate and signals the peaks and troughs of the growth rate cycle.
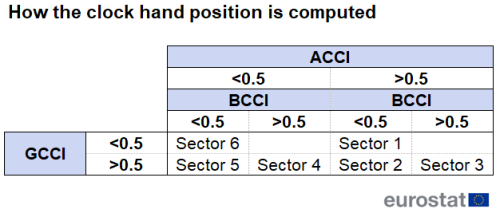
A multivariate Markov switching model is used to simultaneously estimate turning points for the growth and the business cycles. Turning points of the acceleration cycle are estimated independently by using a univariate Markov switching model. These estimations are carried out on a monthly basis. The location of the hand in the BCC tool is based on the values of the 3 cyclical coincident indicators for the acceleration, business and growth cycles, in particular on their positioning with respect to the 0.5 threshold (see Table 1).
The clock has 6 sectors (see Figure 7), which can be interpreted as follows:
- In the upper and lower right quadrants of the clock, sectors 1, 2 and 3 indicate a decrease in the growth rate. In the first quadrant, the growth rate is still above the trend growth rate. At point A, the growth rate slips below the trend growth rate. In the second quadrant, the growth rate is below the trend growth rate. At point B, it becomes negative and at point β, the growth rate reaches a minimum.
- In the lower and upper left quadrants of the clock, sectors 4, 5 and 6 indicate an increase in the growth rate. In the third quadrant, the growth rate is still below the trend. At point C, it becomes positive and at point D, it overpasses the trend growth rate.
The names of the sectors are included in Figure 7.
The BCC and the cycle coincident indicators are presented in more detail in several chapters of the Handbook on Cyclical Composite Indicators and Eurostat's Business Cycle Clock – A user's guide (see also Billio, Ferrara, Mazzi, Moauro (2016)[2], Billio, Ferrara, Mazzi, Ruggeri-Cannata (2016)[3], and Mazzi (2015)[4]). An overview of the methodology is also available in The Eurostat Business Cycle Clock: a complete overview of the tool (Ruggeri-Cannata (2021)[5]). Information on how the tool has been performing during the pandemic can be found in The Eurostat business cycle clock and the pandemic: Some considerations (Ruggeri-Cannata, Ronkowski (2022)[6]).
Footnotes
- Harding D., Pagan A. (2002), Dissecting the cycle: A methodological investigation, Journal of Monetary Economics, 49, 365-381. ↑
- Billio M., Ferrara L., Mazzi G.L., Moauro F. (2016), A multivariate system for turning point detection in the euro area, Eurostat statistical working papers. ↑
- Billio M., Ferrara L., Mazzi G.L., Ruggeri-Cannata R. (2016), Probabilistic coincident indicators of the classical and growth cycles, Eurostat statistical working papers. ↑
- Mazzi G.L (2015), Complementing scoreboards with composite indicators: the new business cycle clock, EURONA, Eurostat. ↑
- Ruggeri-Cannata R. (2021), The Eurostat Business Cycle Clock: a complete overview of the tool, Statistical Journal of the IAOS vol. 37, no. 1, pp. 309–323, 2022. ↑
- Ruggeri-Cannata R., Ronkowski P. (2022), The Eurostat business cycle clock and the pandemic: Some considerations, Statistical Journal of the IAOS vol. 38 pp. 577–590, 2022, DOI 10.3233/SJI-220011. ↑


