- European Commission
- Employment, Social Affairs and Equal Opportunities
- Employment in Europe 2010
- Foreword
- Table of contents
- Executive summary
- Chapter 2: On the path to recovery:
a review of labour market measures- 1. Introduction
- 2. A framework for analysis
- 3. Maintaining employment, creating
jobs and promoting mobility - 4. Upgrading of skills and labour
market matching - 5. Increasing access to employment
and supporting household income - 6. Assessment of the crisis-related
measures - 7. Employment policy actions
beyond 2010 - 8. Conclusions
- References
- Annex 1
- Annex 2
- List of acronyms
a review of labour market measures
BOX 5: Self-employment in Europe
The typical European firm is a micro-enterprise (less than 10 people) and accounts for more than 90% of all firms in the EU and 95 % of newly created companies. Micro-enterprises employ almost one-third of the total private labour force. Entrepreneurship, and self-employment in particular, play a key role in small business creation. Given that 30% of the self-employed have employees of their own, these newly-created firms contribute significantly to job creation and therefore to achieving the European Union’s goal of more growth and jobs. This was acknowledged in the Small Business Act for Europe (SBA(1)) in mid-2008, in the national and European economic recovery plans and, more recently, with the creation of a EUR 100 million “European Progress Microfinance Facility” to make it easier for people who have lost or risk losing their jobs to get credit to start up small businesses. Furthermore, the newly-proposed EU 2020 strategy(2) puts a special emphasis on entrepreneurship and the June 2010 Directive on self-employed workers and assisting spouses gives improved social protection to the self-employed, including the right to maternity leave.
Self-employment, including employers, accounted for nearly 15% of total employment (more than one job in seven) in EU27 in 2009(3) and is an essential component of the EU’s economic dynamism. Between 2002 and 2007, boosted, among other things, by new communication technologies and a generally more favourable business environment for the services sector, the number of SMEs in the EU increased by over 2 million (more than 10%).(4) However, the contribution of self-employment to total employment growth in recent years has been limited. While the number of self-employed people grew by an average of 0.3% per year between 2000 and 2008 (peaking at roughly 33 million in 2007), the growth in salaried employment amounted to 1.4% per year over the same period. As a result, the number of self-employed people only grew by 0.8 million between 2000 and 2008, compared with overall employment growth of nearly 20 million. Most Member States have therefore experienced declining self-employment rates (SER(5)) over this period, with the notable exceptions of Czech Republic, Germany, Malta, Netherlands, Austria, Slovakia and United Kingdom. The EU’s average self-employment rates declined almost continuously from 15.8% in 2000 to 14.8% in 2008, affecting both men and women, as well as every age group.
The economic crisis cost more than 5 million jobs between the first quarter of 2008 and the first quarter of 2010, while the unemployment rate climbed from 7% to 10.1%. Self-employment was no exception, as roughly 450 000 self-employed people lost their jobs in that period (LFS data). Yet the self-employed sector has shown a degree of resilience, as the relative employment decline has been more moderate in comparison with dependent work. Overall, 2009 was a year of stabilisation for self-employment and this was confirmed in subsequent quarters. Compared to 2008, the number of self-employed fell by less than 1%, while that of dependent employees fell by nearly 2%. In a majority of Member States, SER consequently picked up and the EU SER average edged up to 15% in the first quarter of 2009, remained stable through the year and picked up until recently (15.2% in 2010q1 and 2010q2).
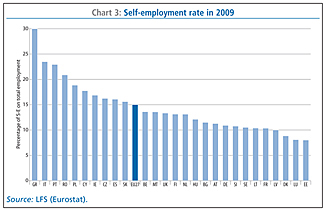
The downturn has not radically altered the distribution of self-employment across countries. It remains stronger in southern Member States with larger agricultural sectors such as Greece (SER in 2009 = 29.9%), Italy (23.4%), Portugal (22.8%) and Romania (20.8%), and weaker in countries such as Luxembourg, Estonia and Denmark (8.0, 8.1 and 8.8%, respectively, see Chart 3).
18.6 % of self-employed people work in agriculture, 17.0% in wholesale and retail, 13.4 % in construction and 10.3 % in professional, scientific and technical activities (2009 figures). Nearly 45 % of the self-employed work in services, ranging from trade to transport, financial and real estate activities, while only one-third of paid employees work in that sector. Conversely, self-employment is less industrial than dependent employment and nearly absent from public services. Regarding the typical profile of the self-employed in the EU, in 2009, 69.6 % were male and 37.5% aged over 50, compared to 52.5 % and 23.9 % respectively in salaried employment. On average, the highest level of education attained by the self-employed is comparable with that of paid employees, although the proportion who are lower-skilled(6) remains, at 27.8%, significantly higher than for paid employees (21.3%).
In the EU, the preference levels for self-employment have remained stable between 2007 and 2009(7): 45% of all Europeans would like to be self-employed, while 49% say they would prefer working as an employee. Conversely, in the US, the preference for self-employment has decreased from 61% to 55% over the same period. Men generally express a stronger preference for self–employment (51%) than women (39%), and young people are more inclined to start a business than older citizens. In all, 52% of those aged 15-24 prefer self-employment compared with 47% of those between 25 and 39 and 46% of those between the ages of 40 and 54. A good education promotes the desire for self-employment. Self-fulfilment, independence and free choice of place and time of work are the main reasons for starting up one’s own business, while citizens from the newer Member States also appreciate the prospect of a better income.
Appropriate labour market policies are key to supporting growth in self-employment in the EU. Start-up incentives in particular are an essential component of support for business creation. More than 770 000 people benefited from such measures in 2008, accounting for a total budget of EUR 4.1 billion, i.e. roughly 0.03% of EU GDP(8). Compared to incentives aimed at stimulating the hiring of unemployed people for dependent jobs, start-up incentives may prove cost-effective, considering that successful self-employment may lead to subsequent hiring of dependent employees. More recently, self-employment has been supported under the national and European economic recovery plans and the new “European Progress Microfinance Facility”(9). In order to improve the efficiency of such measures, further attention is needed, in particular to cost-effectiveness (through mutual learning) and the sustainability and quality of self-employment.
The quality of working life for self-employed people is of concern. A total of 18% of self-employed people are classified as poor, against 6% of employees and their median equivalised disposable income amounts to EUR 12 000 per year, i.e. 3 700 less than for employees. Self-employed people with employees work, on average, 50 hours per week(10), i.e. 13 more than paid employees and eight more than stand-alone entrepreneurs. Although employers have more training opportunities than self-employed people without employees, they lag behind the paid employees. As regards health issues, 41% of the self-employed say that work has an adverse effect on their health and 25% consider work stressful, against 33 and 21% respectively for paid employees.(11) The new EU Directive on self-employed workers and assisting spouses is expected to partly address these issues, through granting self-employed women, assisting spouses and life partners of self-employed workers a maternity allowance and a leave period of at least 14 weeks, for the first time at the EU level.
| (1) | See the Communication on http://eur-lex.europa.eu/LexUriServ/LexUriServ.do?uri=COM:2008:0394:FIN:en:PDF and SME Performance Review – SBA Fact Sheets, European Commission. |
| (2) | More information on http://ec.europa.eu/eu2020/index_en.htm |
| (3) | Labour Force Survey, LFS, Eurostat. |
| (4) | Structural Business Statistics, SBS, Eurostat. |
| (5) | Corresponding to pre-primary, primary and lower secondary education - levels 0-2 (ISCED 1997). |
| (6) | Self-employed as a percentage of total employment. |
| (7) | According to the Flash Eurobarometer No. 283 on “Entrepreneurship in the EU and beyond”, More information at http://ec.europa.eu/public_opinion/flash/fl_283_en.pdf |
| (8) | Source: LMP database, Eurostat. |
| (9) | More information on http://ec.europa.eu/social/main.jsp?catId=836&langId=en |
| (10) | Source: LFS (2008), Eurostat. |
| (11) | Source: EWCS (2005), read also OSHA (2010), “OSH in figures: stress at work — facts and figures”, http://osha.europa.eu/en/publications/reports/TE-81-08-478-EN-C_OSH_in_figures_stress_at_work/view. |
Source: “Working poor in Europe”, European Foundation for the Improvement of Living and Working Conditions, March 2010, and EU-SILC (2008). The median equivalised disposable income reached EUR 15 000 for employers and EUR 11 100 for stand-alone entrepreneurs in the same year. The “equivalised disposable income” is the household’s total disposable income divided by its “equivalent size”, to take account of the size and composition of the household, and is attributed to each household member.