

The indicators presented in this article come from regional GDP and employment data published today. The article shows only a small part of the large amount of regional data available at Eurostat.
Source dataset: nama_10r_2gdp
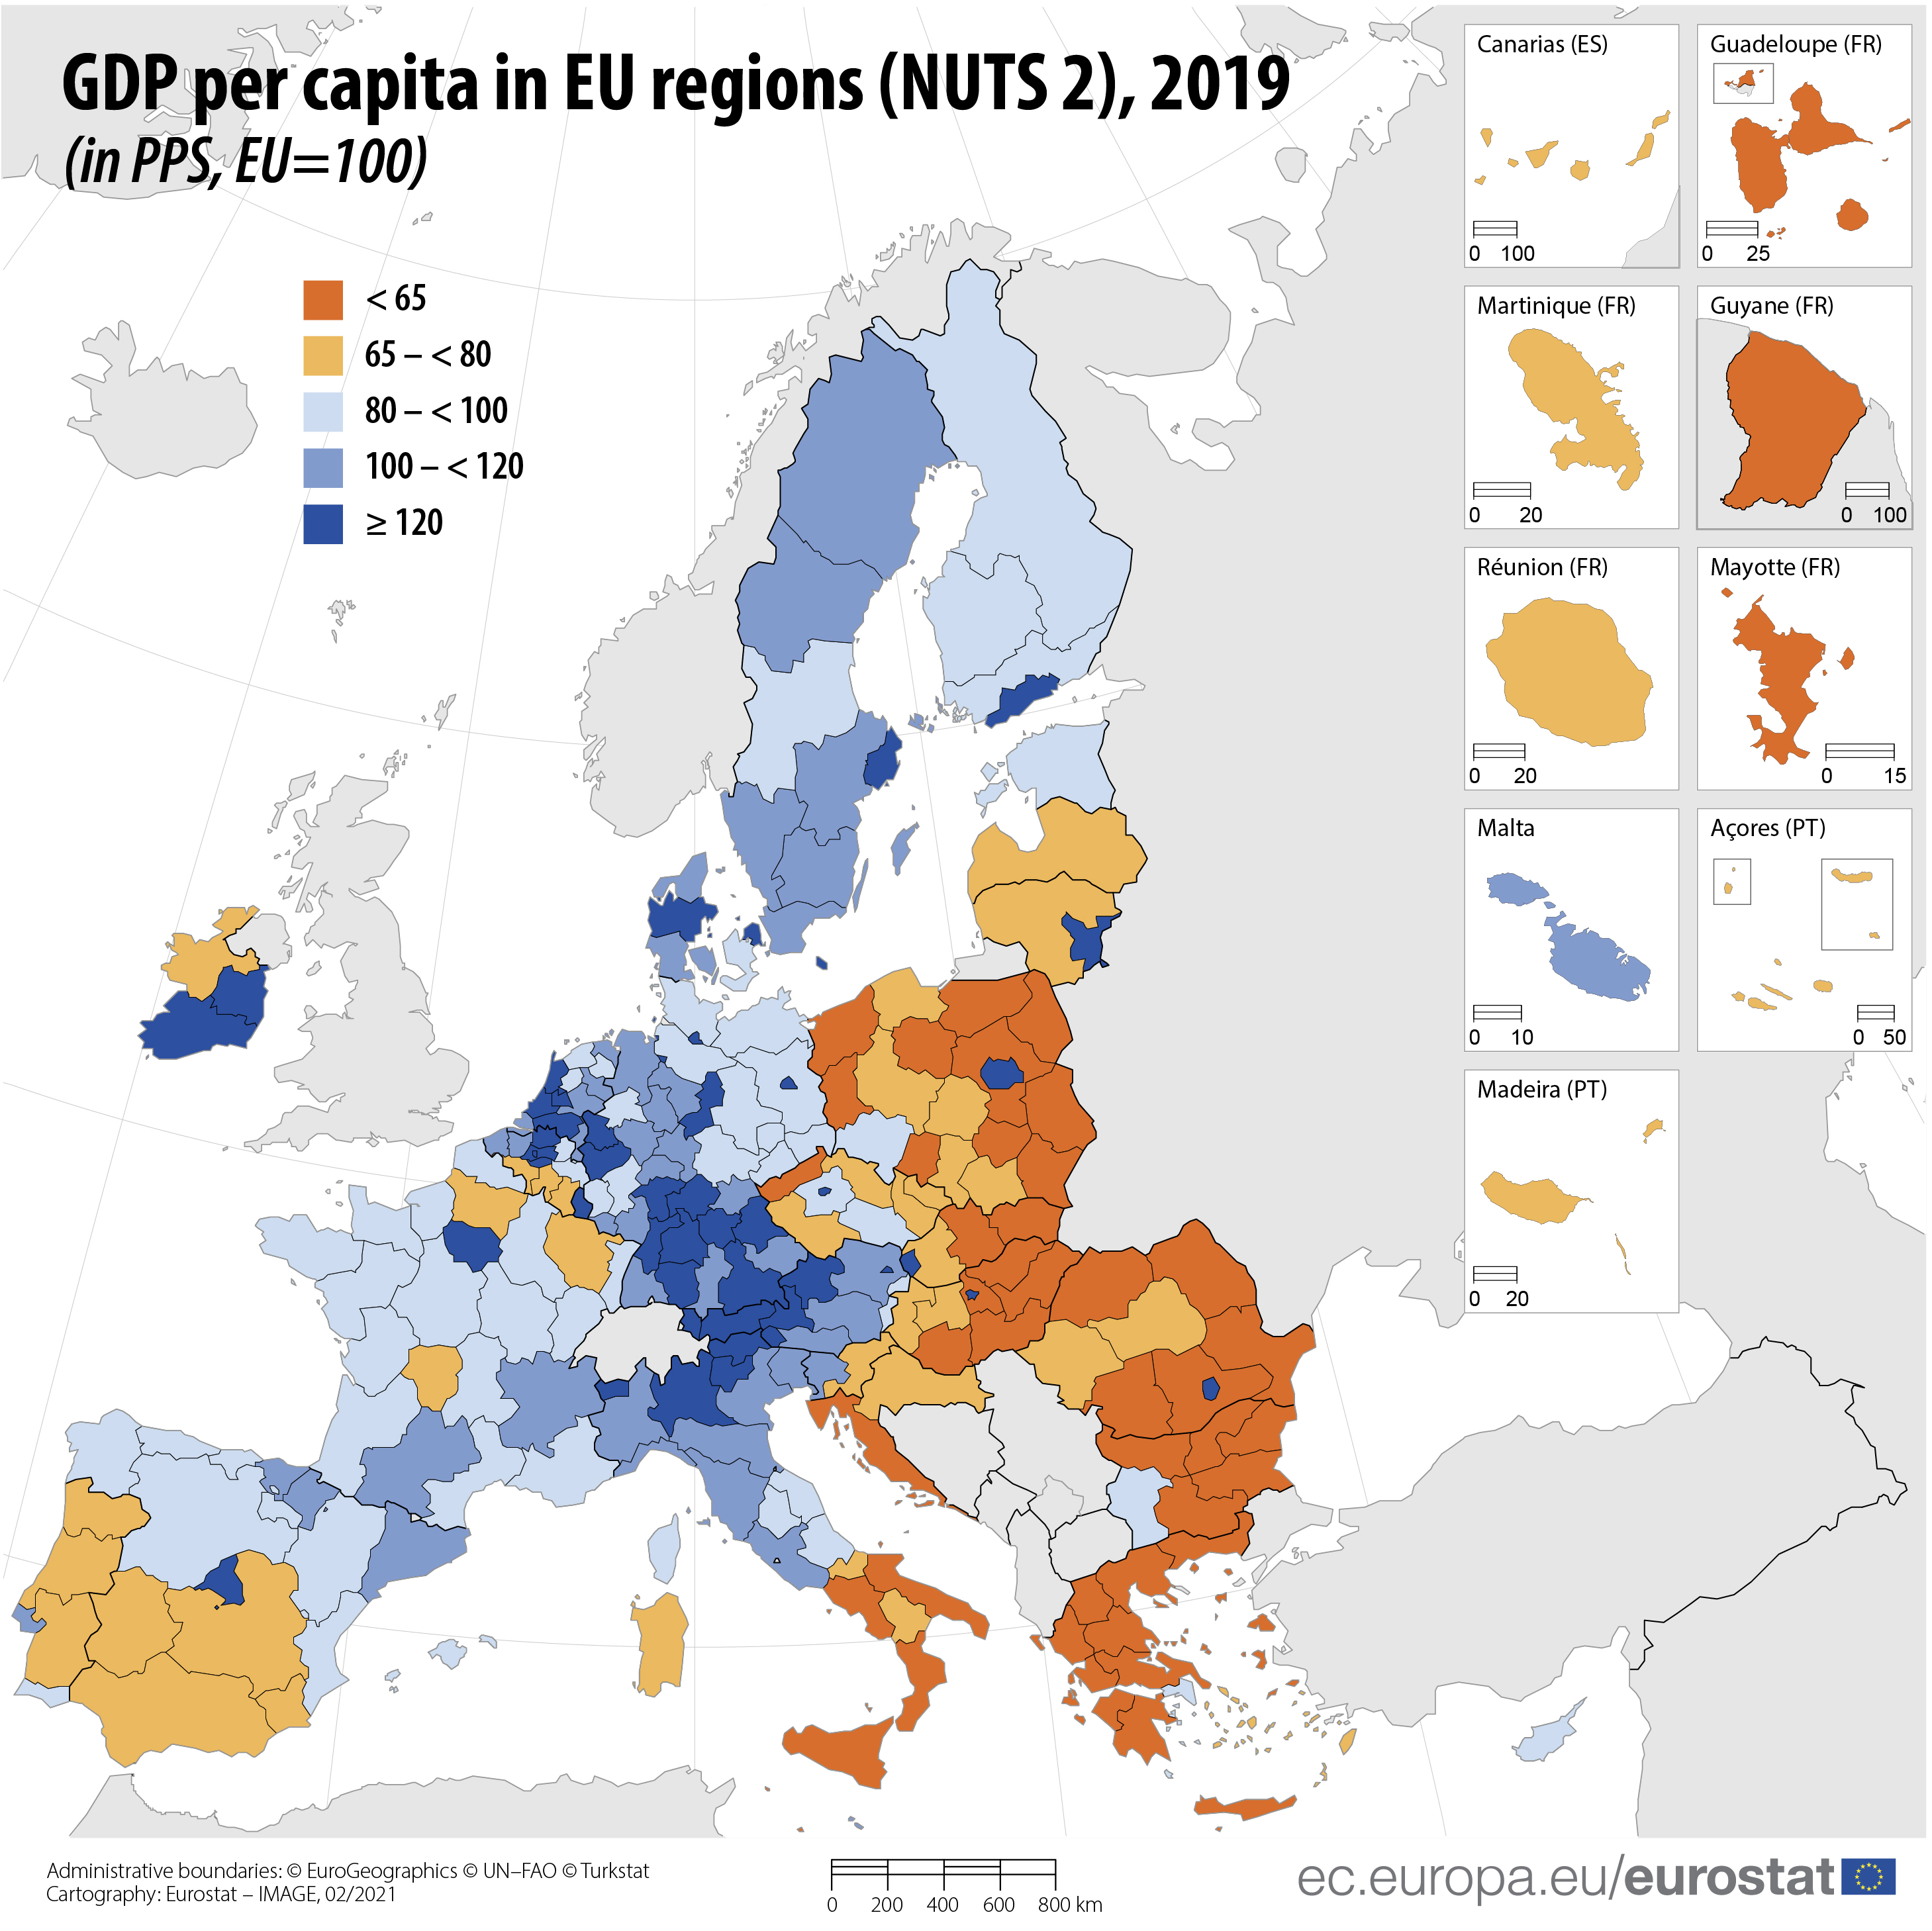
The leading regions in the ranking of regional GDP per capita in 2019, after Luxembourg (260% of the EU average), were Southern (240%) in Ireland, Prague (205%) in Czechia, Brussels in Belgium and Eastern & Midland in Ireland (both 202%) as well as Hamburg (195%) in Germany. The high GDP per capita in these regions can be partly explained by a high inflow of commuting workers (Luxembourg, Prague, Brussels and Hamburg) or by the large capital assets owned by some multinationals domiciled in the regions (Southern and Eastern & Midland in Ireland).
In contrast, after North-West in Bulgaria and Mayotte (both 32% of the EU average), the lowest regions in the ranking were the remaining non-capital regions of Bulgaria: North-Central (35%), South-Central (37%), South-East (40%) and North-East (41%). In the case of Mayotte, demographic factors mainly explain the low GDP per capita, since 44% of the population is less than 15 years old.
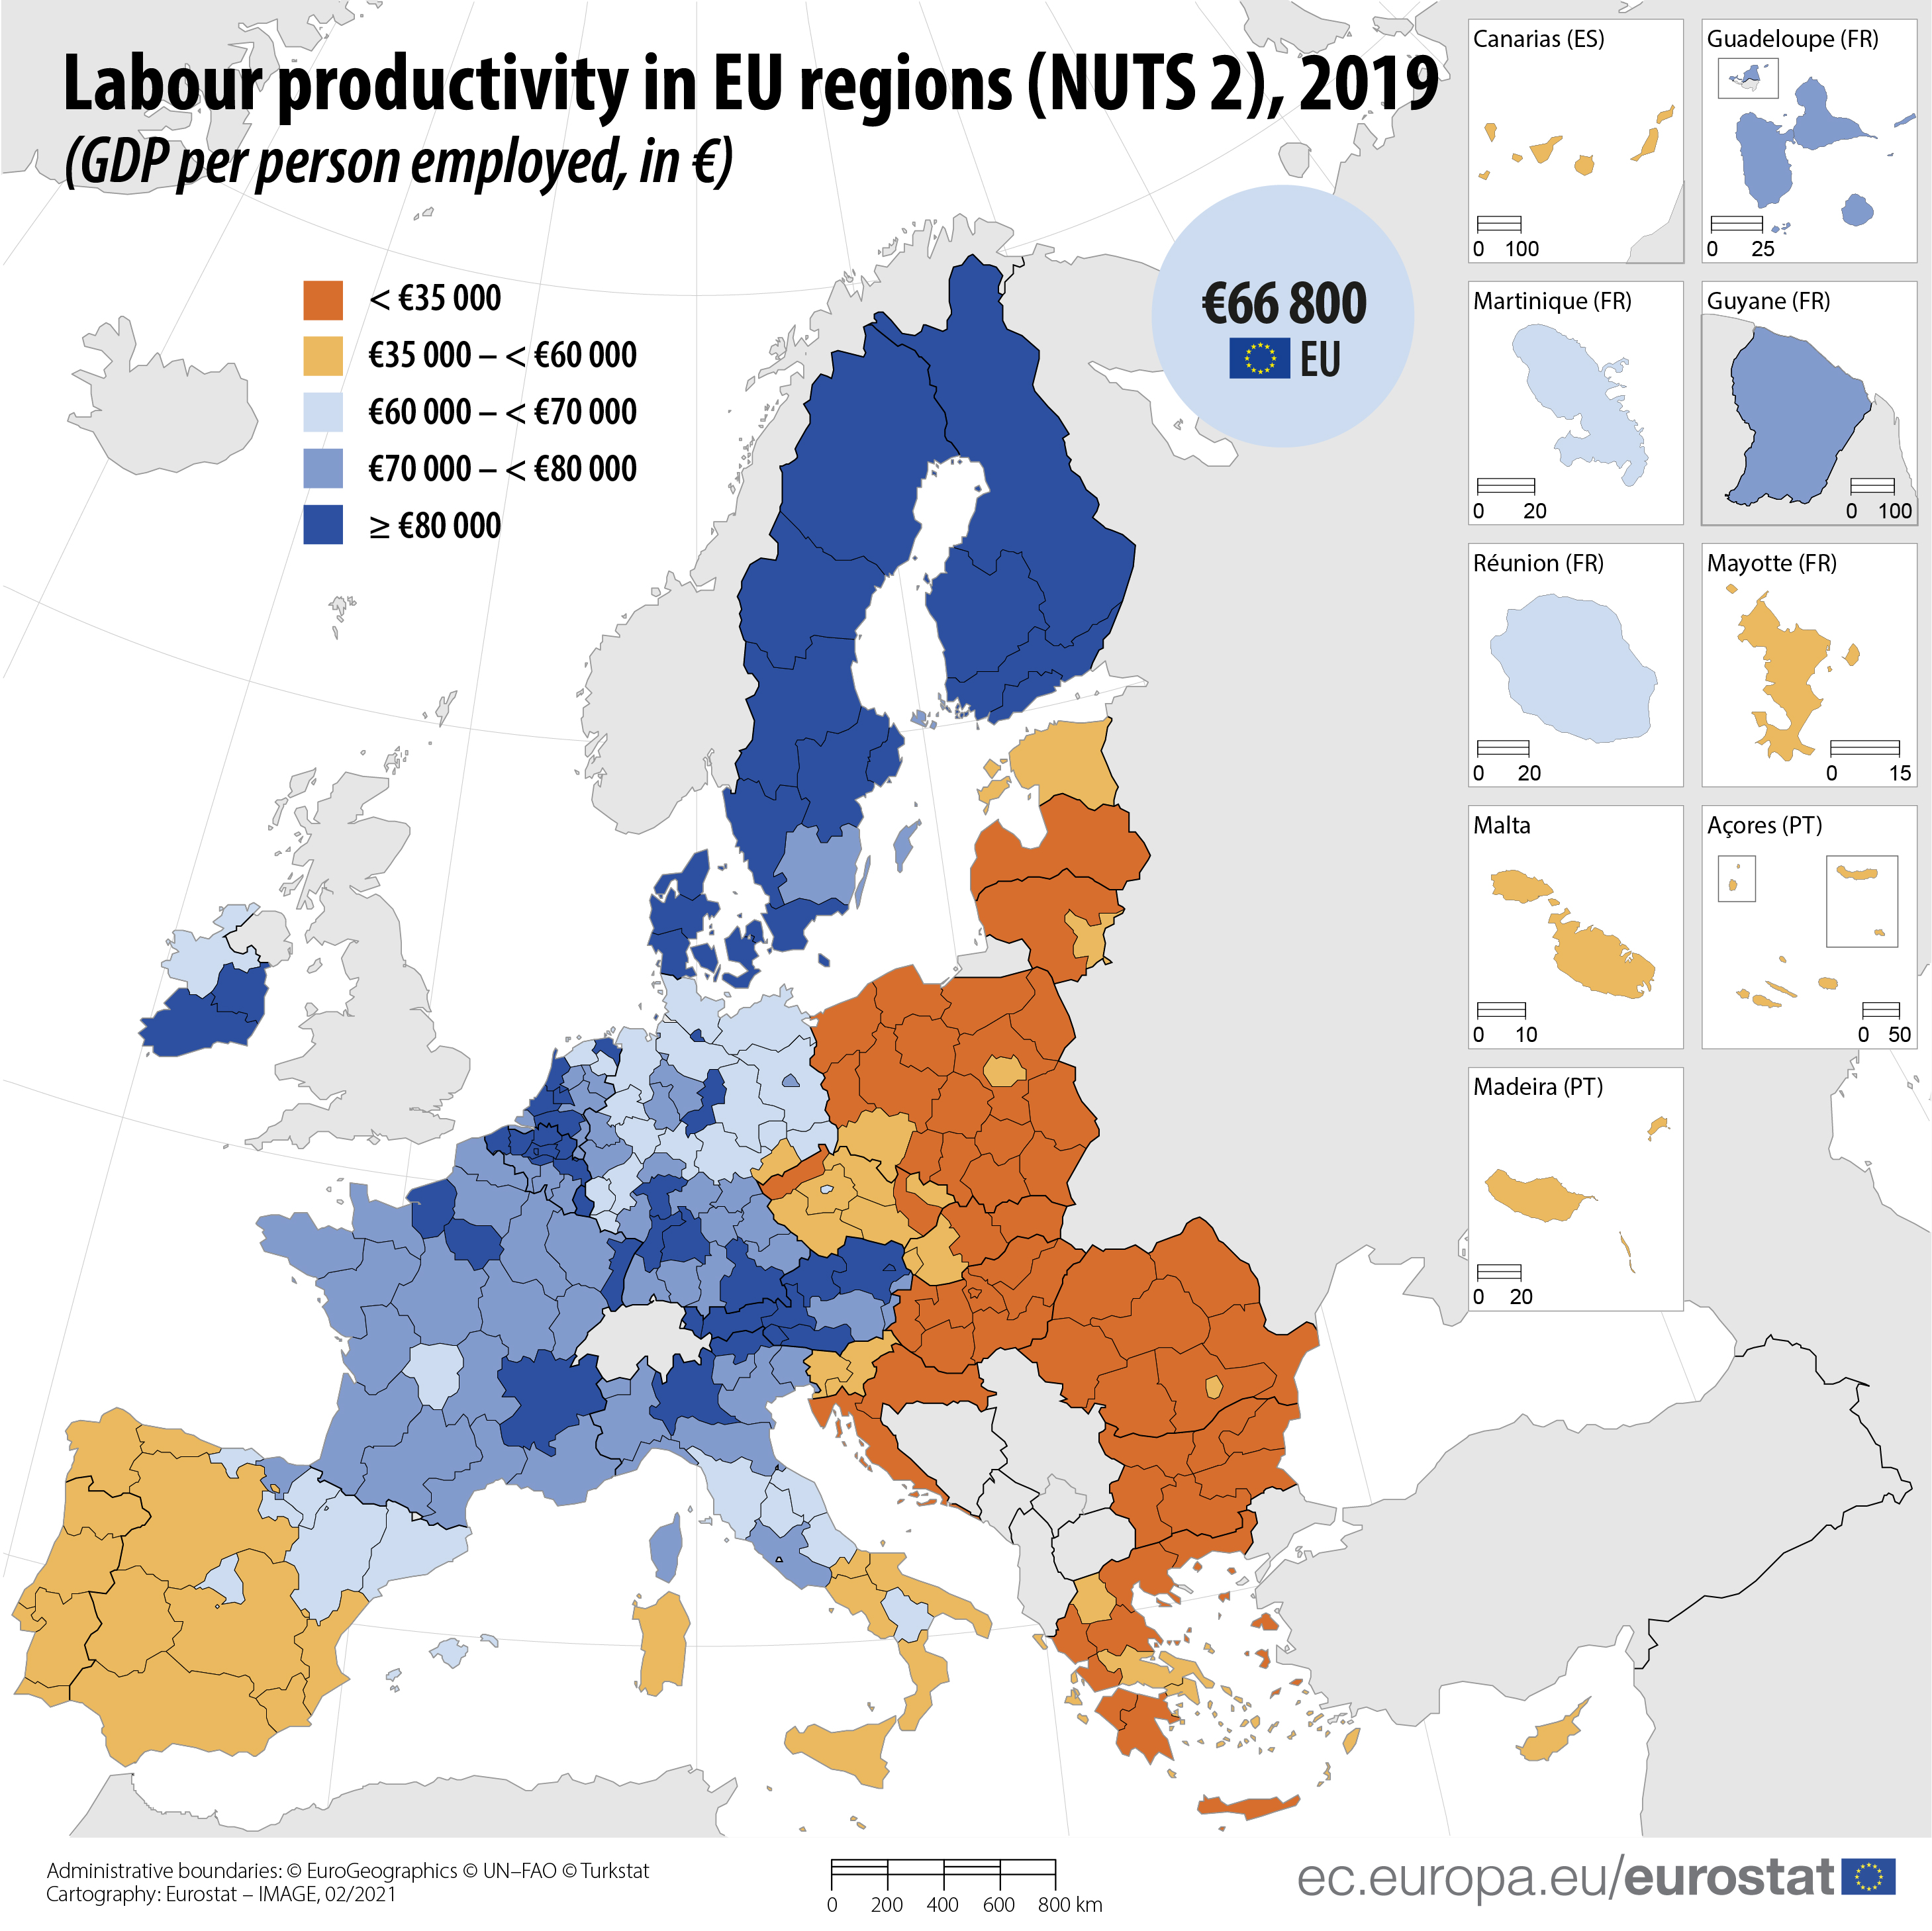
Regional differences in labour productivity
In 2019, regional GDP per person employed ranged from €12 700 in North-Central in Bulgaria to €205 500 in Southern in Ireland, compared with the EU average of €66 800. This ‘labour productivity’ measures the overall productivity of regional economies without adjusting for differences in price levels or average hours worked.
After Southern (€205 500), the leading regions in the ranking of regional GDP per person employed in 2019, were Eastern & Midland (€156 900) in Ireland, Grand Duchy of Luxembourg (€136 600), Walloon Brabant (€123 400) and Brussels (€121 200) in Belgium.
Source datasets: nama_10r_2gdp (GDP) and nama_10r_3empers (employment)
In contrast, the lowest levels of labour productivity were recorded in three Bulgarian regions: North-Central (€12 700), South-Central (€13 000) and North-West (€13 400).
For more information:
To contact us, please visit our User Support page.
For press queries, please contact our Media Support.