Tutorials
Log in
Statistics Explained
menu
search
search
Navigation
Main page
Statistical themes
Glossary
Categories
Statistics 4 beginners
Tutorials
Help
Eurostat home
Education corner
Online publications
Regional yearbook
Sustainable development
Full list
Tools
User contributions
Logs
View user groups
Special pages
search
Navigation
Main page
Statistical themes
Glossary
Categories
Statistics 4 beginners
Tutorials
Help
Eurostat home
Education corner
Online publications
Regional yearbook
Sustainable development
Full list
Tools
User contributions
Logs
View user groups
Special pages
Navigation
Main page
Statistical themes
Glossary
Categories
Statistics 4 beginners
Tutorials
Help
Eurostat home
Education corner
Online publications
Regional yearbook
Sustainable development
Full list
Tools
User contributions
Logs
View user groups
Special pages
Uploads by Fortiro
This special page shows all uploaded files.
File list
Items per page:
20
50
100
250
500
Search for media name:
Username:
Include old versions of files
Go
First page
Previous page
Next page
Last page
Date
Name
Thumbnail
Size
Description
Versions
16:13, 13 December 2017
Fisheries statistics in detail Version 6 E1-update.xlsx
(
file
)
250 KB
1
10:50, 8 December 2017
Aquaculture production by value, EU-28, Iceland, Norway and Turkey, 2008 and 2015 (EUR million) .png
(
file
)
21 KB
Reverted to version as of 08:12, 8 December 2017
5
10:46, 8 December 2017
AQ sectionv2.xlsx
(
file
)
86 KB
1
10:10, 8 December 2017
Aquaculture production, EU-28, Iceland, Norway and Turkey, 2008 and 2015 (tonnes of live weight and % of total fisheries production).png
(
file
)
32 KB
3
08:14, 8 December 2017
AQ sectionv1.xlsx
(
file
)
86 KB
1
08:10, 8 December 2017
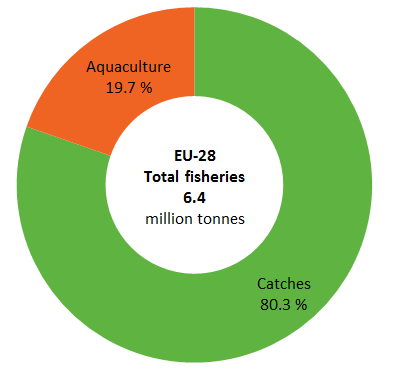
Aquaculture production and fish catches, EU-28, 2015 (% of total fisheries production, tonnes live weight).png
(
file
)
11 KB
2
19:27, 7 December 2017
Vineyards 2015 SEv3 E1.xlsx
(
file
)
142 KB
1
19:26, 7 December 2017
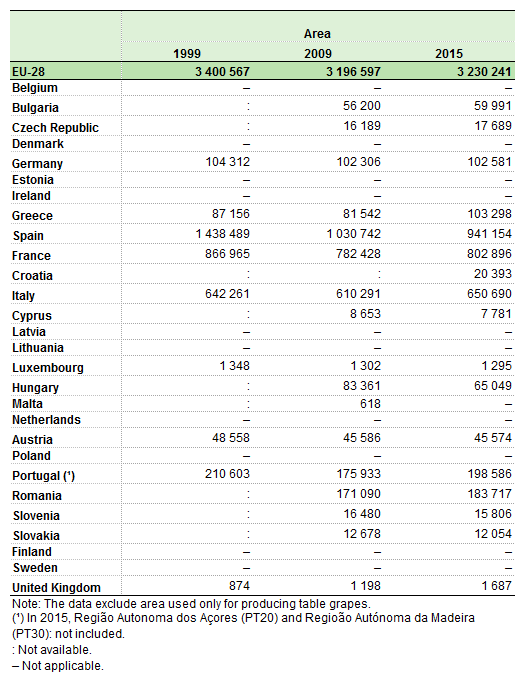
Area under vines, 1999, 2009 and 2015.png
(
file
)
27 KB
3
12:34, 6 December 2017
Vineyards 2015 SEv2 E1.xlsx
(
file
)
142 KB
1
17:55, 4 December 2017
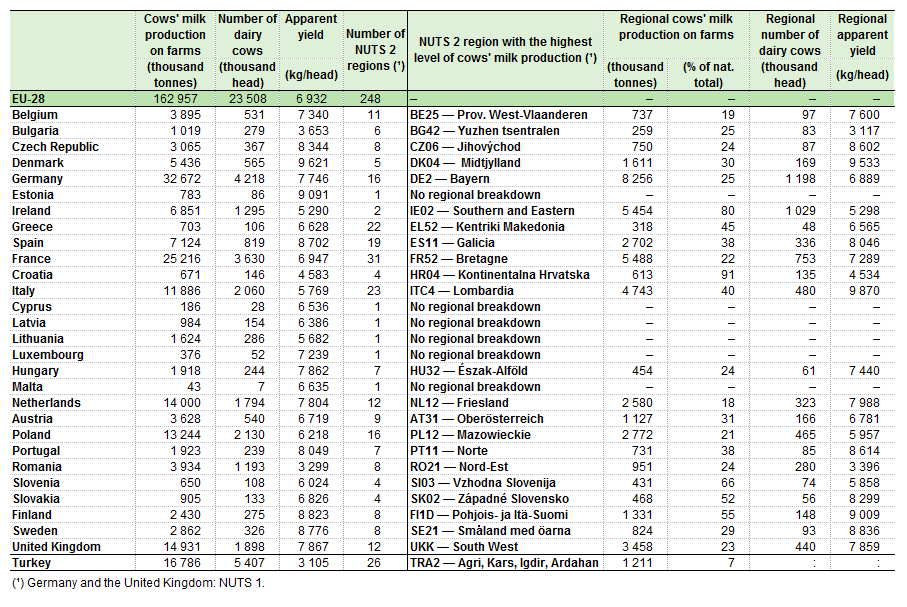
Production of cows milk on farms at national and regional level, by level of.png
(
file
)
68 KB
3
17:55, 4 December 2017
Production and use of milk, EU-28, 2016.png
(
file
)
43 KB
3
17:54, 4 December 2017
Milk and milk products statistics v6.xlsx
(
file
)
159 KB
1
16:03, 1 December 2017
Milk and milk products statistics v5.xlsx
(
file
)
160 KB
1
16:00, 1 December 2017
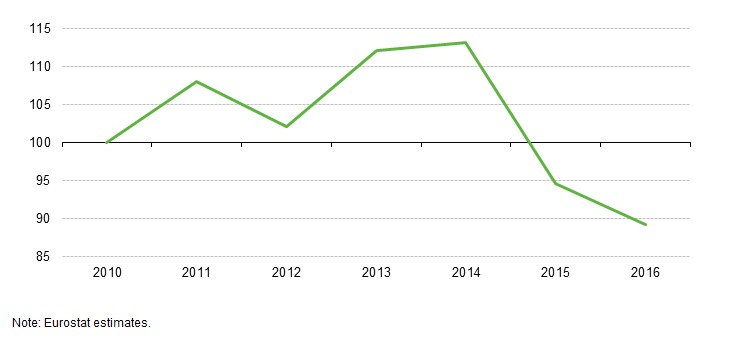
Deflated prices indices for milk, EU-28, 2010-2016.png
(
file
)
9 KB
2
15:59, 1 December 2017
Dairy products obtained from milk, 2016.png
(
file
)
27 KB
2
15:58, 1 December 2017
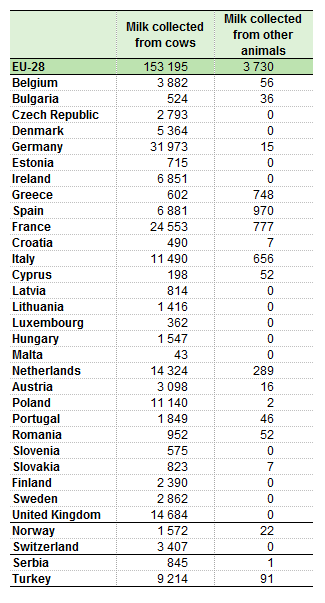
Collection of milk by dairies, 2016 (1 000 tonnes).png
(
file
)
21 KB
2
19:02, 9 November 2017
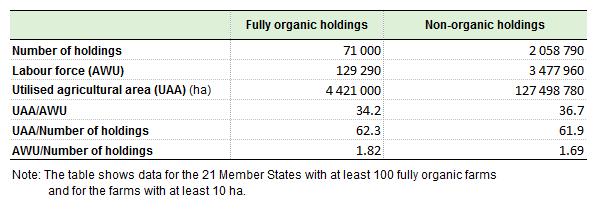
T3 Fully organic and non-organic farms by key variables, EU-28, 2013.png
(
file
)
12 KB
2
14:28, 9 November 2017
T2 Distribution of farm holdings, utilised agricultural area and farm labour force, EU-28, 2010 and 2013.png
(
file
)
15 KB
1
14:27, 9 November 2017
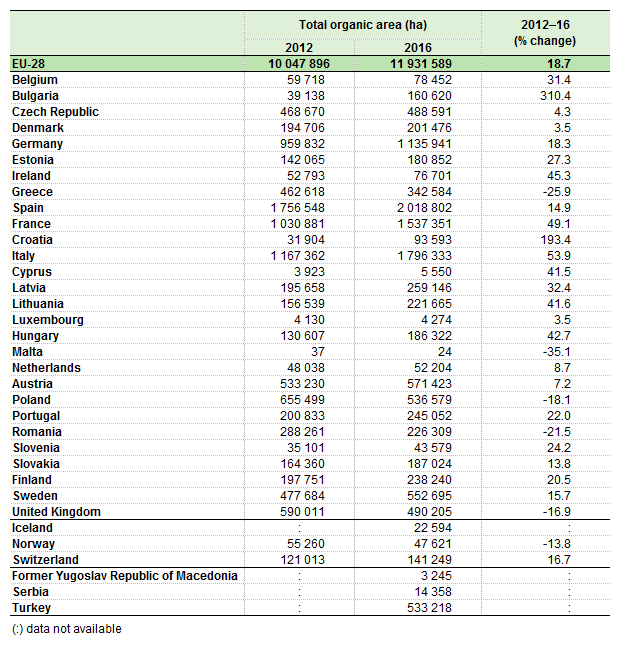
T1 Total organic area, 2012 and 2016.png
(
file
)
36 KB
1
14:27, 9 November 2017
F8 Fully organic farms and partially organic farms, 2013 (% of total organic farms).png
(
file
)
45 KB
1
14:25, 9 November 2017
Organic farming 2017 final RF.xlsx
(
file
)
142 KB
1
15:00, 25 October 2017
Livestock population, 2016 (million head).png
(
file
)
36 KB
1
14:58, 25 October 2017
Agriculture production animals SE.xlsx
(
file
)
289 KB
1
11:54, 31 July 2017
AEI Mineral fertiliser consumption SE.xlsx
(
file
)
64 KB
1
10:41, 31 July 2017
Table 1 Nitrogen fertiliser consumption by agriculture, EU-28, NO and CH, 2006-2015 (1000 tonnes).png
(
file
)
46 KB
1
10:39, 31 July 2017
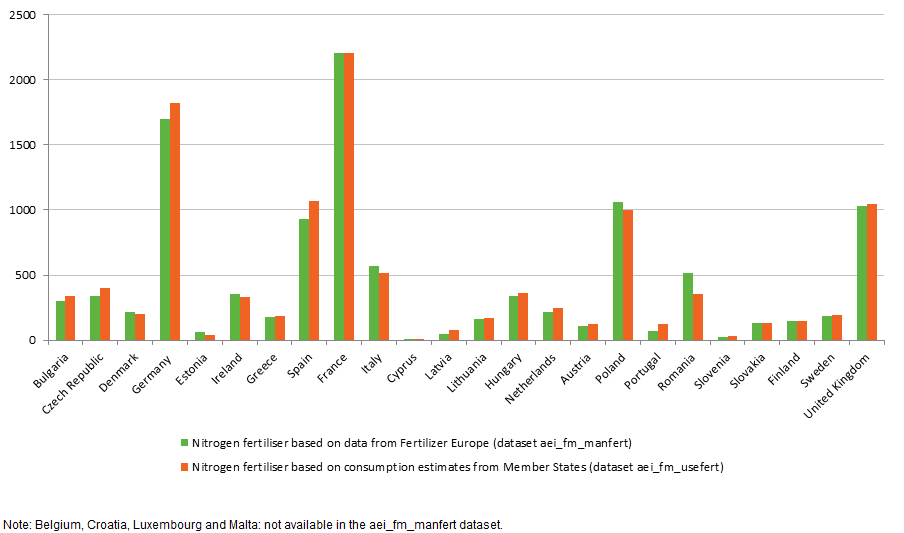
Statistics on nitrogen fertiliser, EU-28, 2015 (Thousand tonnes).png
(
file
)
32 KB
1
10:35, 31 July 2017
Estimated mineral fertiliser consumption by agriculture, EU-28, 2006-2015 (million tonnes of nutrient).png
(
file
)
9 KB
1
15:59, 29 May 2017
FSS thresolds.xlsx
(
file
)
137 KB
1
18:06, 31 March 2017
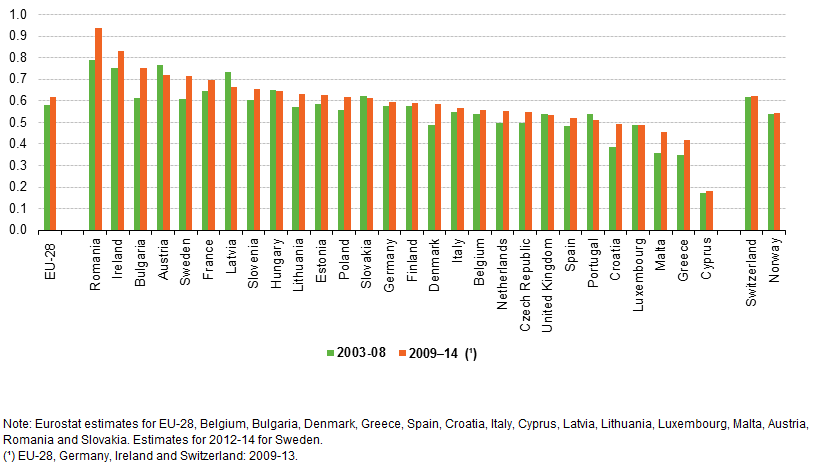
Nitrogen Use Efficiency, average 2003–08 vs 2009–14 (total nutrient outputs per total nutrient inputs).png
(
file
)
39 KB
3
18:05, 31 March 2017
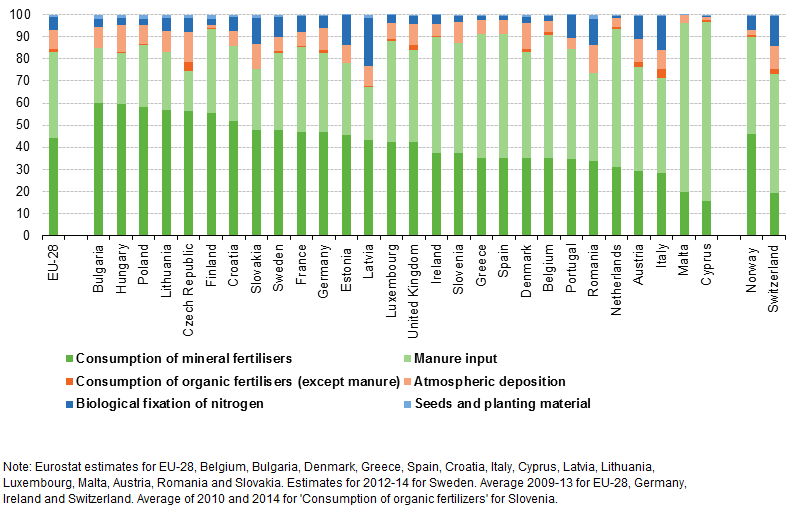
Share of the different phosphorus inputs in total phosphorus inputs, average 2009–14.png
(
file
)
46 KB
2
18:04, 31 March 2017
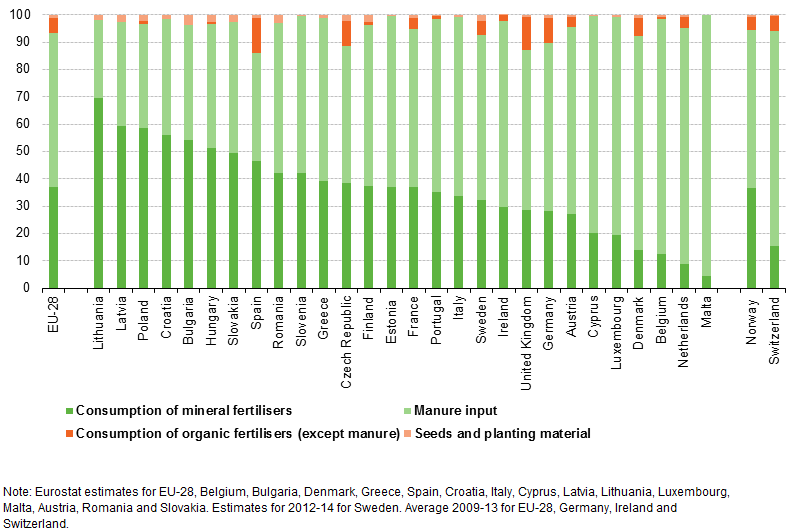
Share of the different nitrogen inputs in total nitrogen input, average 2009–14.png
(
file
)
46 KB
2
18:03, 31 March 2017
Gross phosphorus balance, averages 2003–08 and 2009–14.png
(
file
)
24 KB
2
18:02, 31 March 2017
Gross nitrogen balance, averages 2003–08 and 2009–14.png
(
file
)
33 KB
2
17:51, 31 March 2017
T2 Gross phosphorus balance, 1995, 2000, 2005 and 2010-14 (kg P per ha of utilised agricultural area).png
(
file
)
28 KB
1
17:50, 31 March 2017
T1 Gross nitrogen balance, 1995, 2000, 2005 and 2010-14 (kg N per ha of utilised agricultural area).png
(
file
)
34 KB
1
17:48, 31 March 2017
Pollution risks 2016 SE (corrected).xlsx
(
file
)
170 KB
2
16:10, 31 March 2017
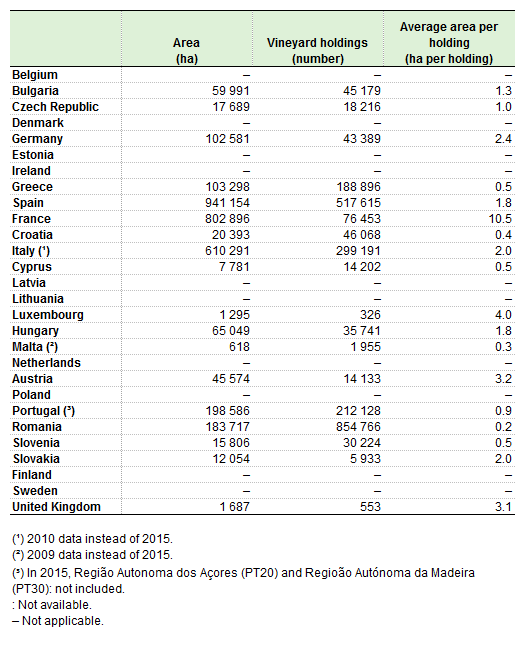
Key variables on wine-growing holdings, 2015-Tab2.png
(
file
)
27 KB
2
16:08, 31 March 2017
Vineyards 2015 SEv1.xlsx
(
file
)
137 KB
1
18:36, 29 March 2017
Wine-grower holdings by degree of specialization, EU, 2015 (% of total number of wine-growing holdings).png
(
file
)
24 KB
2
18:32, 29 March 2017
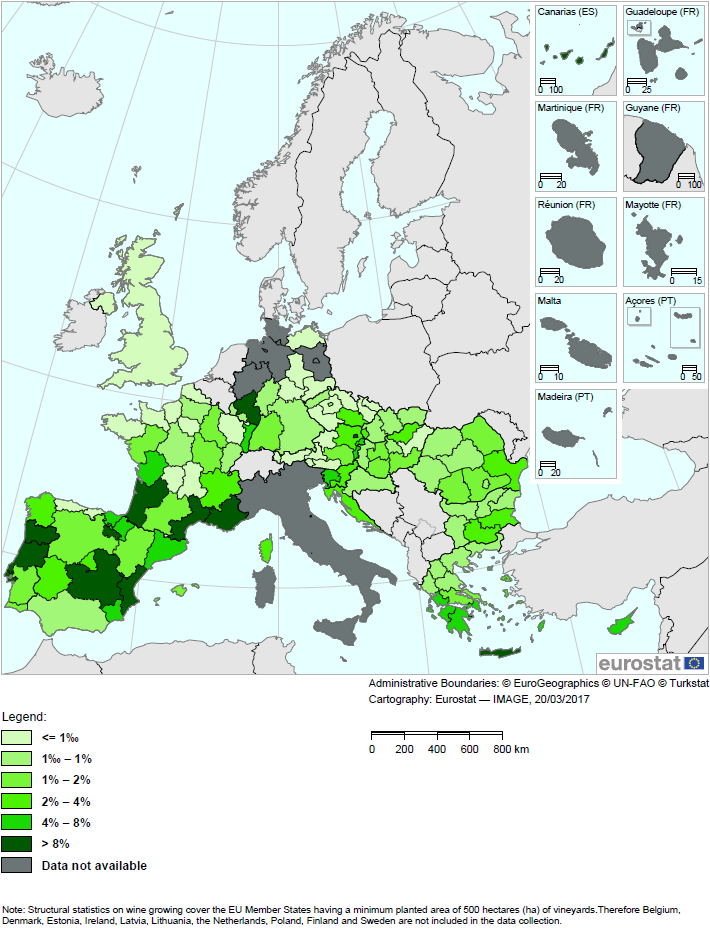
MAP.png
(
file
)
165 KB
1
14:09, 17 March 2017
Table 1 Classification of agricultural holdings by type of farming SOv1.xlsx
(
file
)
127 KB
1
11:57, 14 March 2017
Agricultural products crops 2015 14-12-2016v1.xlsx
(
file
)
274 KB
1
11:55, 14 March 2017
Production of cereals by main producing EU Member States, 2015 (% of EU-28 total).png
(
file
)
28 KB
5
11:51, 14 March 2017
Production of fruit and vegetables, 2015 (1 000 tonnes).png
(
file
)
37 KB
2
11:49, 14 March 2017
Production of olives for olive oil, by main producing EU Member States, 2015.png
(
file
)
18 KB
4
14:01, 13 March 2017
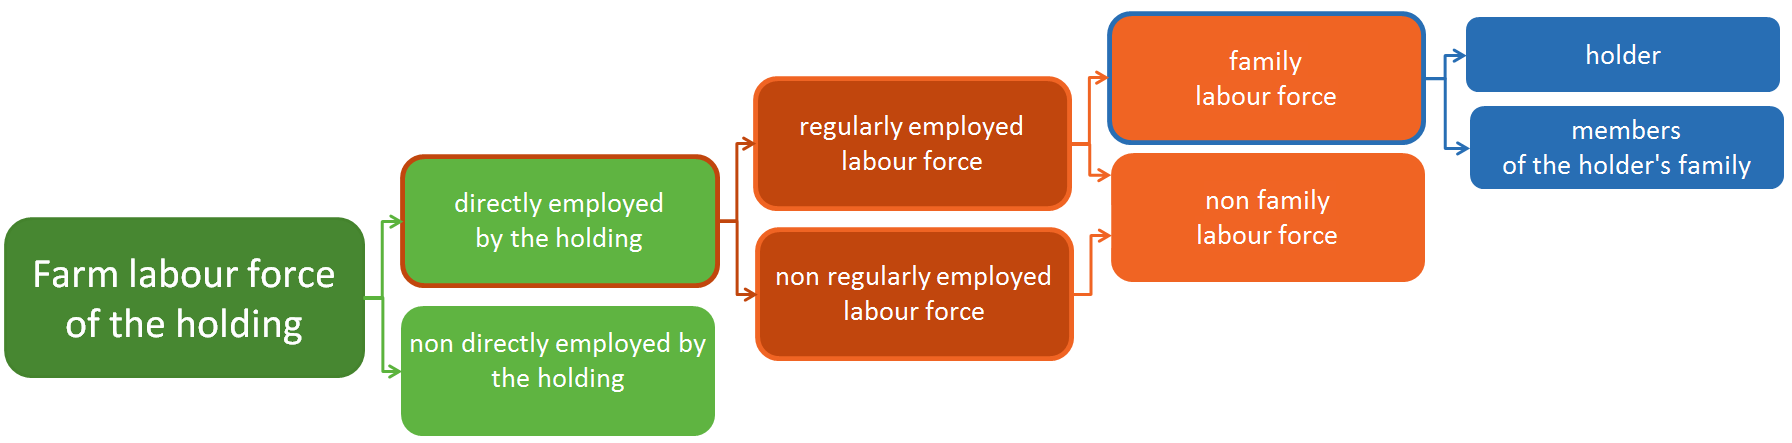
Labour force in FSS v1.PNG
(
file
)
40 KB
1
13:49, 13 March 2017
Labour force in FSS.PNG
(
file
)
41 KB
1
12:01, 13 March 2017
Table 1 Classification of agricultural holdings by type of farming SO.xlsx
(
file
)
125 KB
1
16:39, 3 February 2017
FSS-reference periods.xlsx
(
file
)
16 KB
2
16:56, 2 February 2017
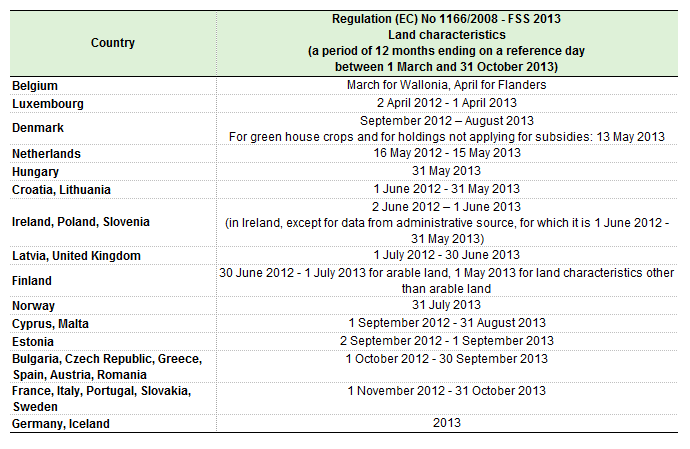
The reference periods for land characteristics v1.png
(
file
)
29 KB
1
First page
Previous page
Next page
Last page
Special page
ISSN 2443-8219
_.png)
.png)
.png)


.png)


.png)
.png)
.png)
.png)
.png)
.png)


.png)
.png)

.png)

.png)
.png)

