Tutorials
Log in
Statistics Explained
menu
search
search
Navigation
Main page
Statistical themes
Glossary
Categories
Statistics 4 beginners
Tutorials
Help
Eurostat home
Education corner
Online publications
Regional yearbook
Sustainable development
Full list
Tools
User contributions
Logs
View user groups
Special pages
search
Navigation
Main page
Statistical themes
Glossary
Categories
Statistics 4 beginners
Tutorials
Help
Eurostat home
Education corner
Online publications
Regional yearbook
Sustainable development
Full list
Tools
User contributions
Logs
View user groups
Special pages
Navigation
Main page
Statistical themes
Glossary
Categories
Statistics 4 beginners
Tutorials
Help
Eurostat home
Education corner
Online publications
Regional yearbook
Sustainable development
Full list
Tools
User contributions
Logs
View user groups
Special pages
Uploads by Silvapj
This special page shows all uploaded files.
File list
Items per page:
20
50
100
250
500
Search for media name:
Username:
Include old versions of files
Go
Date
Name
Thumbnail
Size
Description
Versions
14:56, 5 December 2022
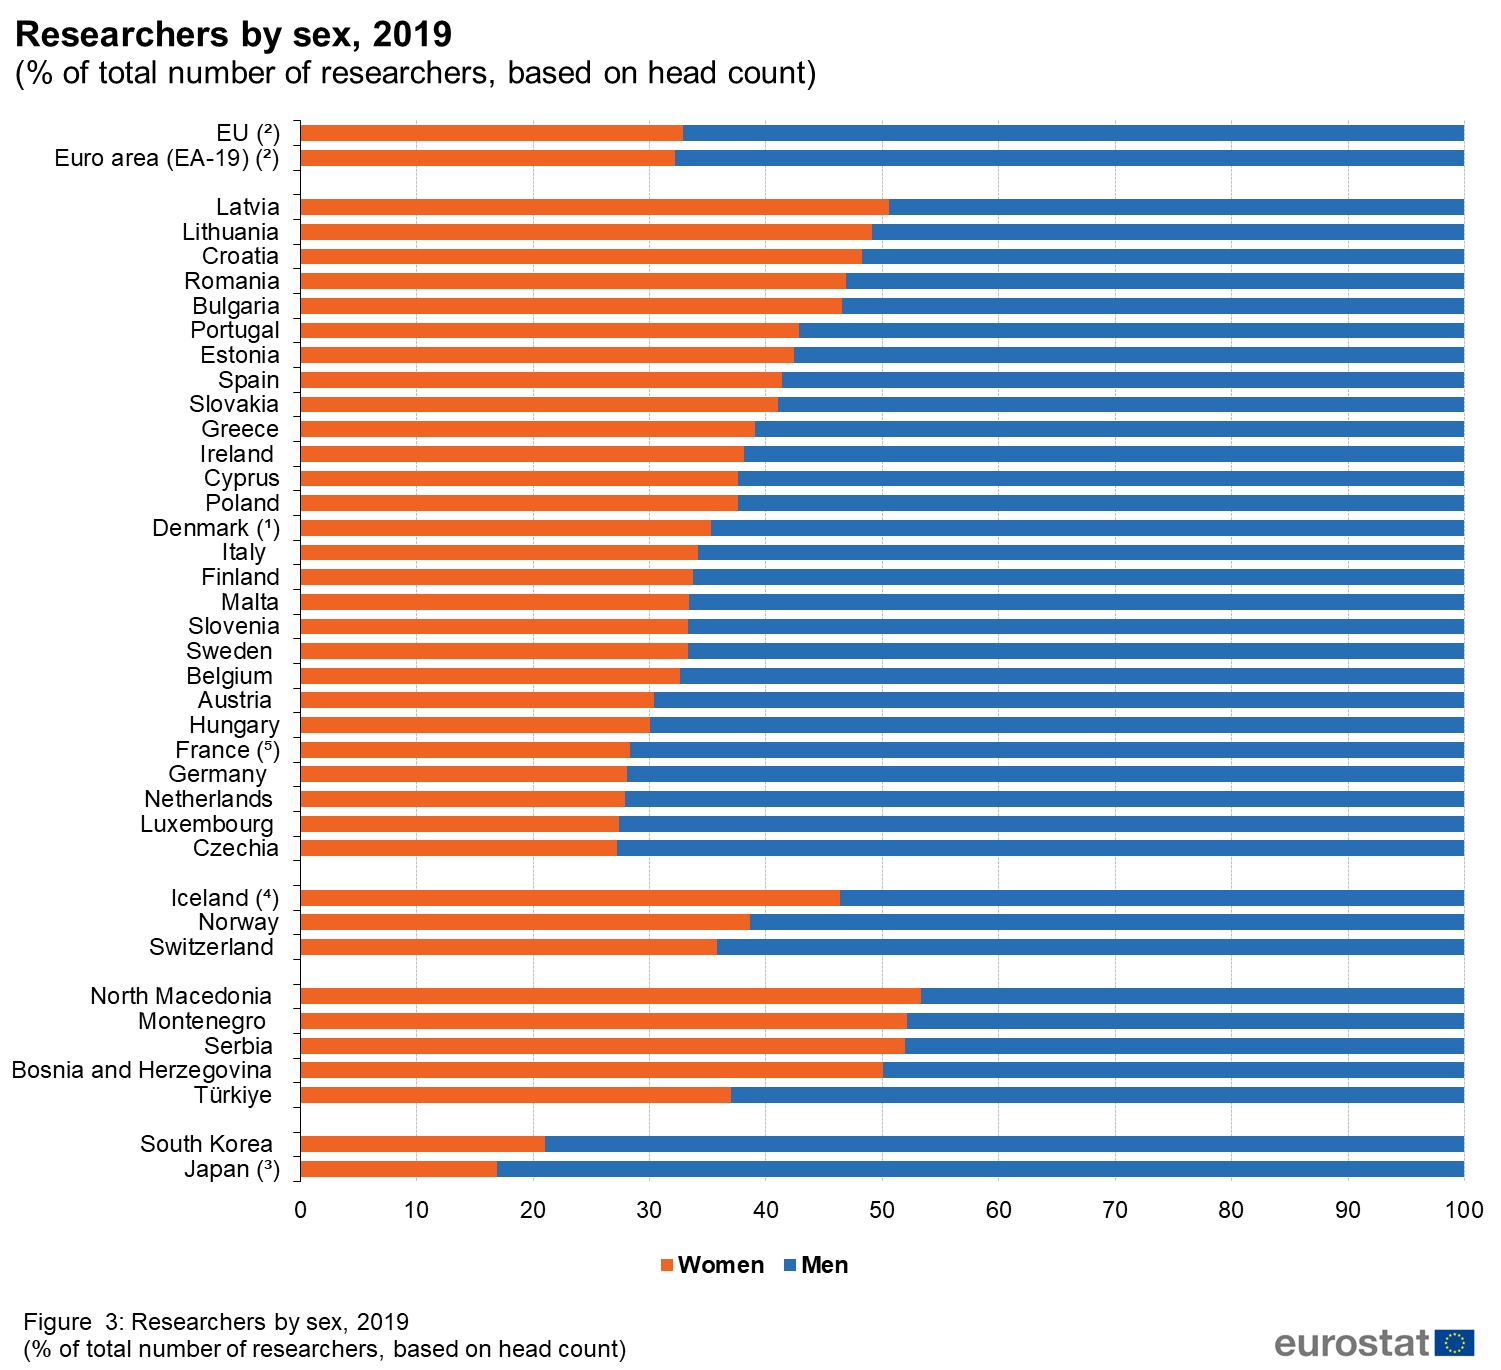
Researchers by sex, 2019 (% of total number of researchers, based on head count).png
(
file
)
122 KB
2
14:40, 5 December 2022
Excel 2021 Personnel V9.xlsx
(
file
)
175 KB
2
14:39, 5 December 2022
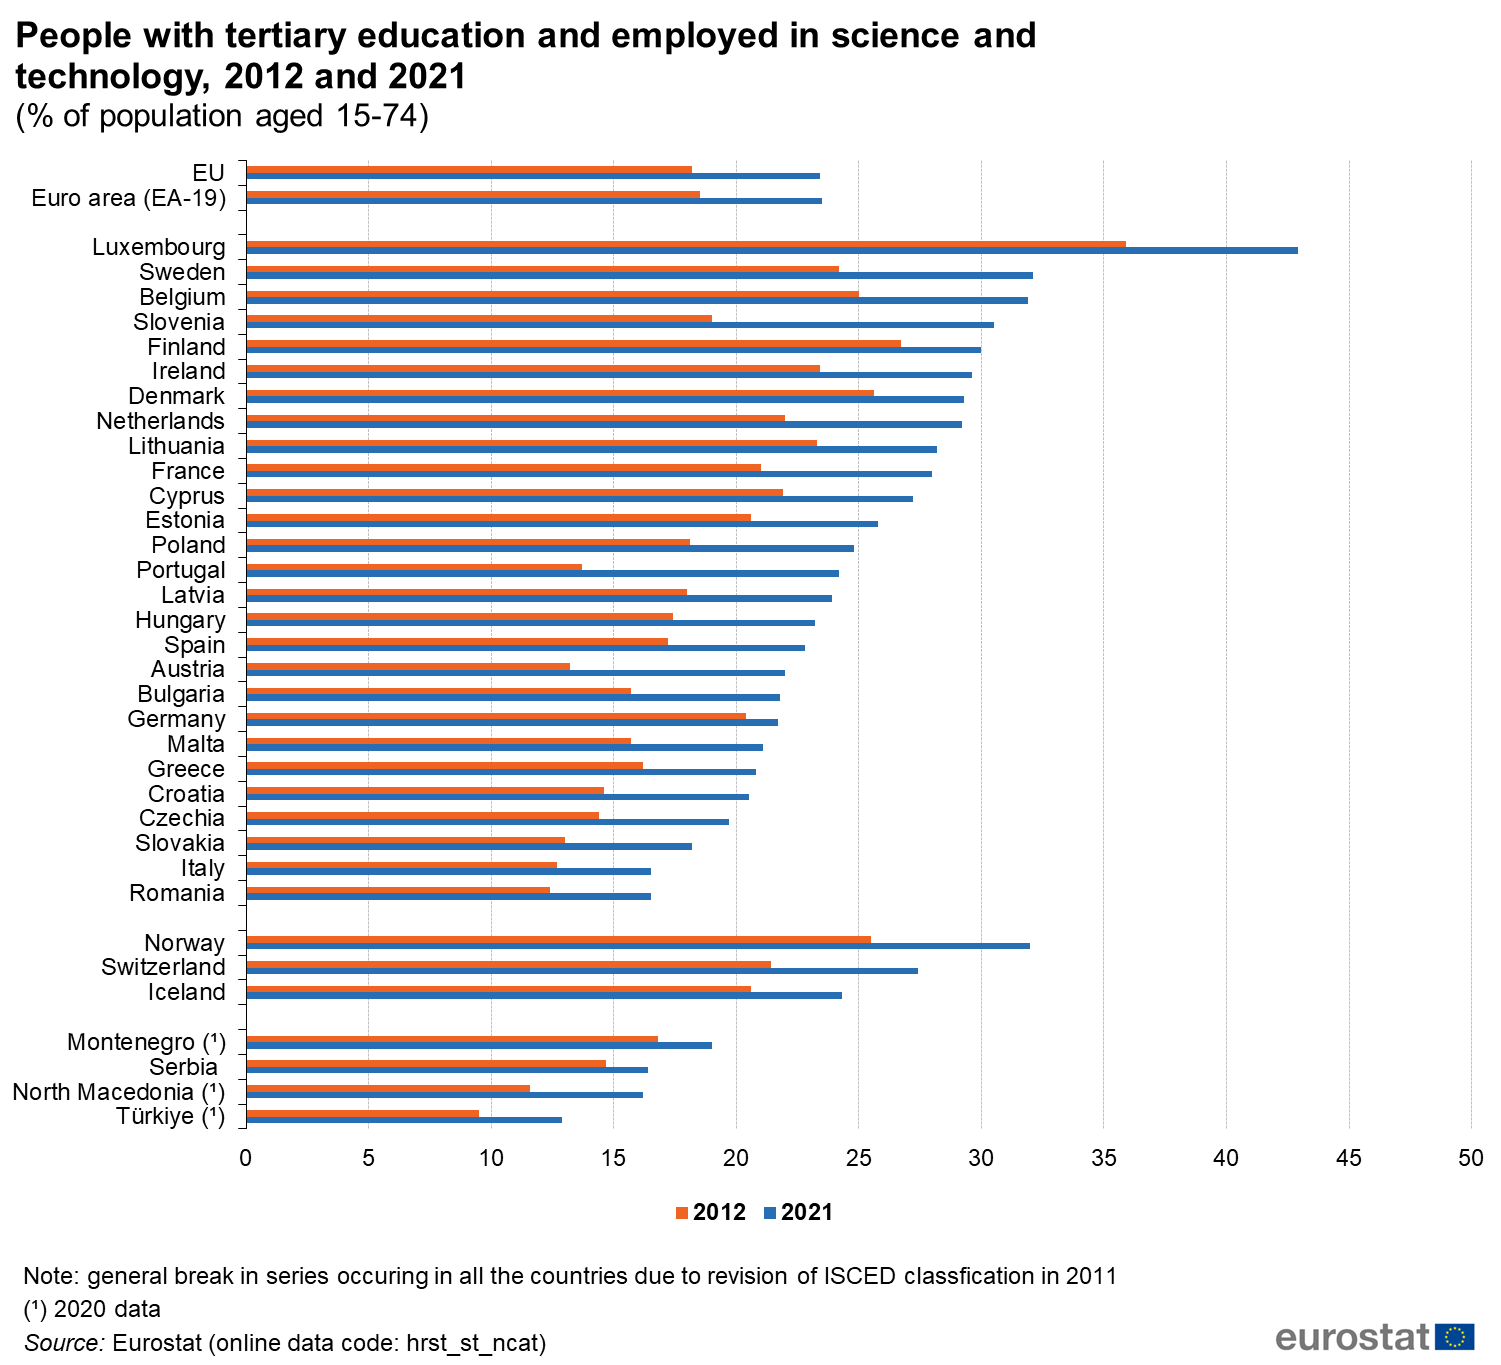
People with tertiary education and employed in science and technology, 2012 and 2021 (% of population aged 15-74).png
(
file
)
126 KB
2
14:38, 5 December 2022
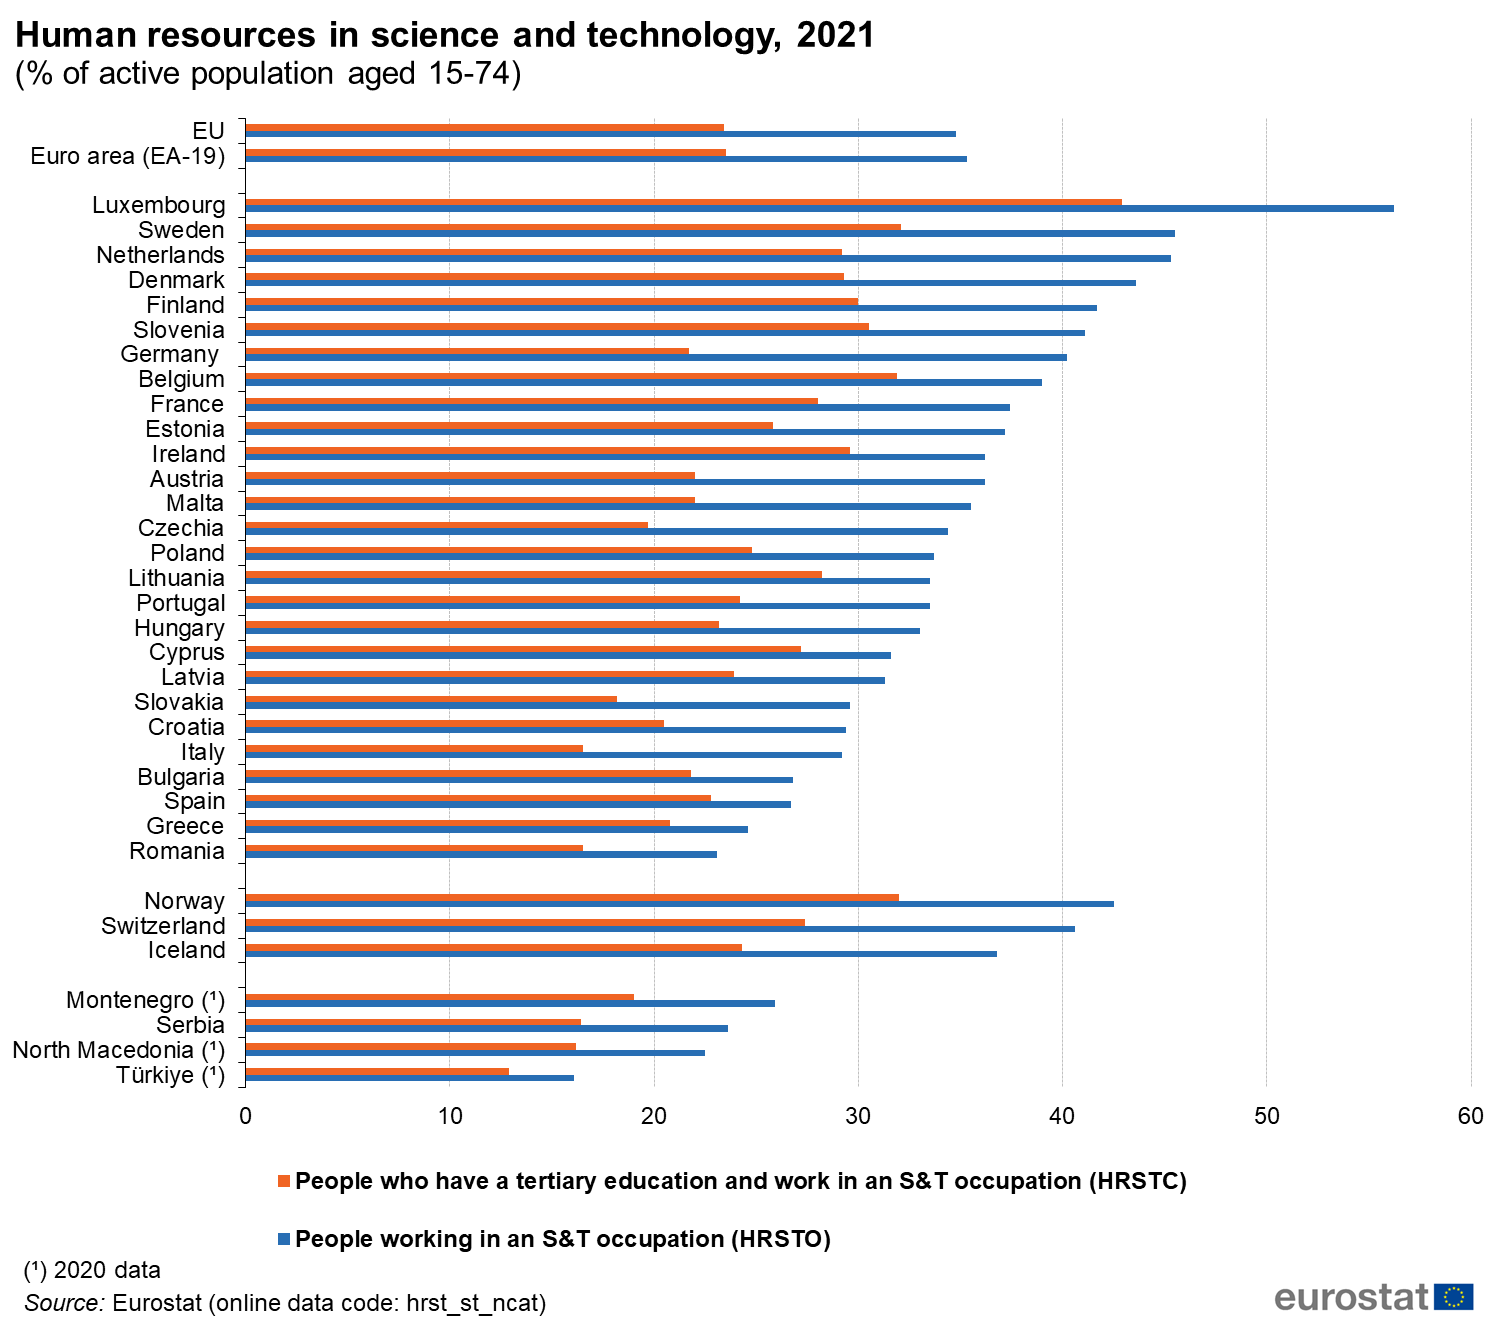
Human resources in science and technology, 2021 (% of active population aged 15-74).png
(
file
)
115 KB
3
13:44, 5 December 2022
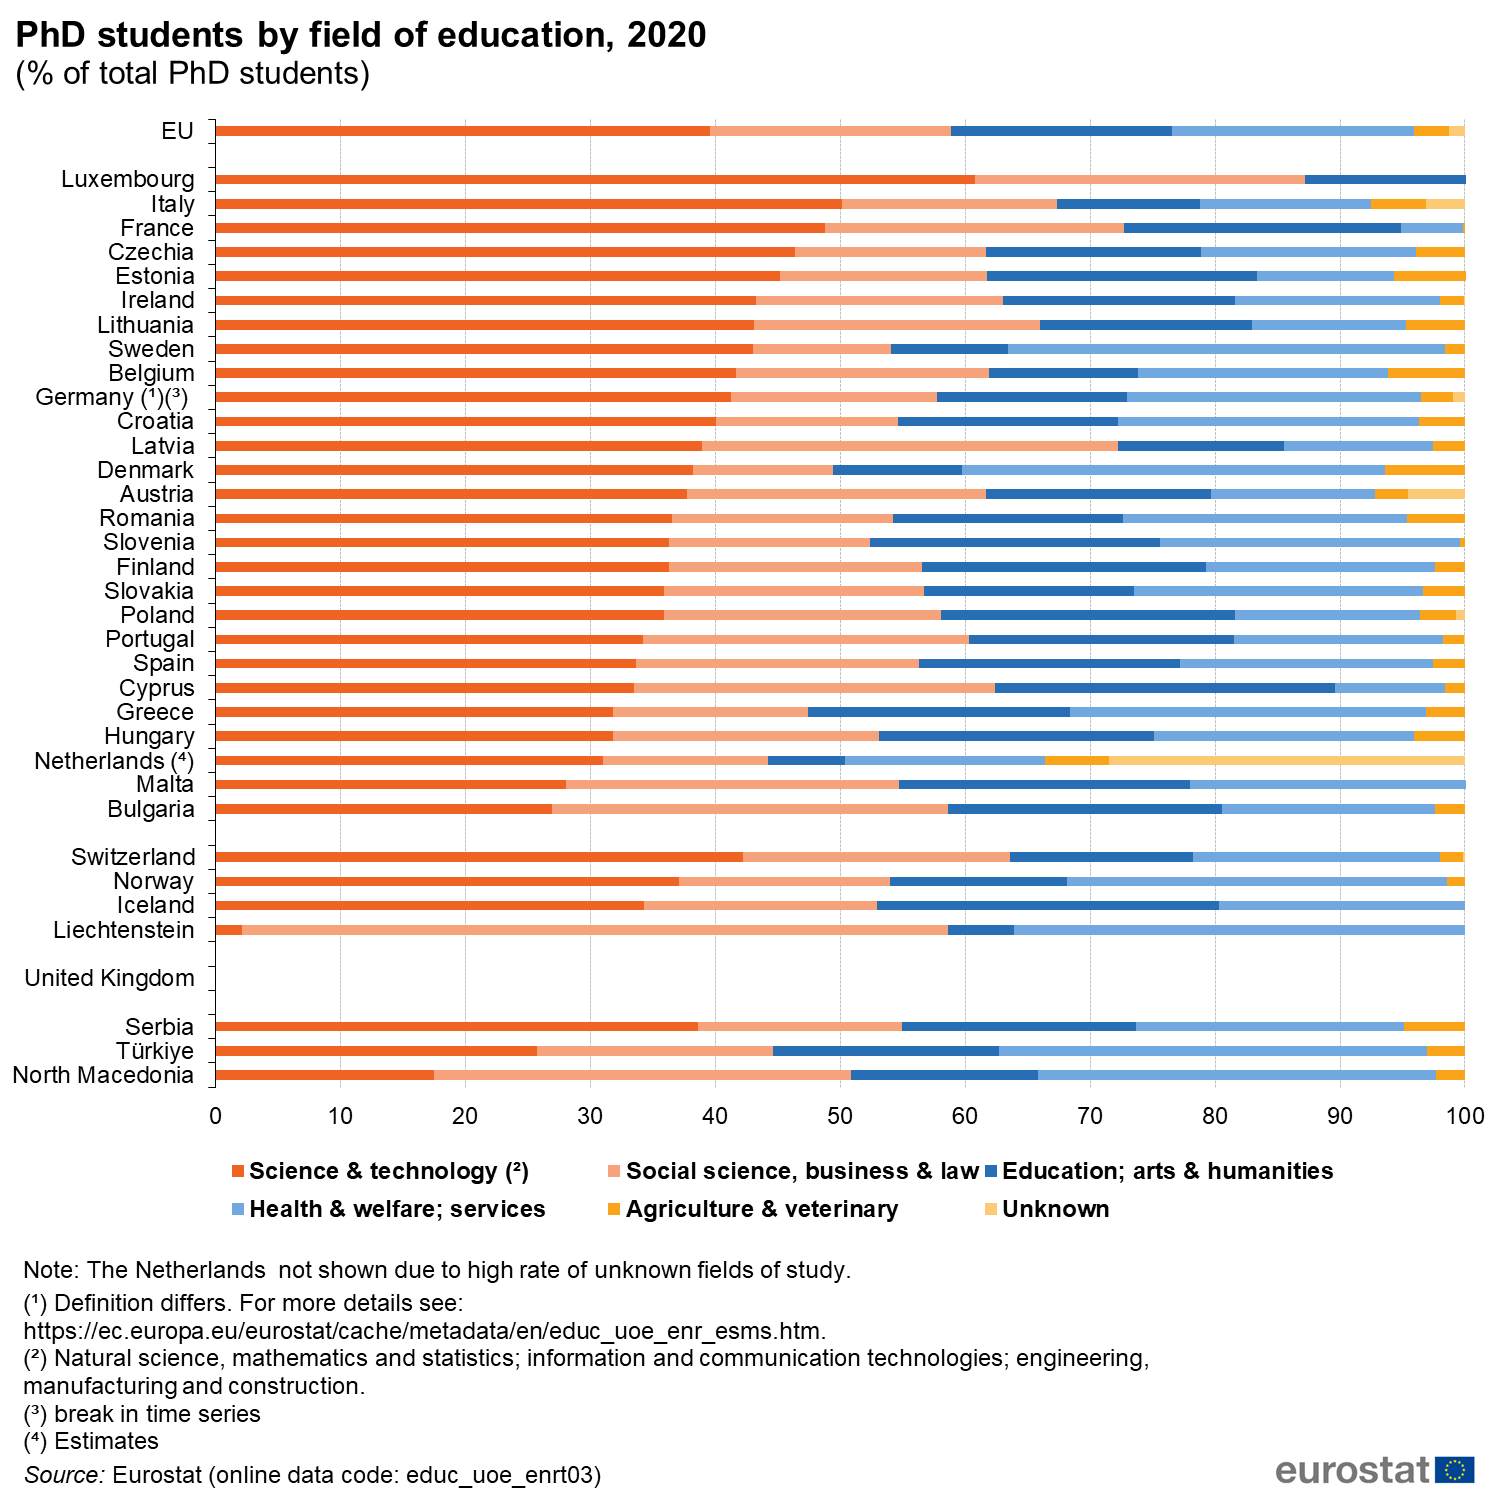
PhD students by field of education, 2020 (% of total PhD students).png
(
file
)
158 KB
1
13:42, 5 December 2022
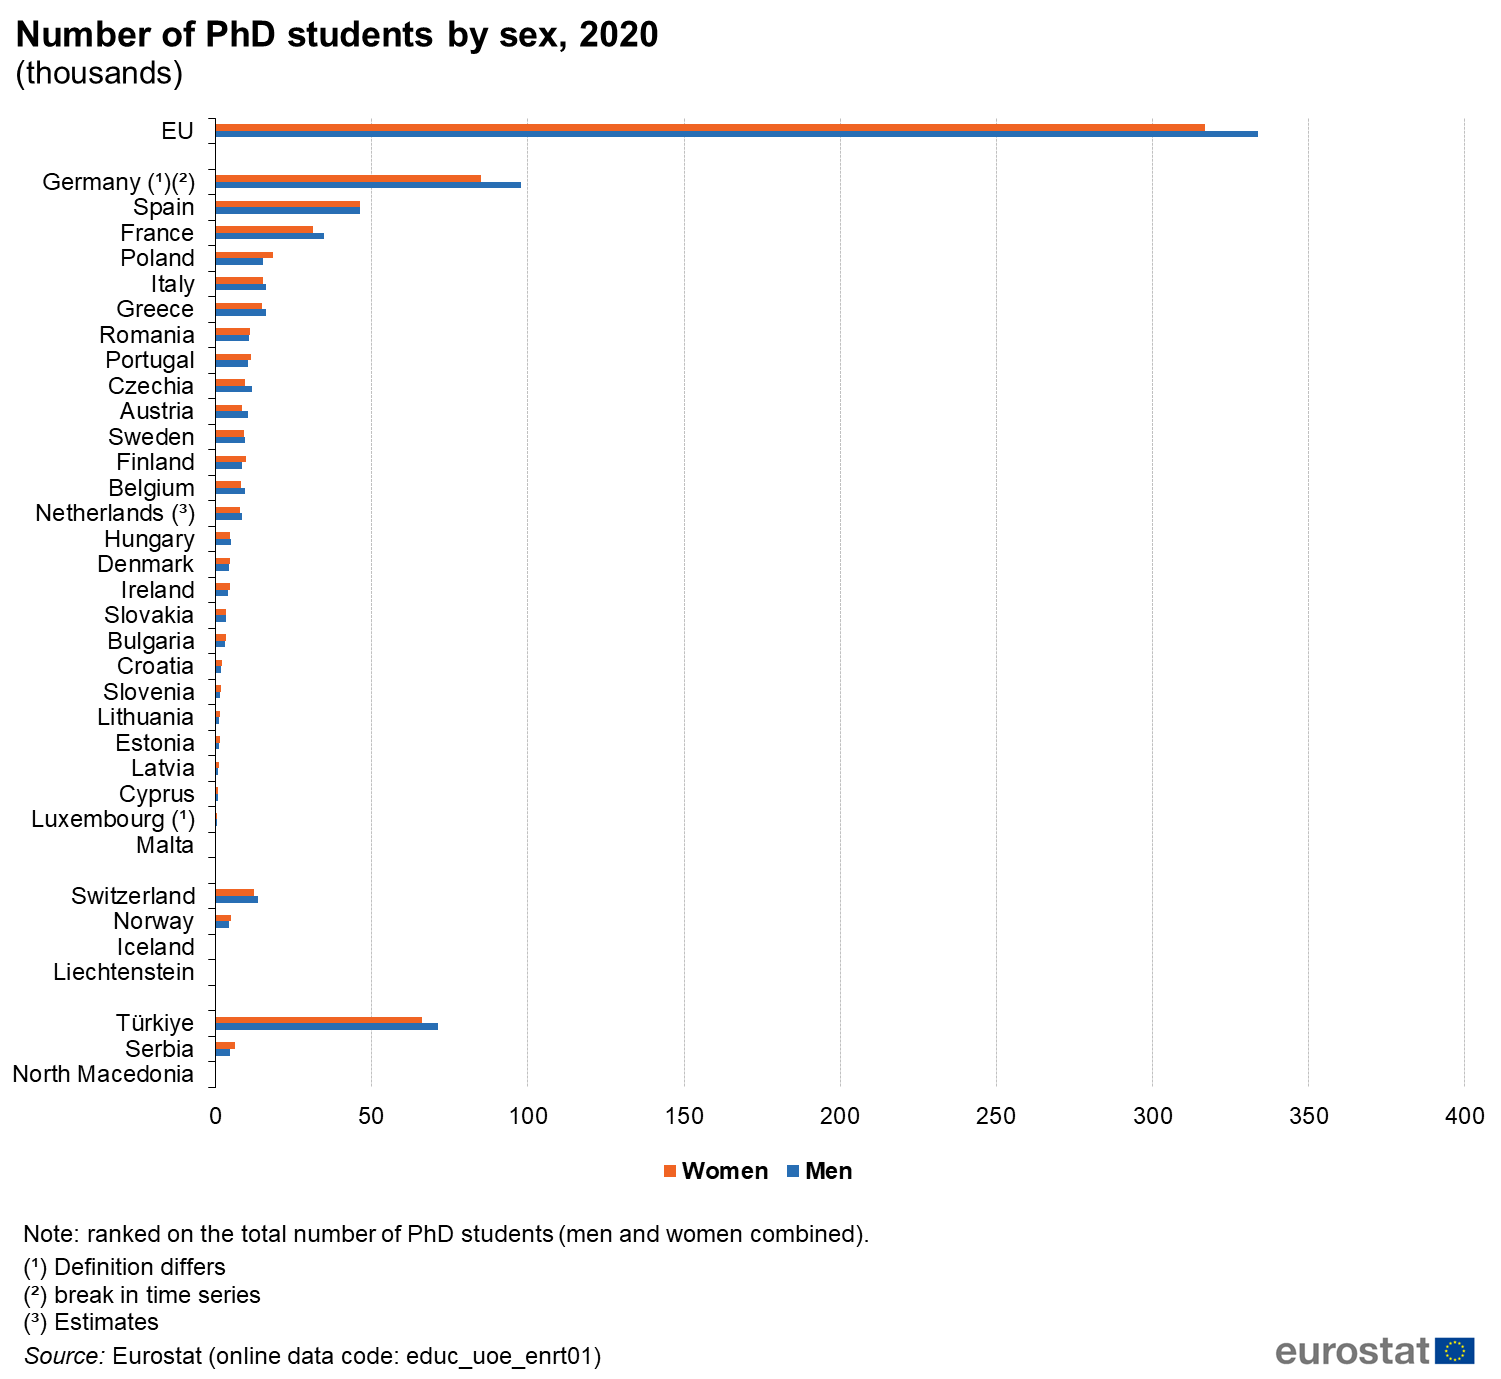
Number of PhD students by sex, 2020 (thousands).png
(
file
)
117 KB
1
13:34, 5 December 2022
Excel 2021 Personnel V8 .xlsx
(
file
)
175 KB
1
13:30, 5 December 2022
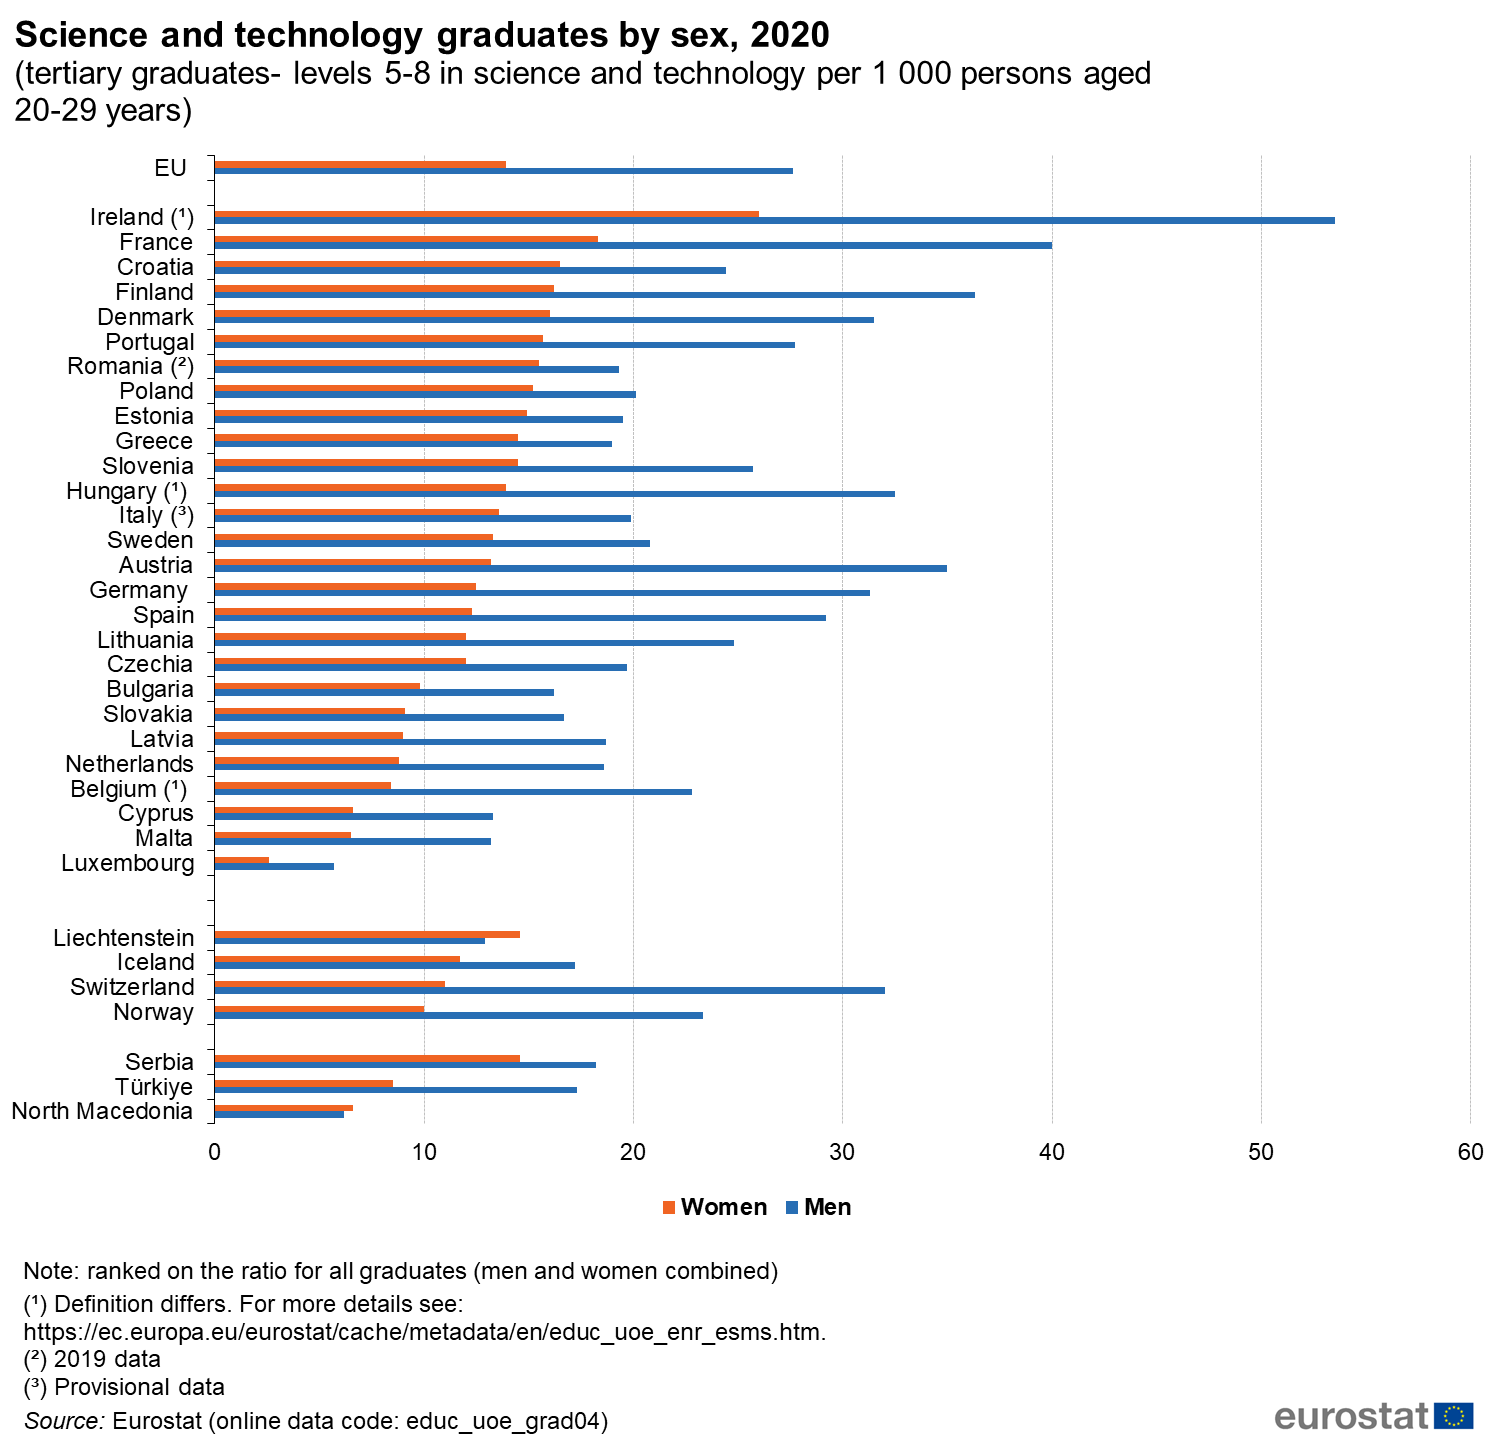
Science and technology graduates by sex, 2020 (tertiary graduates- levels 5-8 in science and technology per 1 000 persons aged 20-29 years).png
(
file
)
131 KB
1
13:28, 5 December 2022
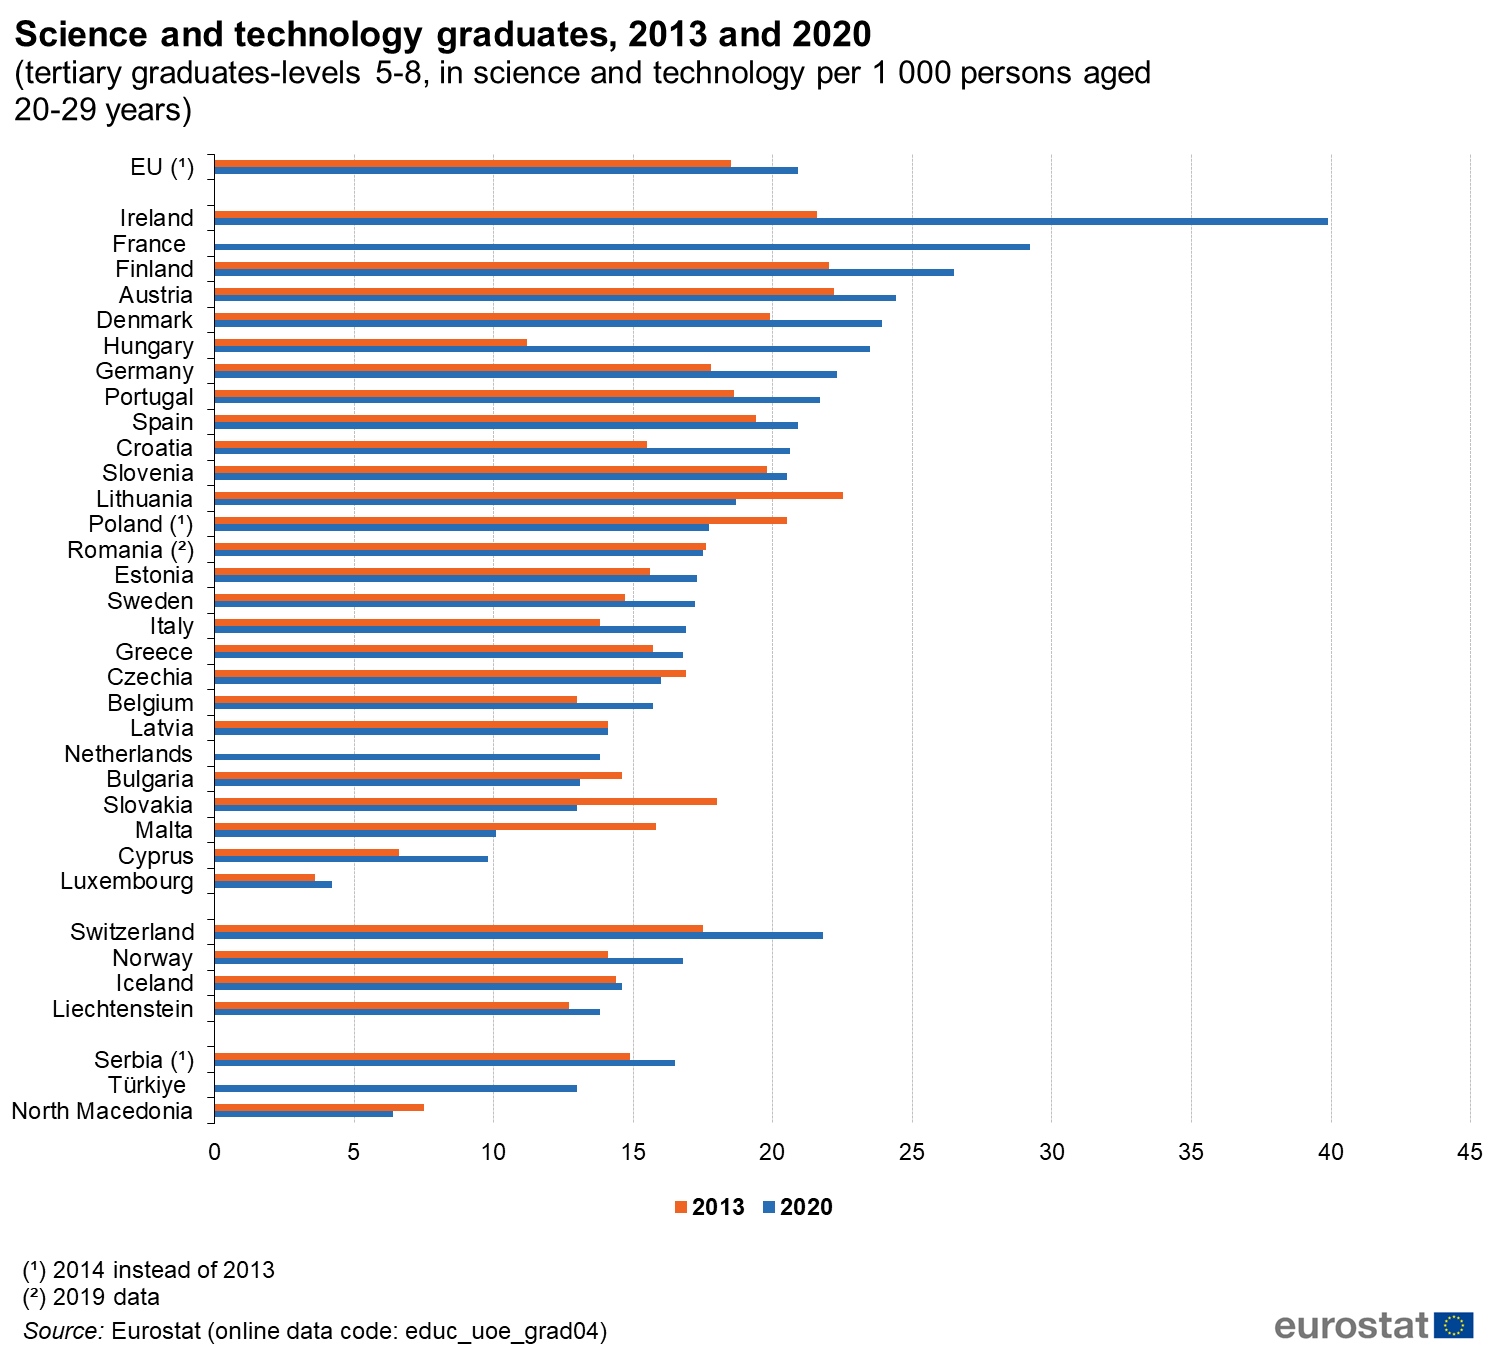
Science and technology graduates, 2013 and 2020 (tertiary graduates-levels 5-8, in science and technology per 1 000 persons aged 20-29 years).png
(
file
)
122 KB
1
13:23, 5 December 2022
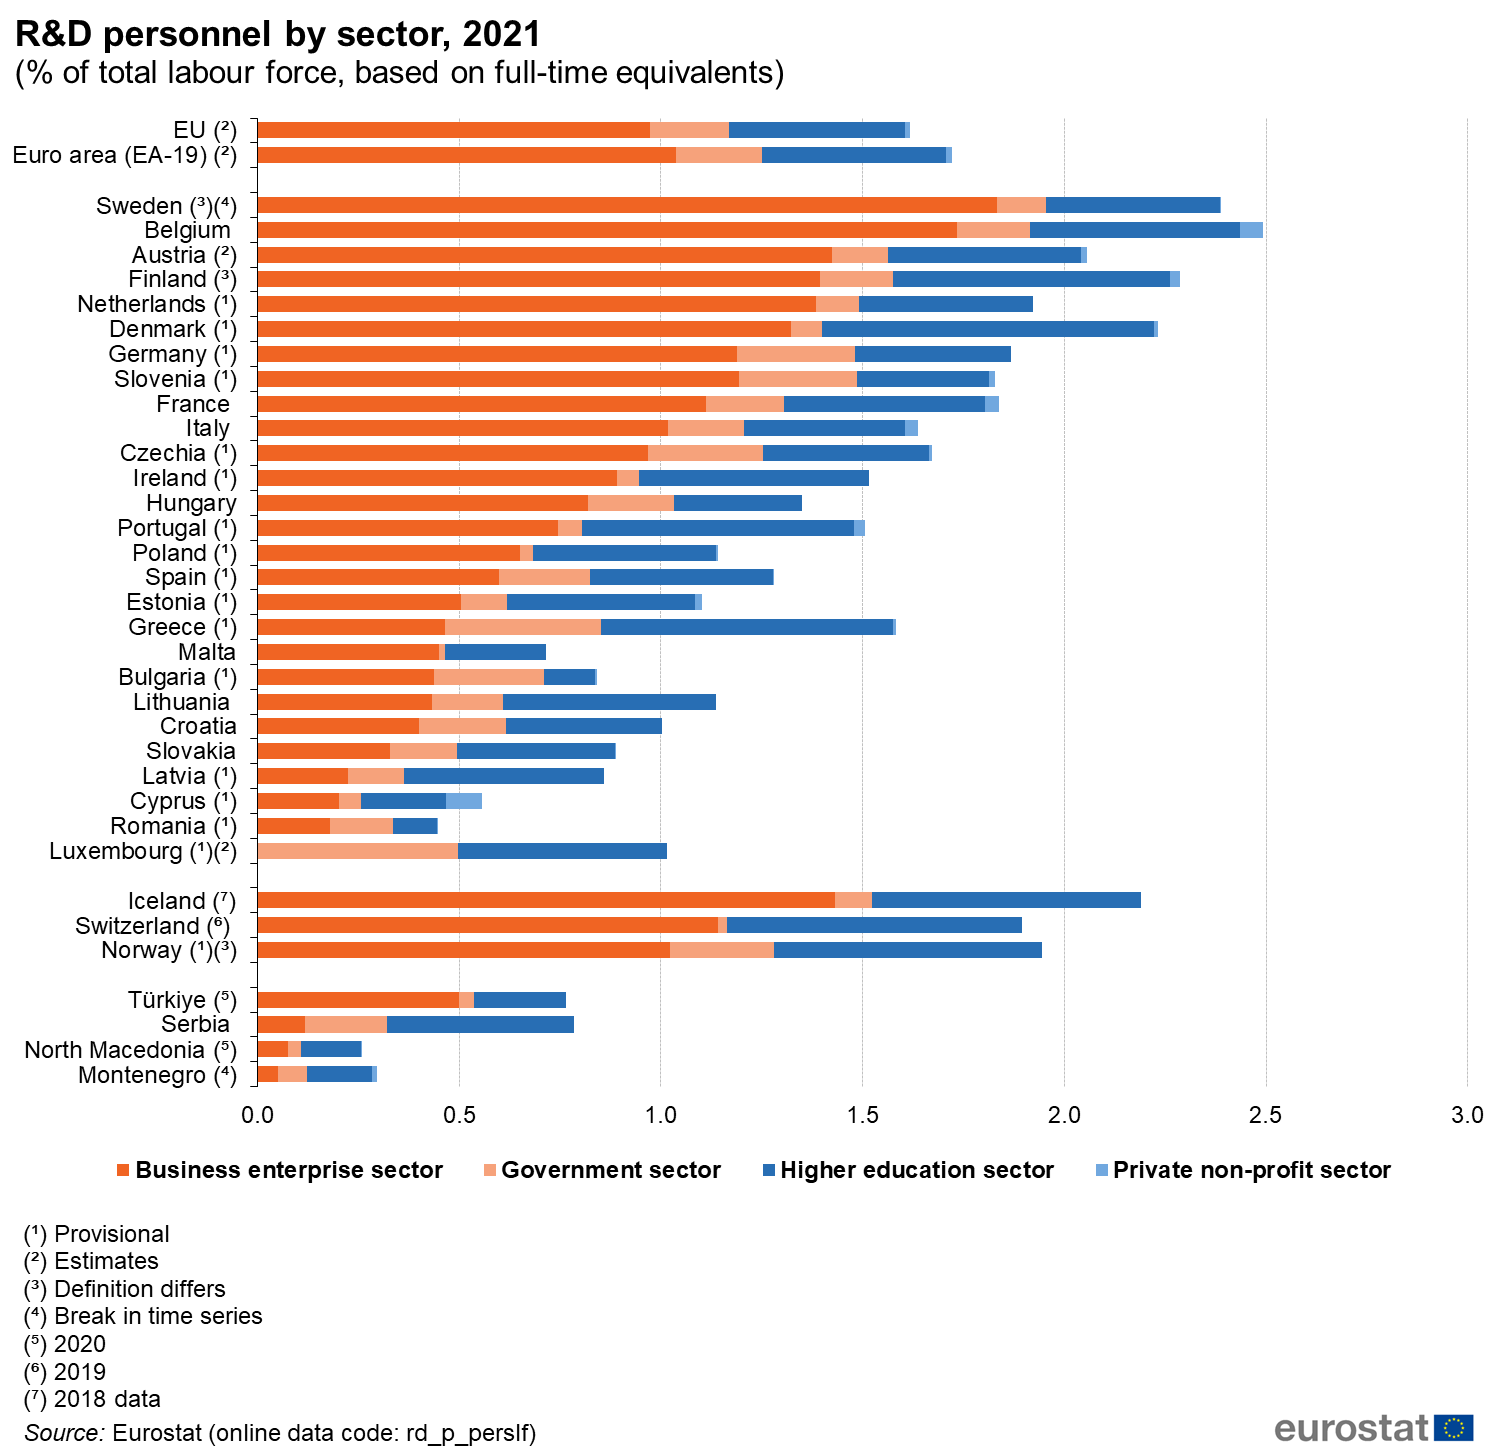
R&D personnel by sector, 2021 (% of total labour force, based on full-time equivalents).png
(
file
)
140 KB
1
13:49, 17 September 2020
SE HRST 2020 final.xlsx
(
file
)
69 KB
1
19:25, 16 September 2020
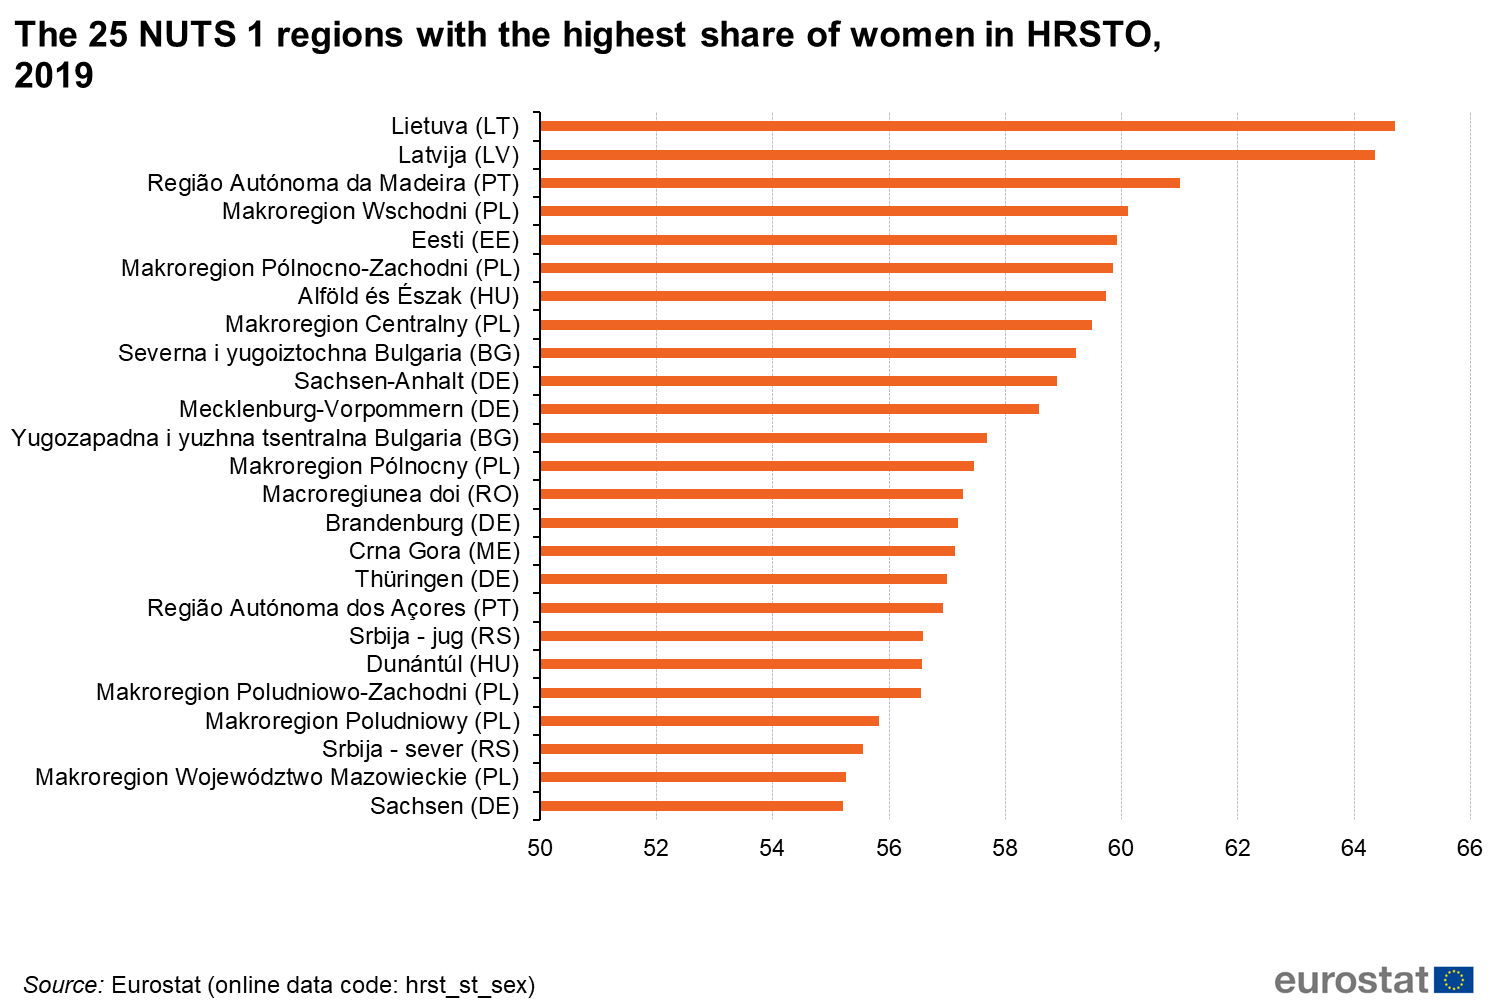
The 25 NUTS 1 regions with the highest share of women in HRSTO, 2019 (%).png
(
file
)
118 KB
1
19:23, 16 September 2020
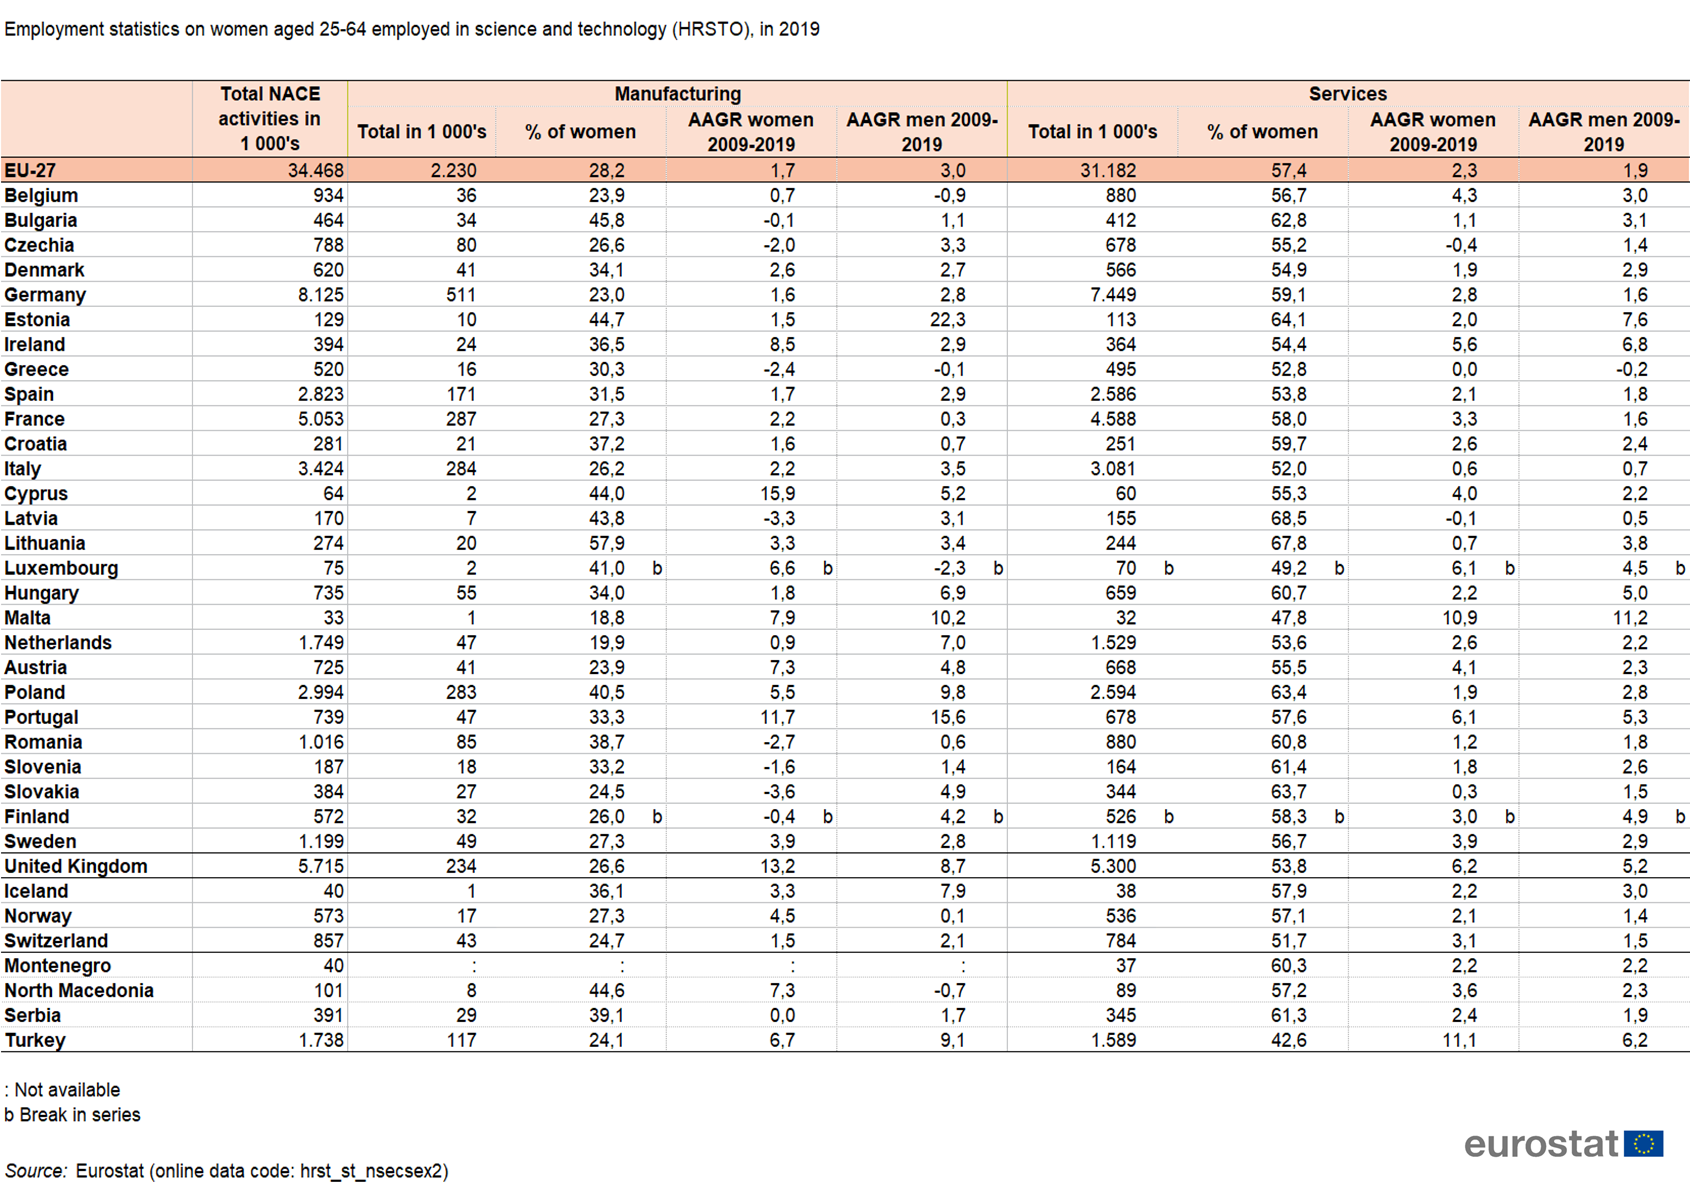
Employment statistics on women aged 25-64, in 2019.png
(
file
)
643 KB
1
19:18, 16 September 2020
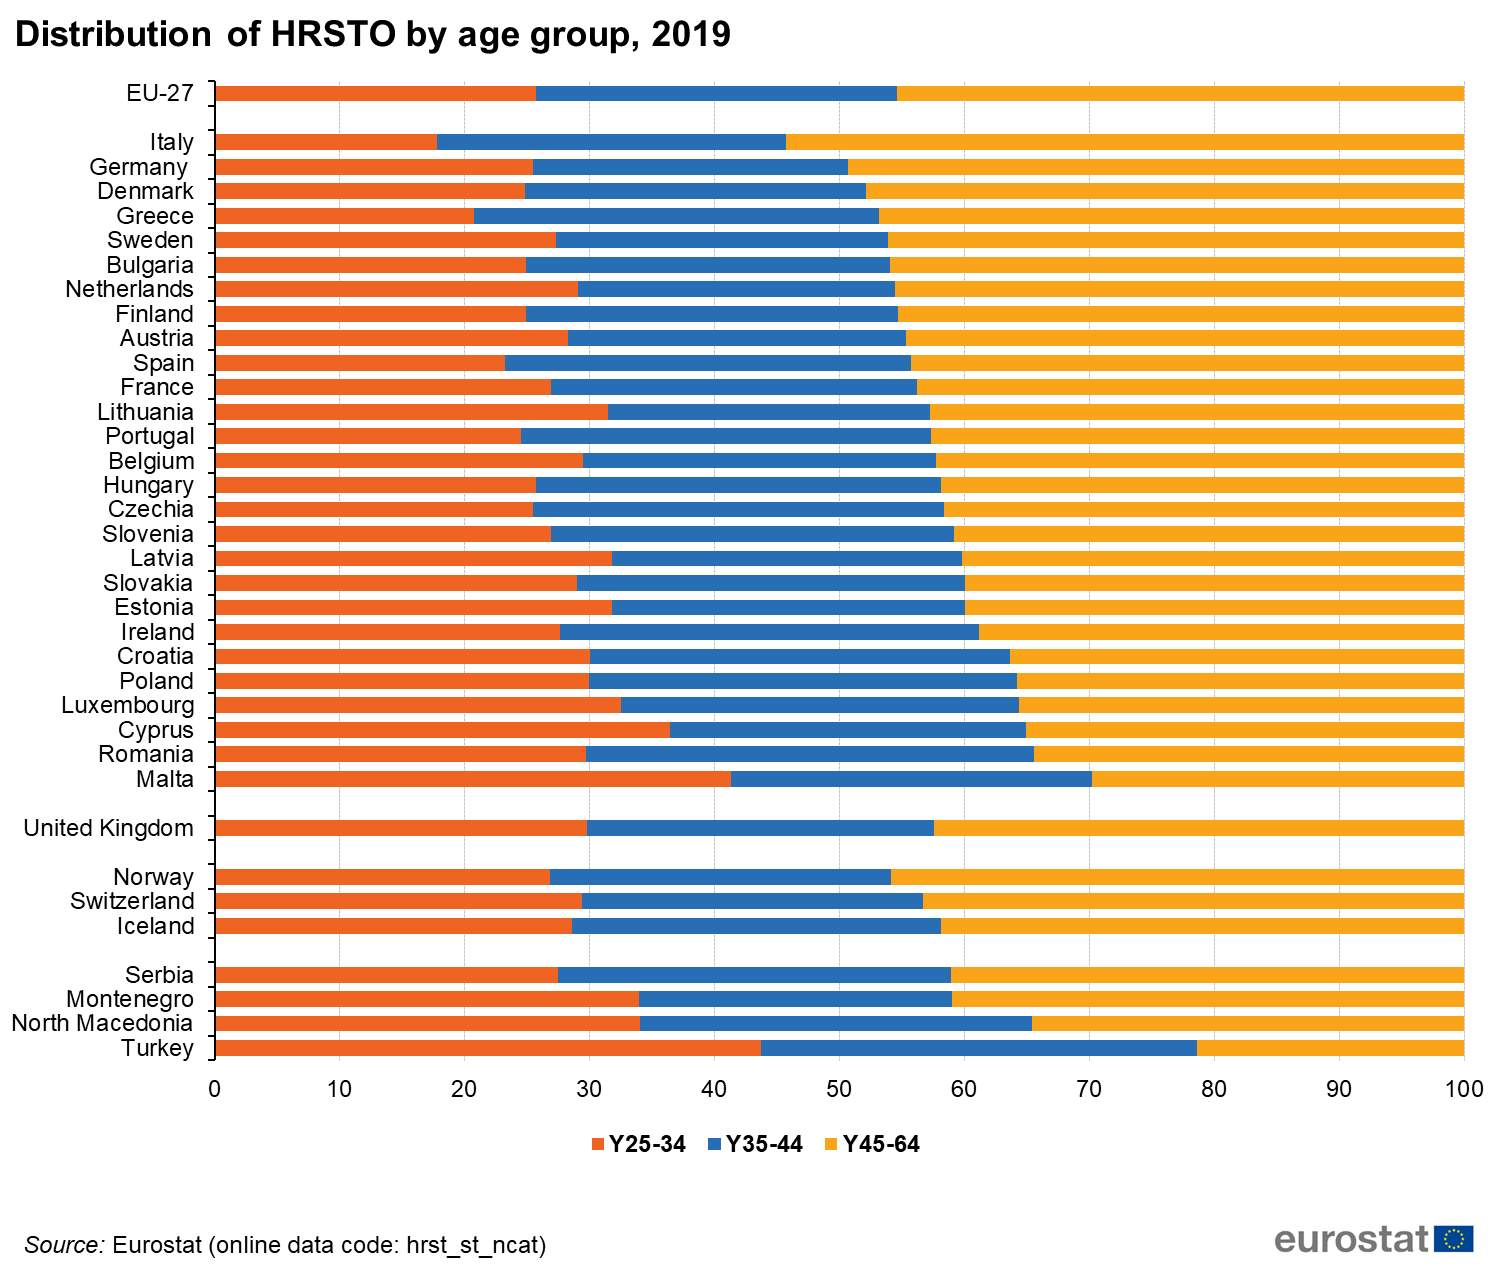
Distribution of HRST by age group, 2019 (%).png
(
file
)
107 KB
1
19:06, 16 September 2020
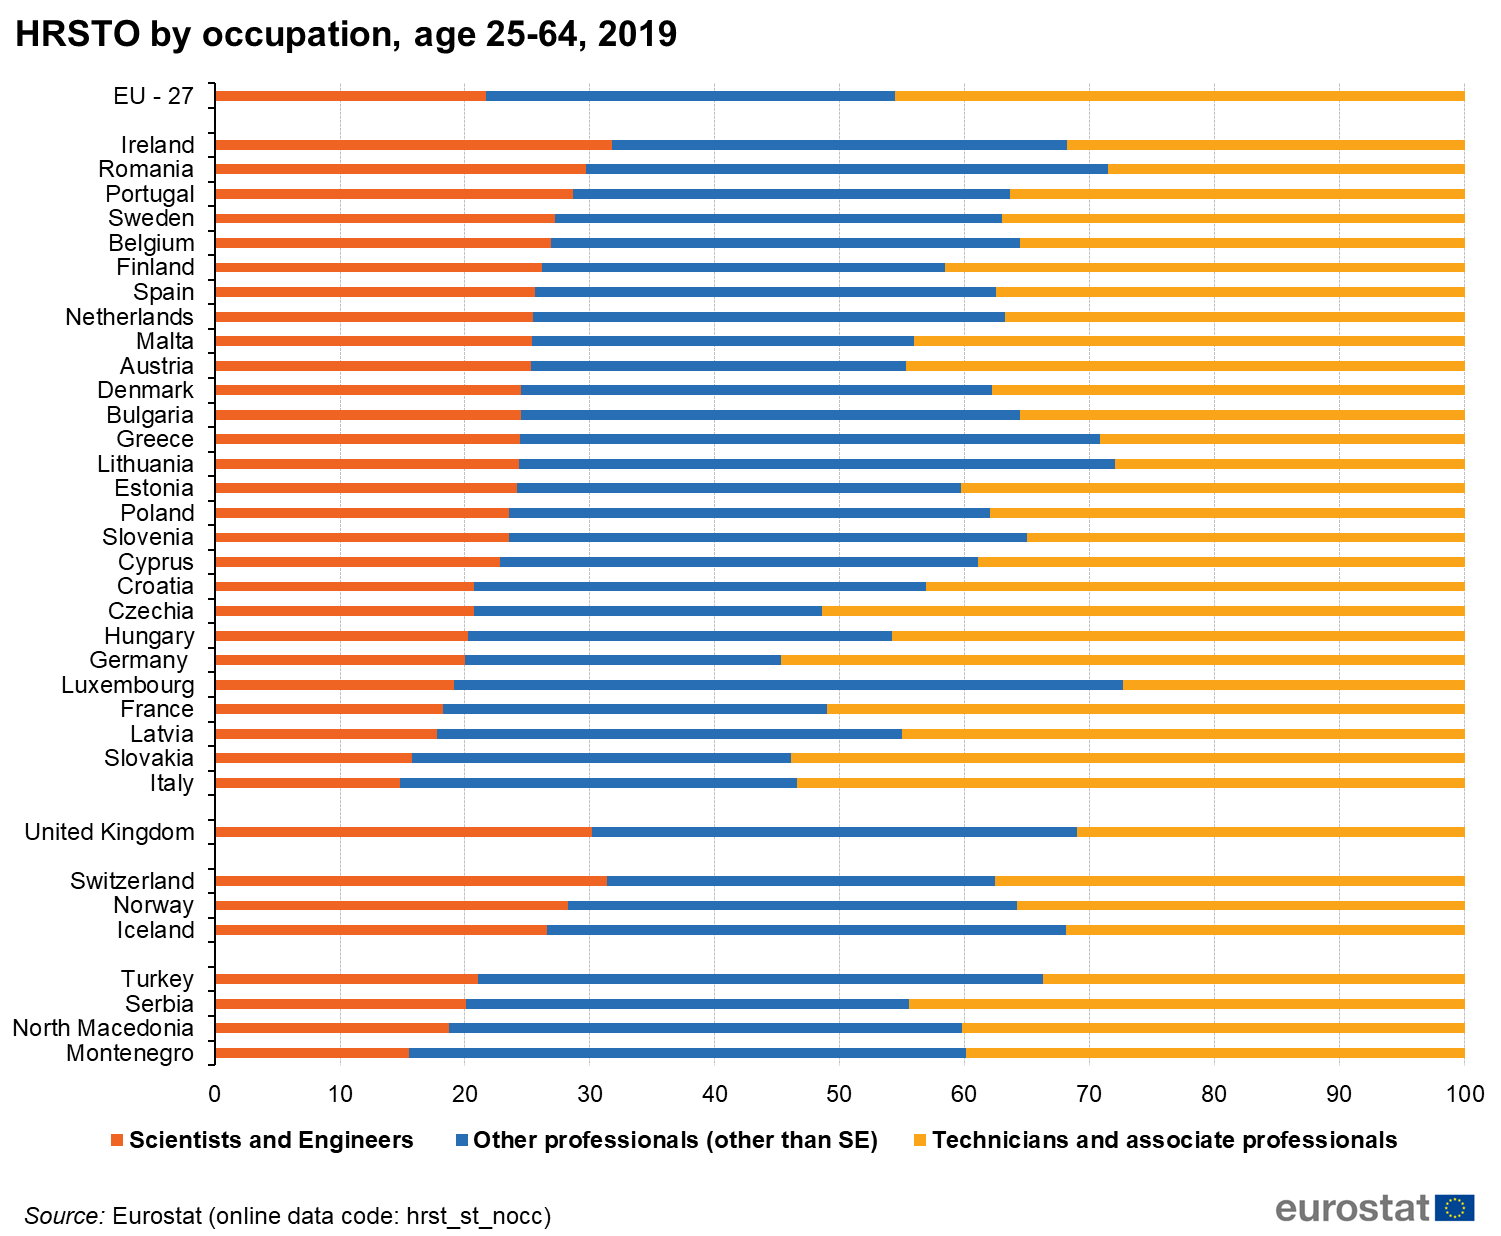
HRSTO by occupation, age 25-64, 2019 (%).png
(
file
)
114 KB
1
Special page
ISSN 2443-8219
.png)
.png)
.png)
.png)
.png)
.png)
.png)
.png)
.png)

.png)
.png)