Tutorials
Log in
Statistics Explained
menu
search
search
Navigation
Main page
Statistical themes
Glossary
Categories
Statistics 4 beginners
Tutorials
Help
Eurostat home
Education corner
Online publications
Regional yearbook
Sustainable development
Full list
Tools
User contributions
Logs
View user groups
Special pages
search
Navigation
Main page
Statistical themes
Glossary
Categories
Statistics 4 beginners
Tutorials
Help
Eurostat home
Education corner
Online publications
Regional yearbook
Sustainable development
Full list
Tools
User contributions
Logs
View user groups
Special pages
Navigation
Main page
Statistical themes
Glossary
Categories
Statistics 4 beginners
Tutorials
Help
Eurostat home
Education corner
Online publications
Regional yearbook
Sustainable development
Full list
Tools
User contributions
Logs
View user groups
Special pages
Uploads by Papageo
This special page shows all uploaded files.
File list
Items per page:
20
50
100
250
500
Search for media name:
Username:
Include old versions of files
Go
First page
Previous page
Next page
Last page
Date
Name
Thumbnail
Size
Description
Versions
15:22, 27 May 2024
Share of modes in services imports from the rest of the world, by country, 2021.png
(
file
)
63 KB
1
14:06, 27 May 2024
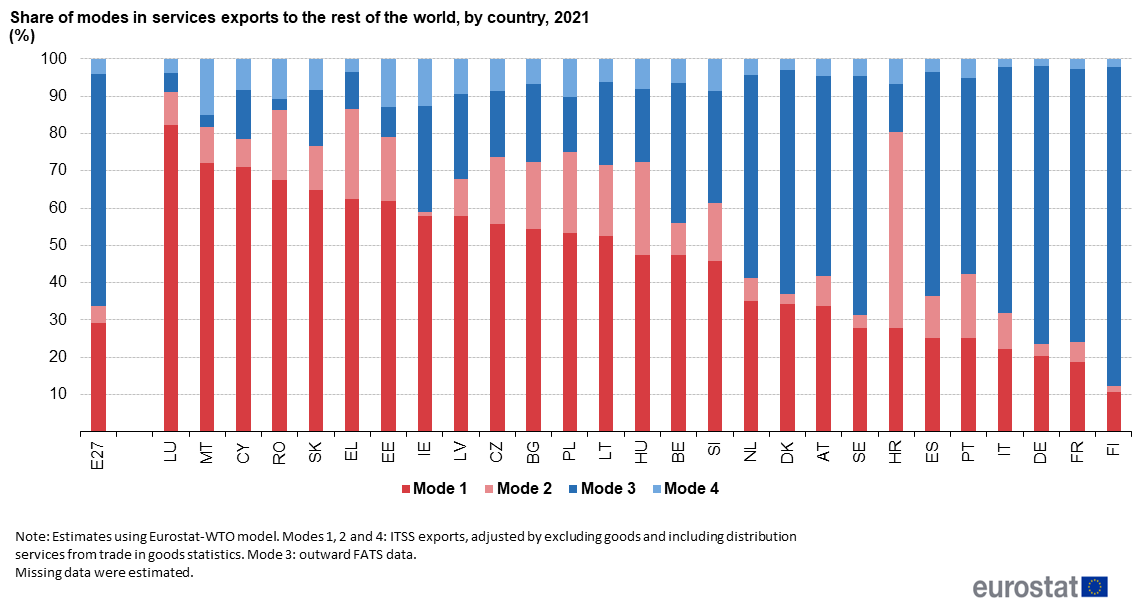
Share of modes in services exports to the rest of the world, by country, 2021.png
(
file
)
61 KB
1
13:59, 27 May 2024
EU imports of services from non-member countries by service item, share of modes of supply, 2021.png
(
file
)
46 KB
1
13:57, 27 May 2024
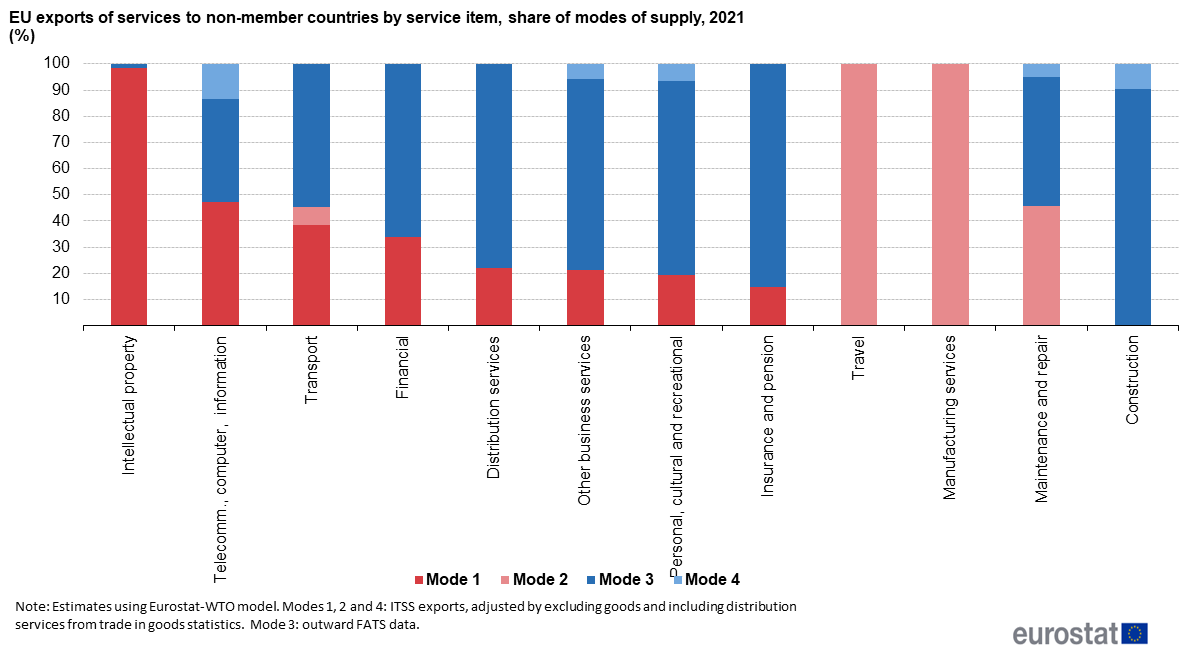
EU exports of services to non-member countries by service item, share of modes of supply, 2021.png
(
file
)
45 KB
1
13:55, 27 May 2024
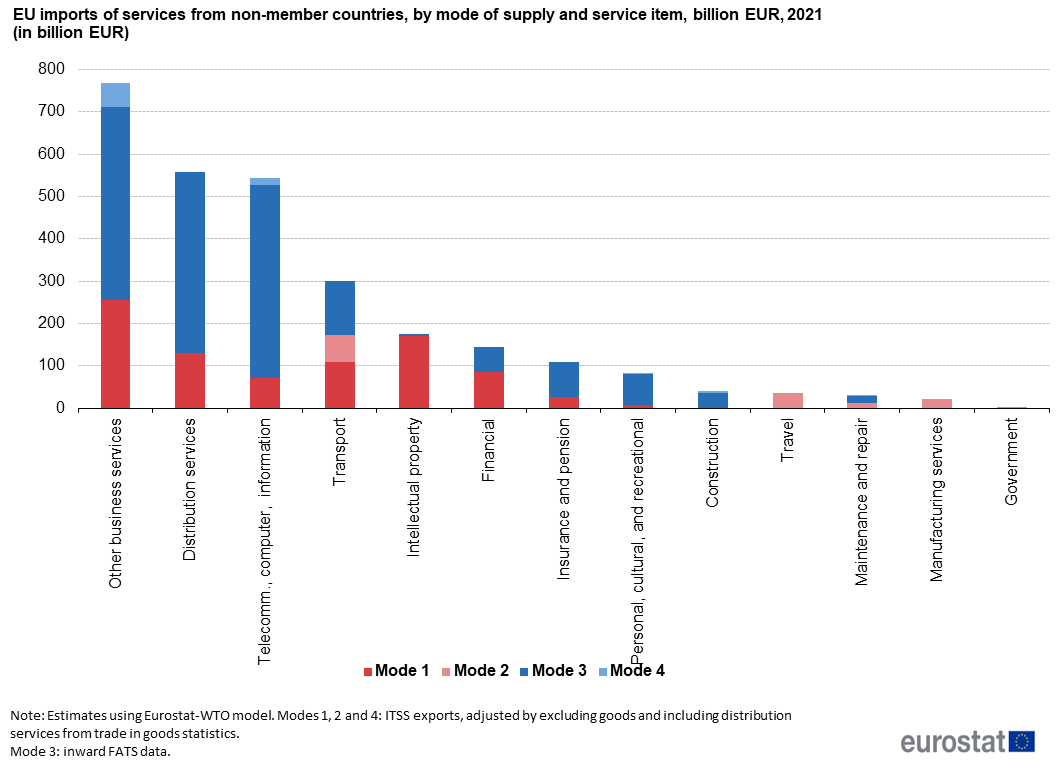
EU imports of services from non-member countries, by mode of supply and service item, 2021.png
(
file
)
38 KB
1
13:51, 27 May 2024
EU exports of services to non-member countries, by mode of supply and service item, 2021.png
(
file
)
35 KB
1
13:47, 27 May 2024
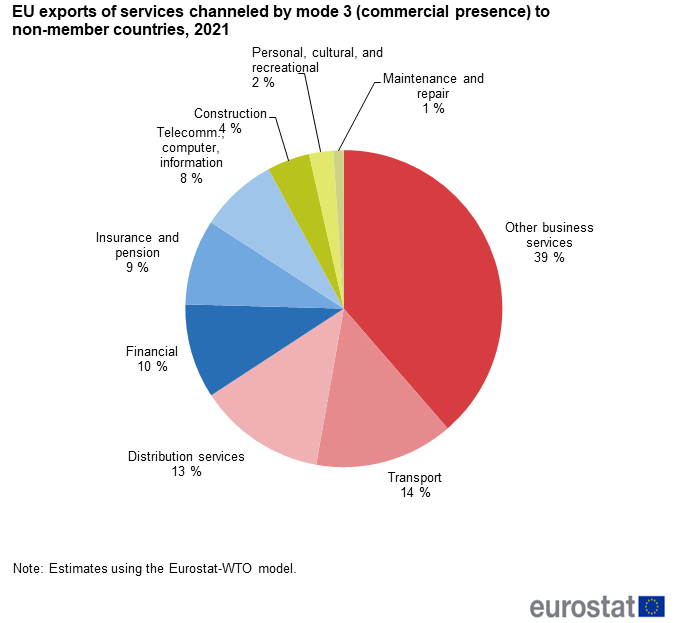
EU exports of services channeled by mode 3 (commercial presence) to non-member countries, 2021.png
(
file
)
32 KB
1
13:45, 27 May 2024
EU exports of services channeled by mode 1 (cross-border supply) to non-member countries, 2021.png
(
file
)
31 KB
1
10:15, 27 May 2024
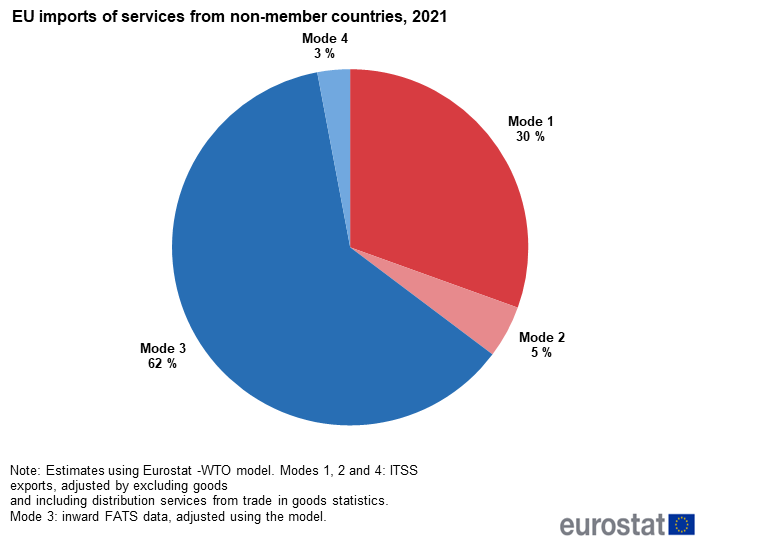
EU imports of services from non-member countries, 2021.png
(
file
)
26 KB
1
10:06, 27 May 2024
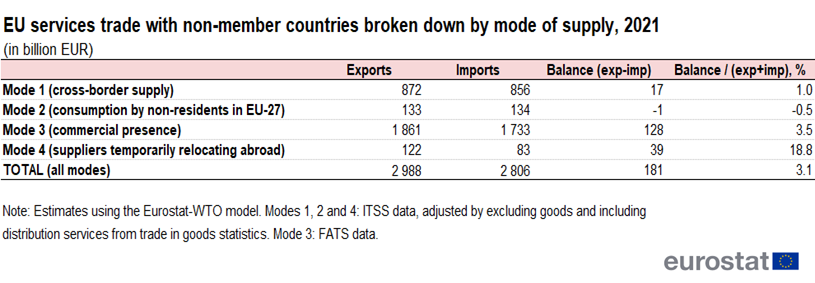
EU services trade with non-member countries broken down by mode of supply, 2021.png
(
file
)
114 KB
1
21:48, 26 May 2024
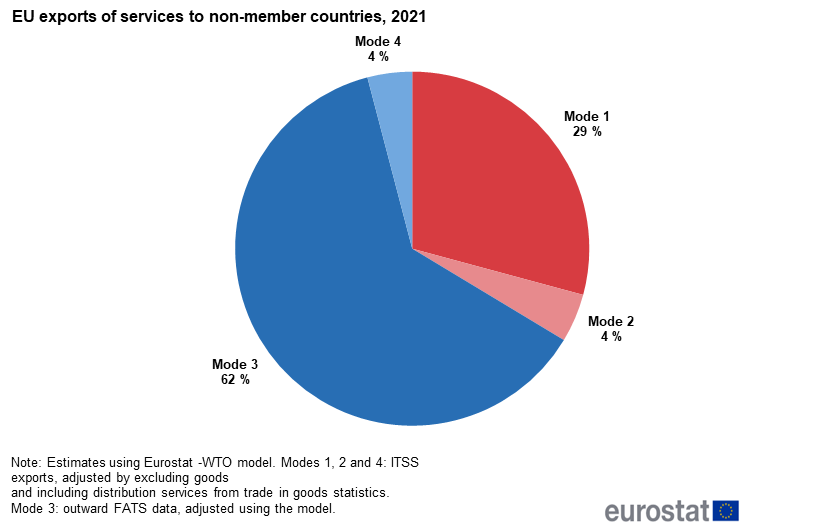
EU exports of services to non-member countries, 2021.png
(
file
)
27 KB
1
21:47, 26 May 2024
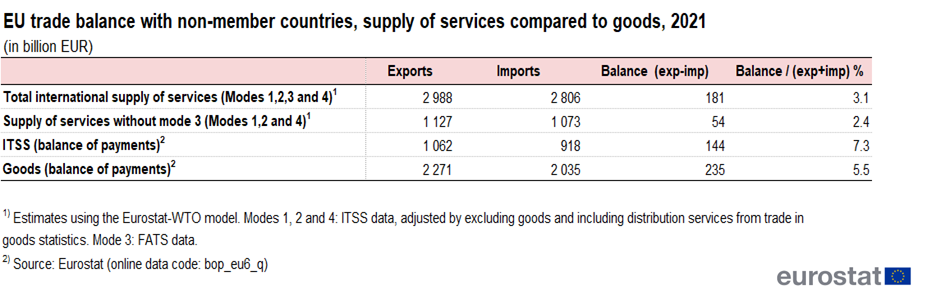
EU trade balance with non-member countries, supply of services compared to goods, 2021 (in billion EUR).png
(
file
)
119 KB
1
18:19, 23 February 2024
Business services 2021.xlsx
(
file
)
27 KB
1
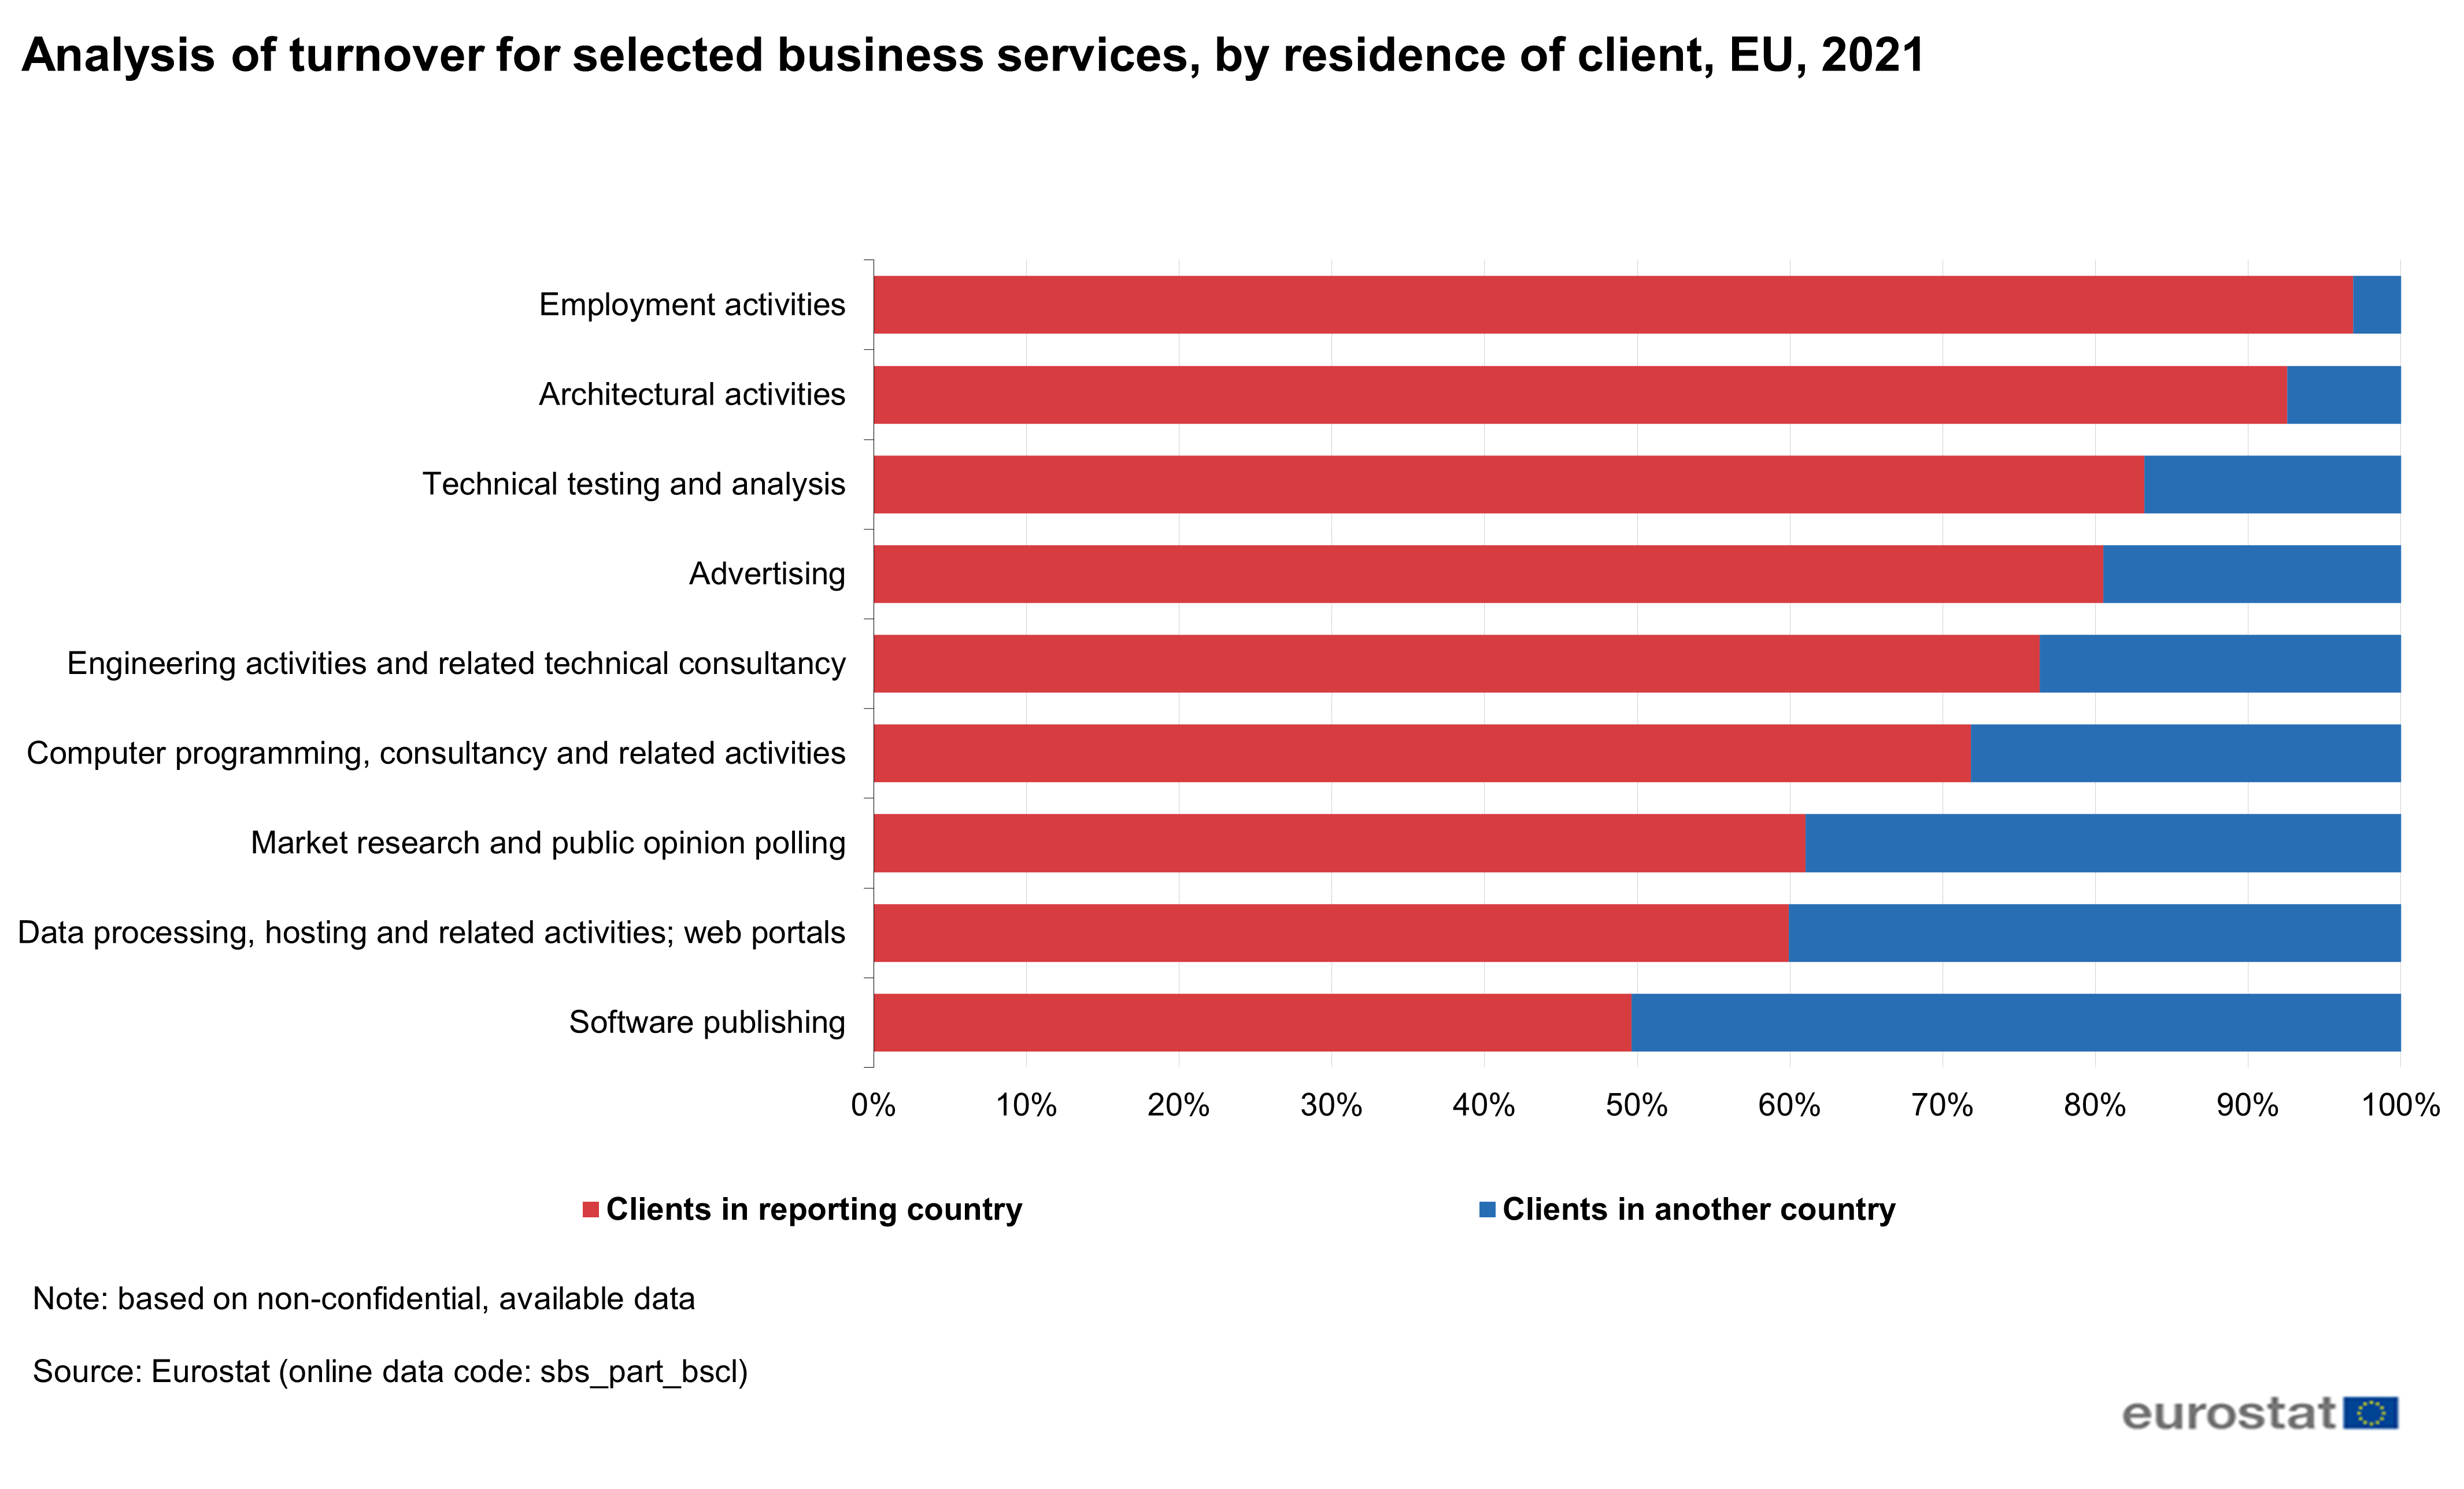
18:04, 23 February 2024
Analysis of turnover 2021.png
(
file
)
264 KB
1
12:57, 29 June 2023
EU intermediate and final services, partner Extra-EU, Imports (%)-2023.png
(
file
)
54 KB
1
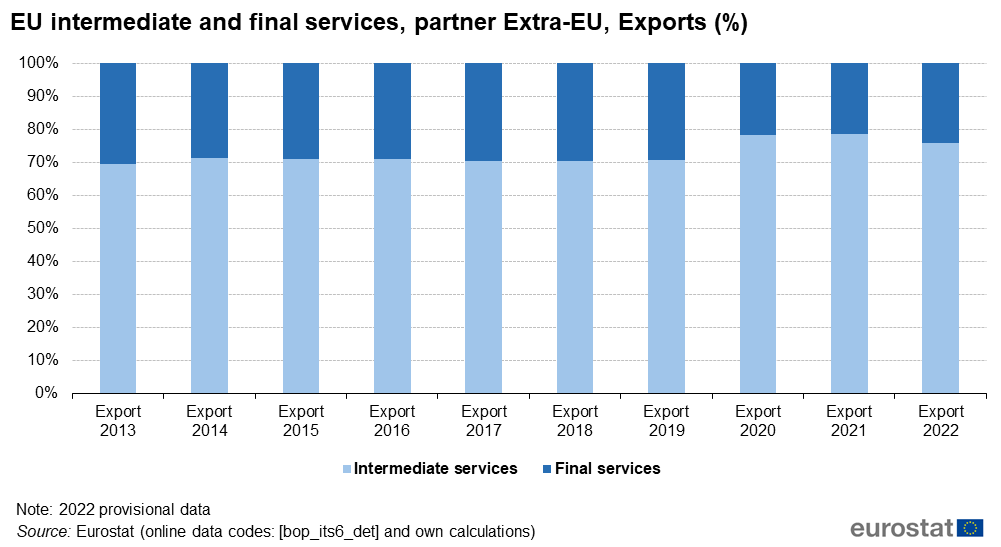
12:57, 29 June 2023
EU intermediate and final services, partner Extra-EU, Exports (%)-2023.png
(
file
)
55 KB
1
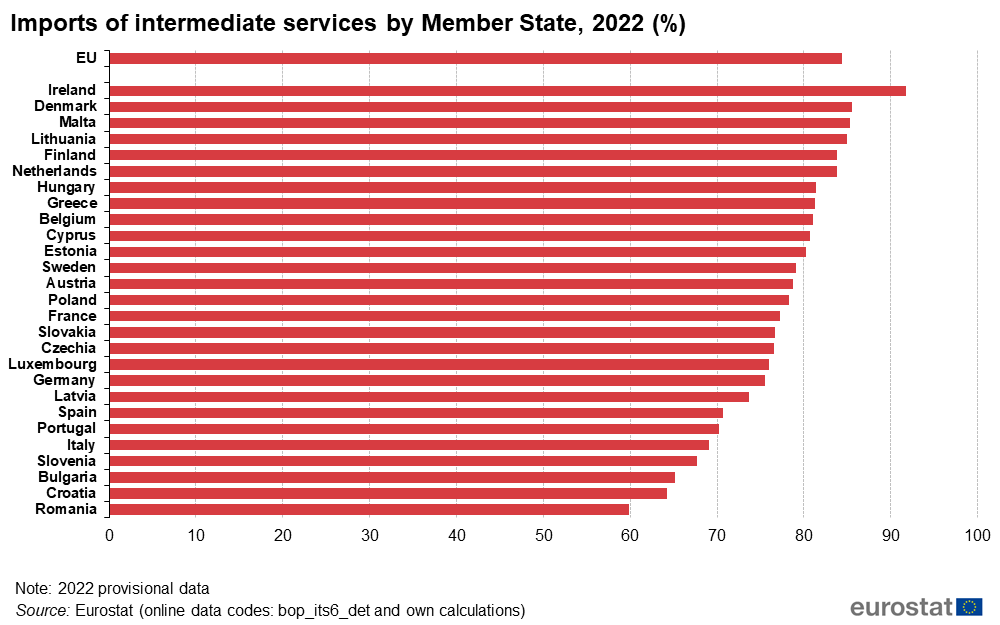
12:54, 29 June 2023
Imports of intermediate services by Member State, 2022 (%).png
(
file
)
45 KB
1
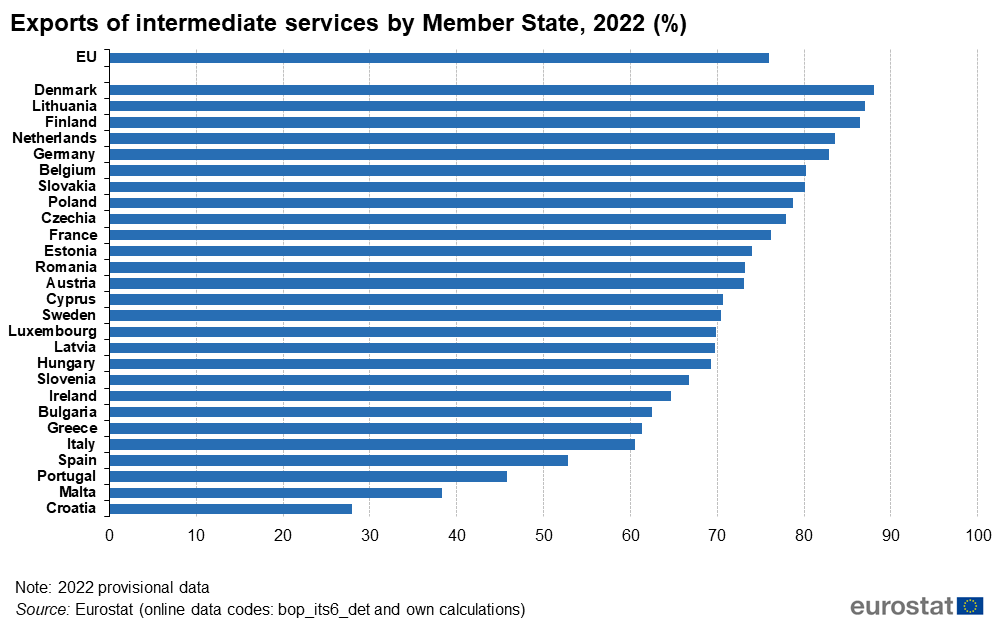
12:50, 29 June 2023
Exports of intermediate services by Member State, 2022 (%).png
(
file
)
46 KB
1
10:19, 29 June 2023
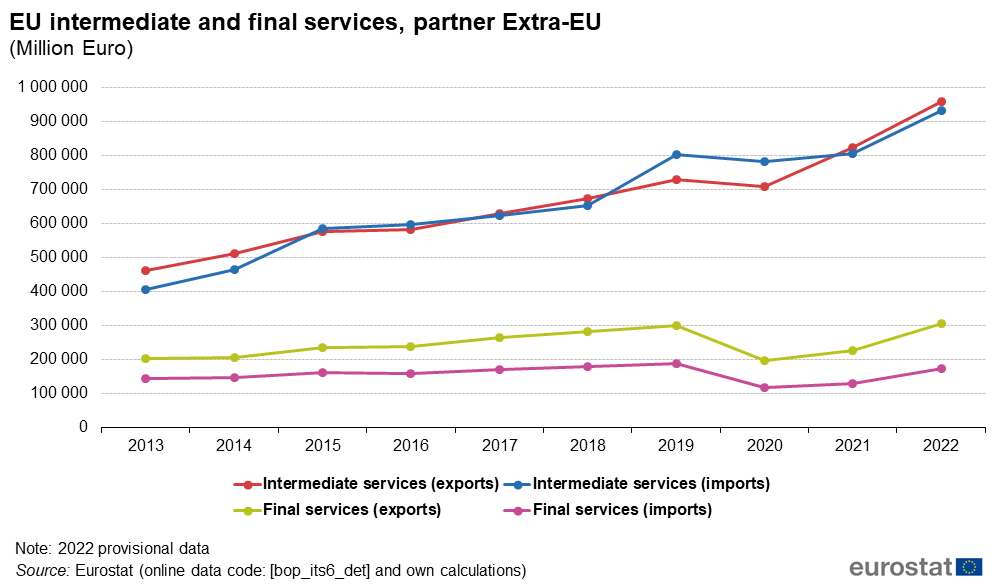
EU intermediate and final services, partner Extra-EU (Million Euro)-new.png
(
file
)
48 KB
1
10:10, 29 June 2023
EU intermediate and final services, partner Extra-EU (Million Euro)-2023.png
(
file
)
51 KB
1
11:36, 20 March 2023
SE2023-Other business serv 2021-GRAPHS - clean.xlsx
(
file
)
144 KB
1
16:15, 21 February 2023
Business services 2020.xlsx
(
file
)
26 KB
1
15:33, 21 February 2023
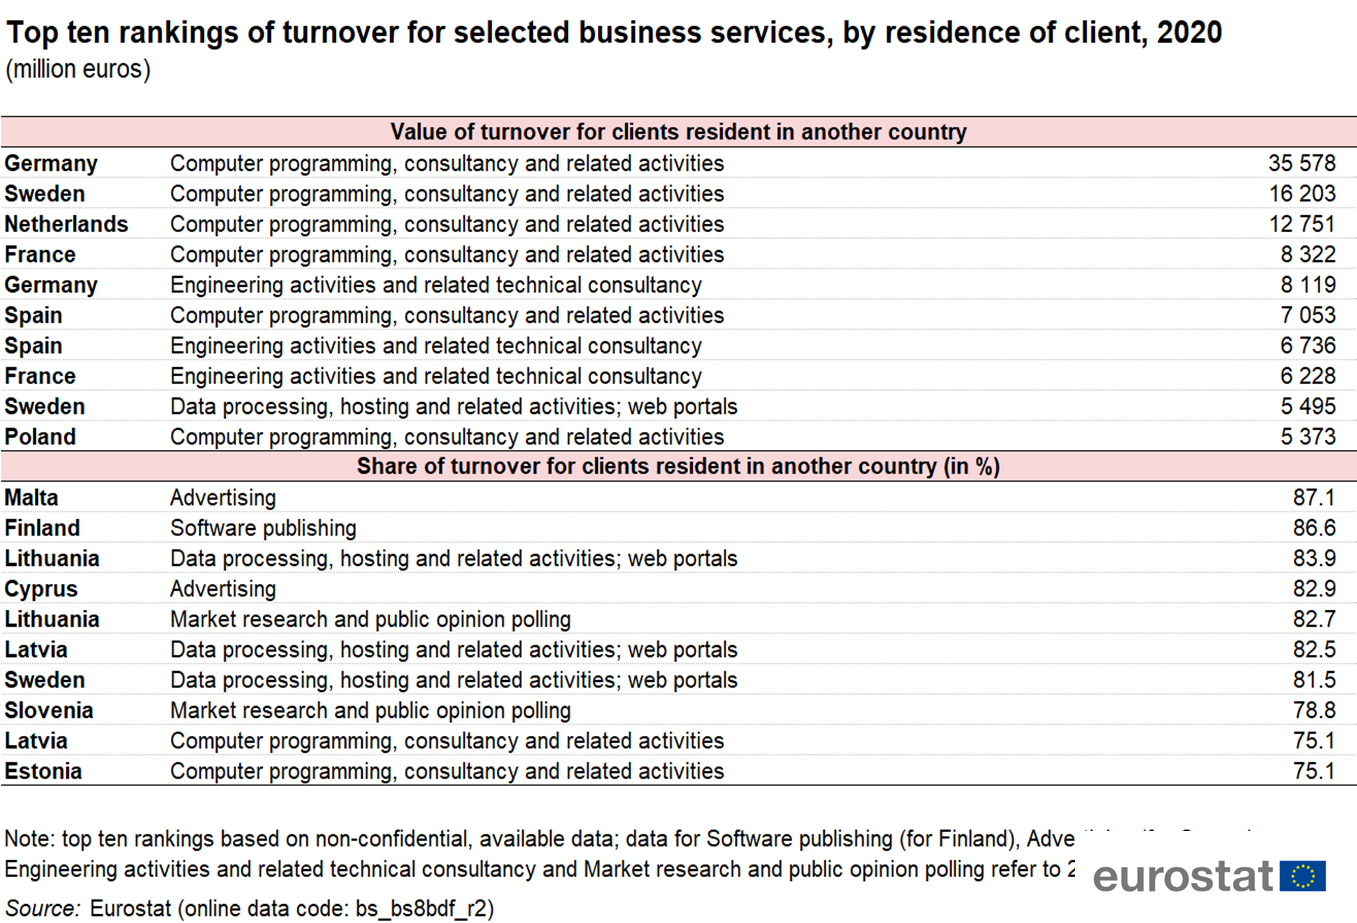
Top ten rankings of turnover 2020.png
(
file
)
643 KB
1
15:15, 21 February 2023
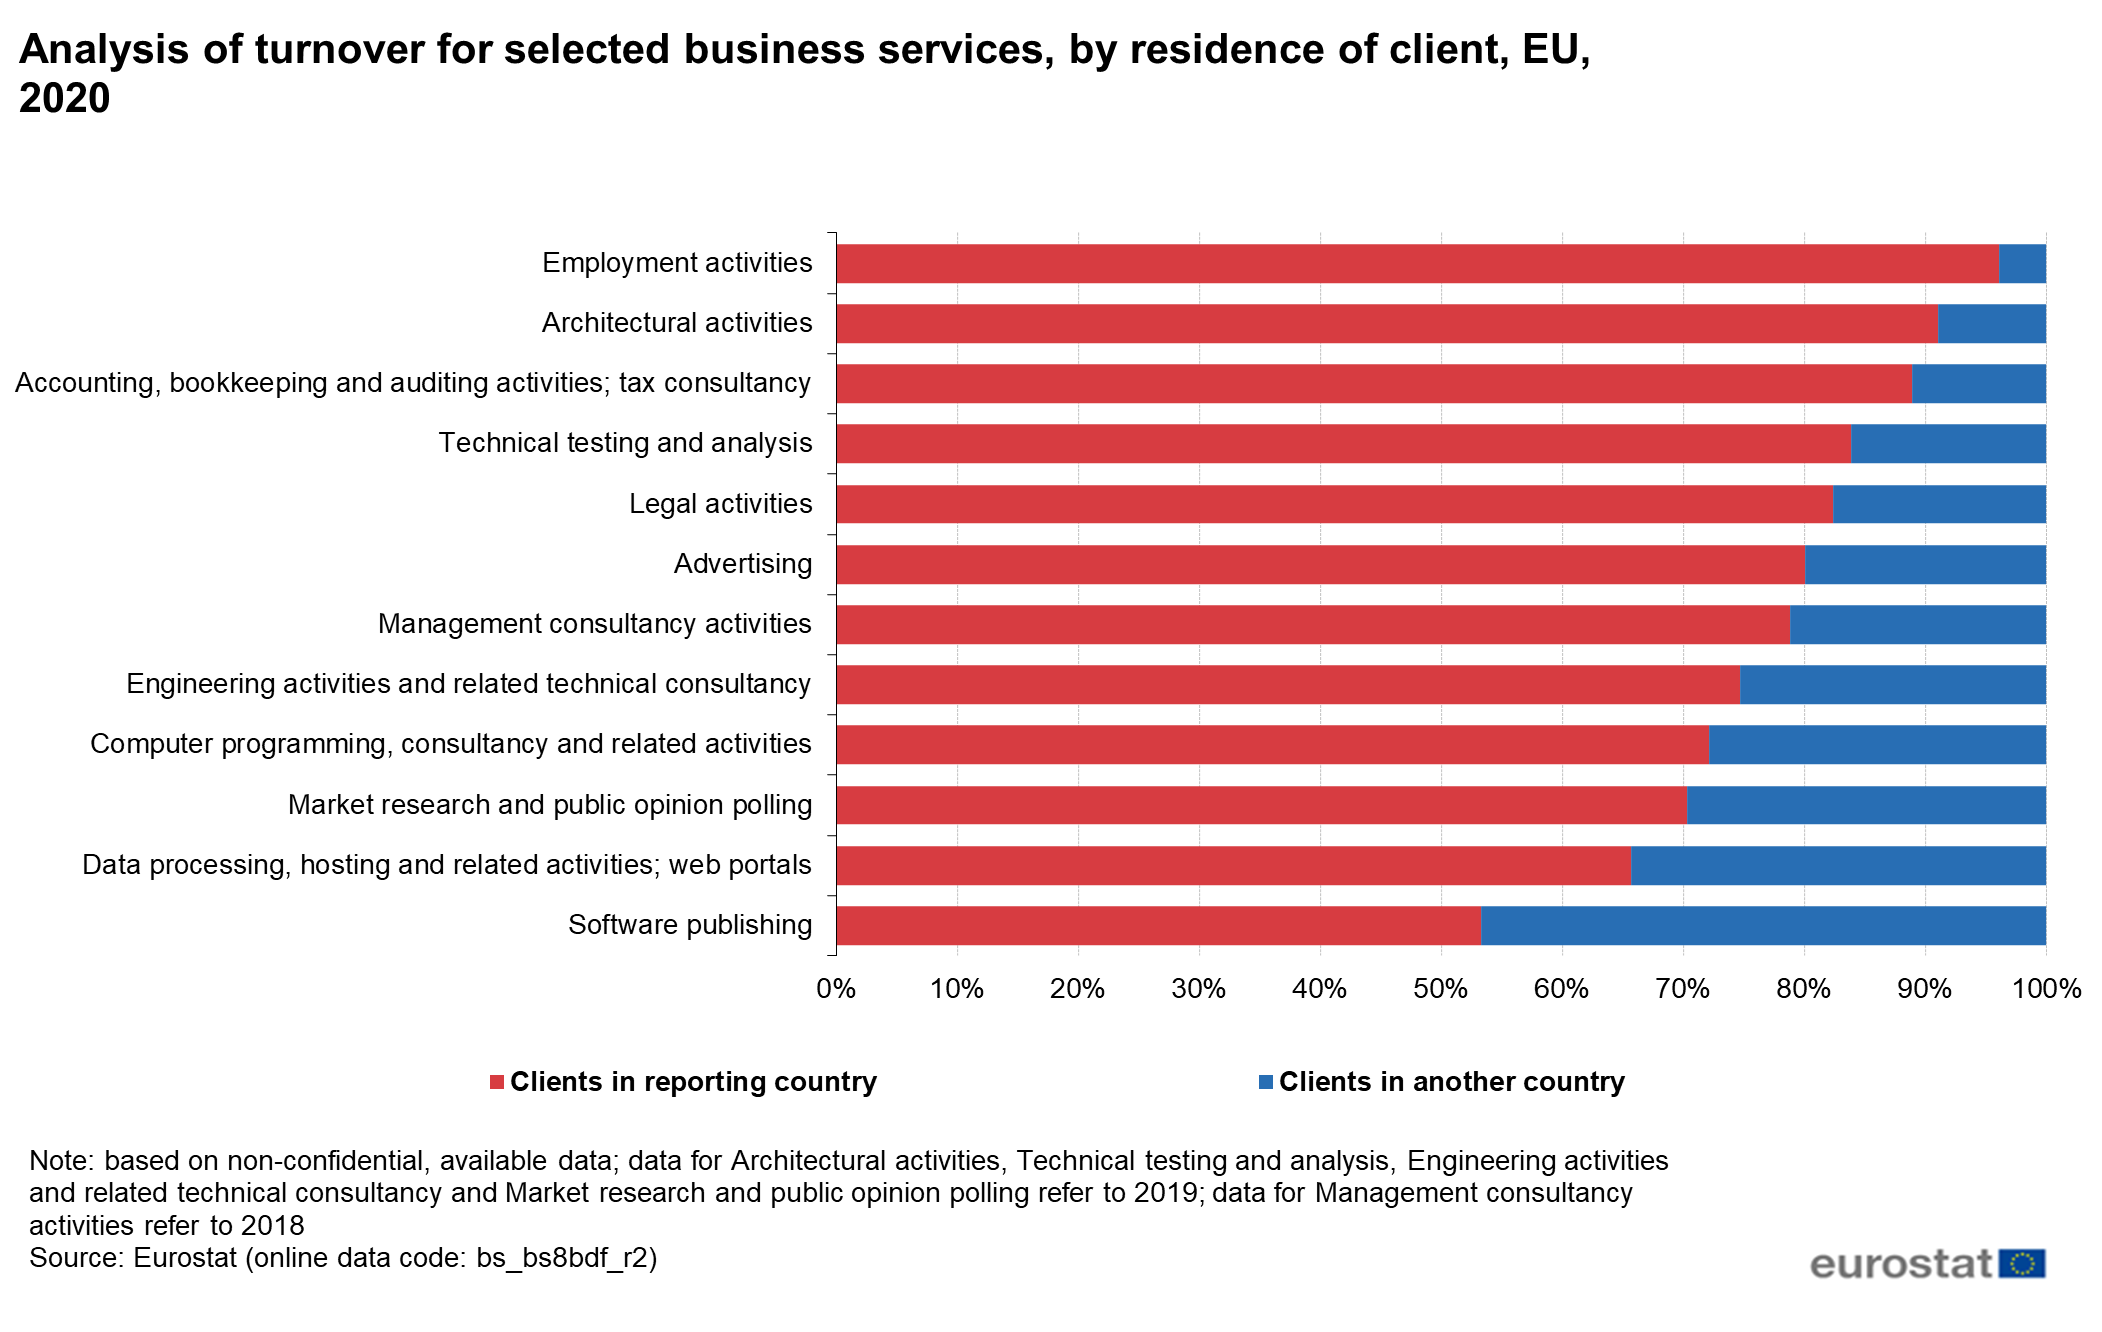
Analysis of turnover 2020.png
(
file
)
158 KB
1
12:06, 16 June 2022
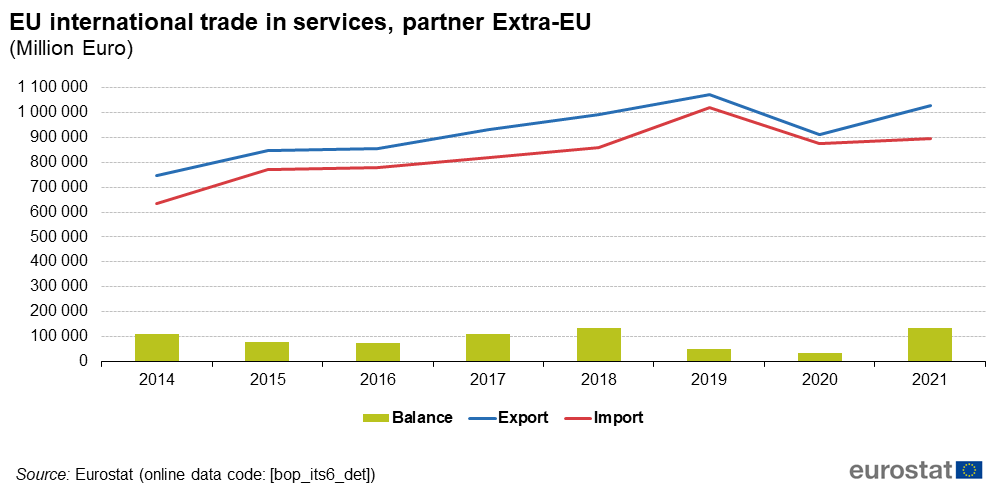
EU international trade in services, partner Extra-EU (Million Euro)-2021.png
(
file
)
36 KB
1
16:23, 31 March 2022
F4 Main trading partners EU transport services 2020.png
(
file
)
66 KB
1
19:11, 22 February 2022
Business services 2019.xlsx
(
file
)
26 KB
1
19:07, 22 February 2022
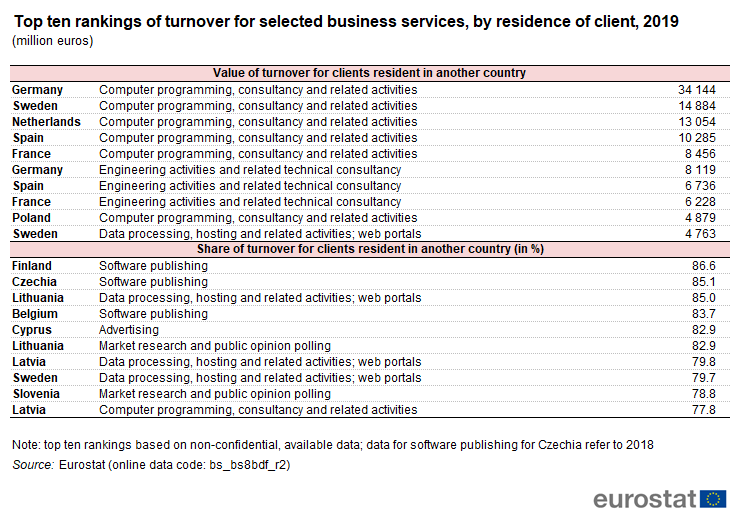
Top ten rankings of turnover for selected business services, by residence of client, 2019.png
(
file
)
55 KB
1
18:48, 22 February 2022
Top ten rankings of turnover for selected business services, by residence of client, 2019 (million euros).png
(
file
)
55 KB
1
18:48, 22 February 2022
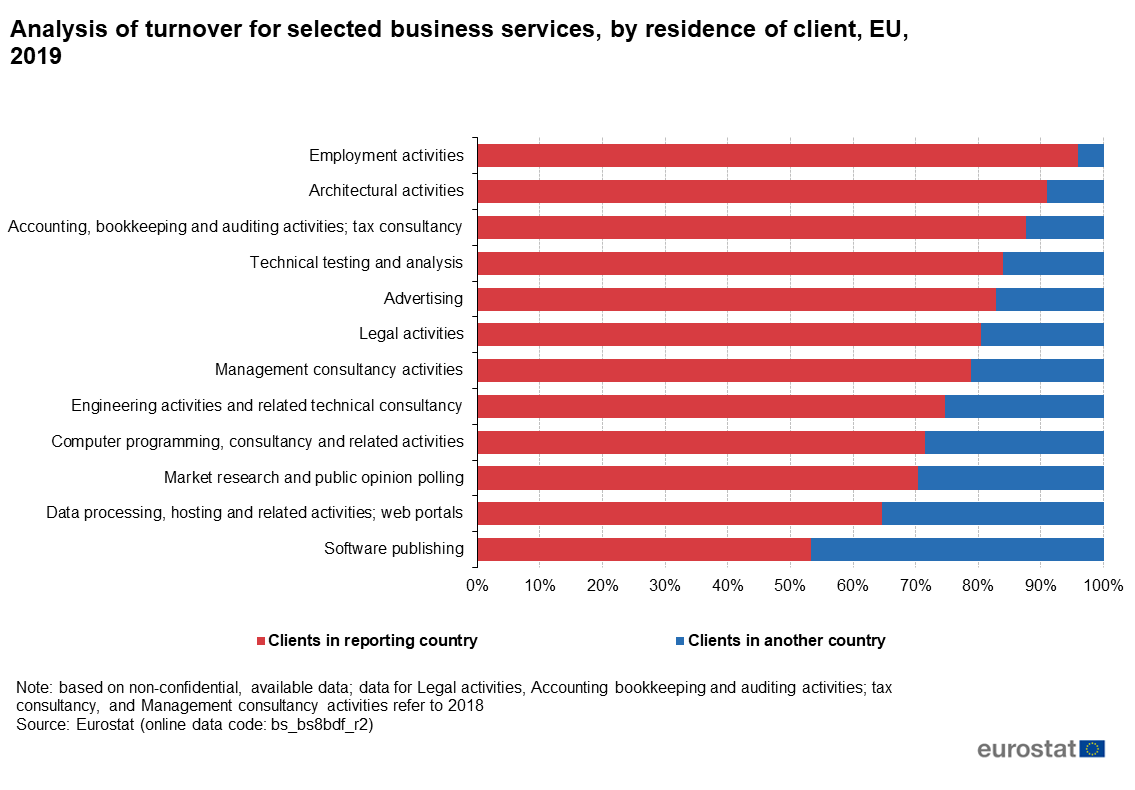
Analysis of turnover for selected business services, by residence of client, EU, 2019.png
(
file
)
65 KB
1
17:48, 17 July 2020
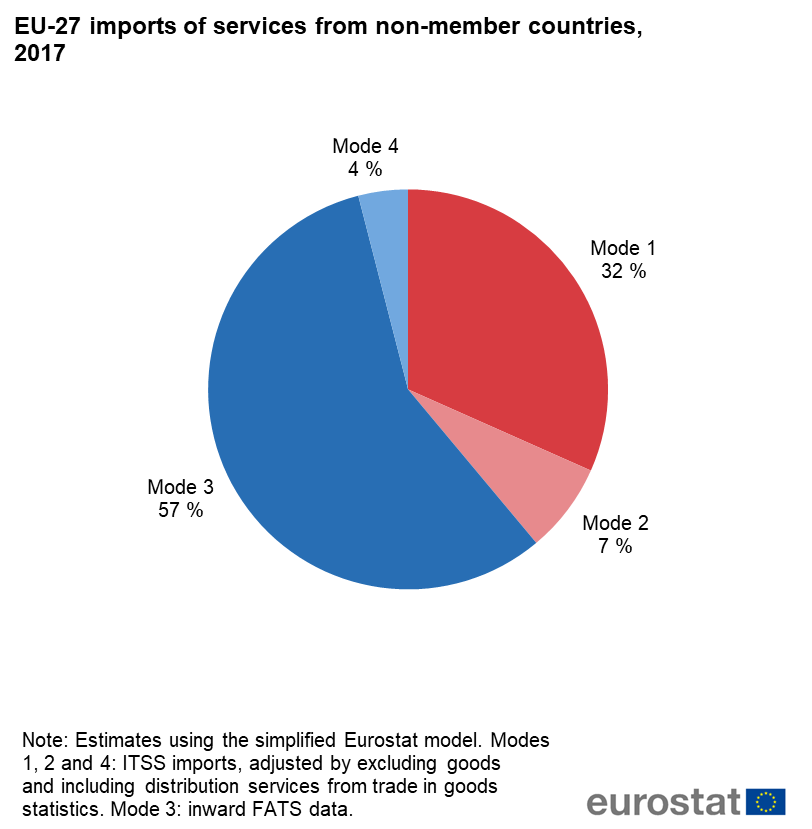
EU-27 imports of services from non-member countries, 2017.png
(
file
)
53 KB
1
16:48, 17 July 2020
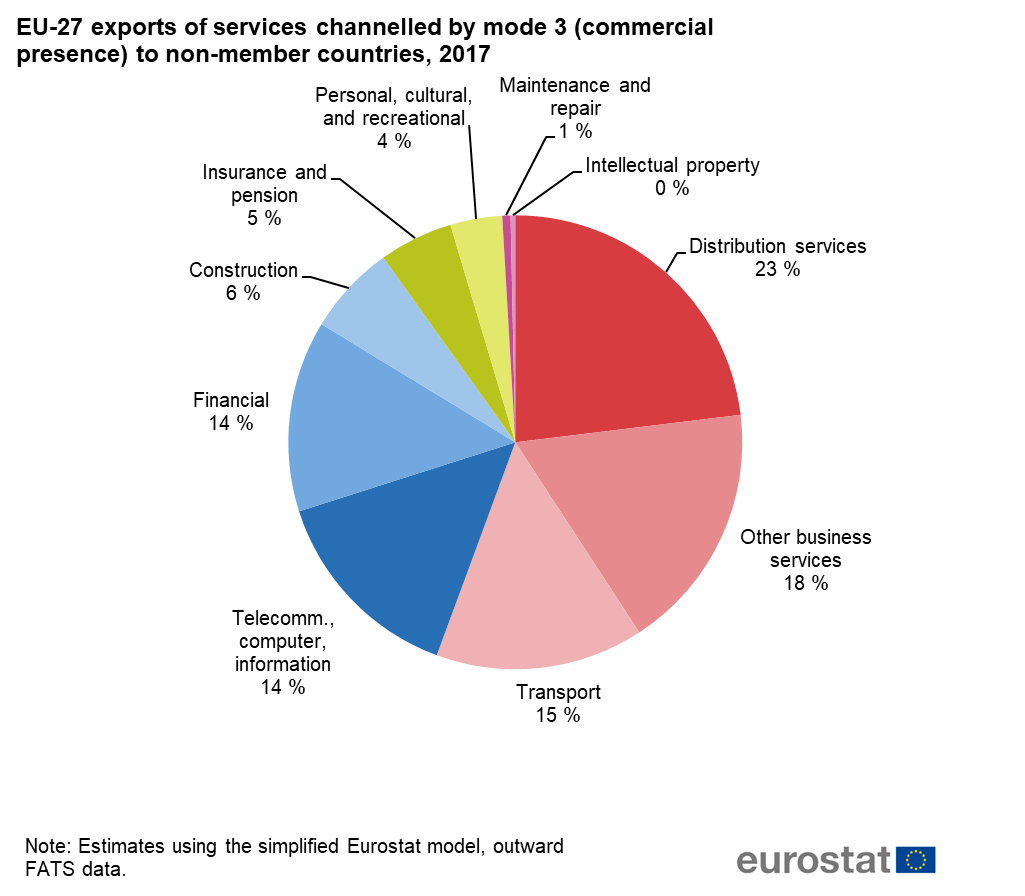
EU-27 exports of services channelled by mode 3 (commercial presence) to non-member countries, 2017.png
(
file
)
79 KB
1
16:48, 17 July 2020
EU-27 exports of services channelled by mode 1 (cross-border supply) to non-member countries, 2017.png
(
file
)
78 KB
1
16:47, 17 July 2020
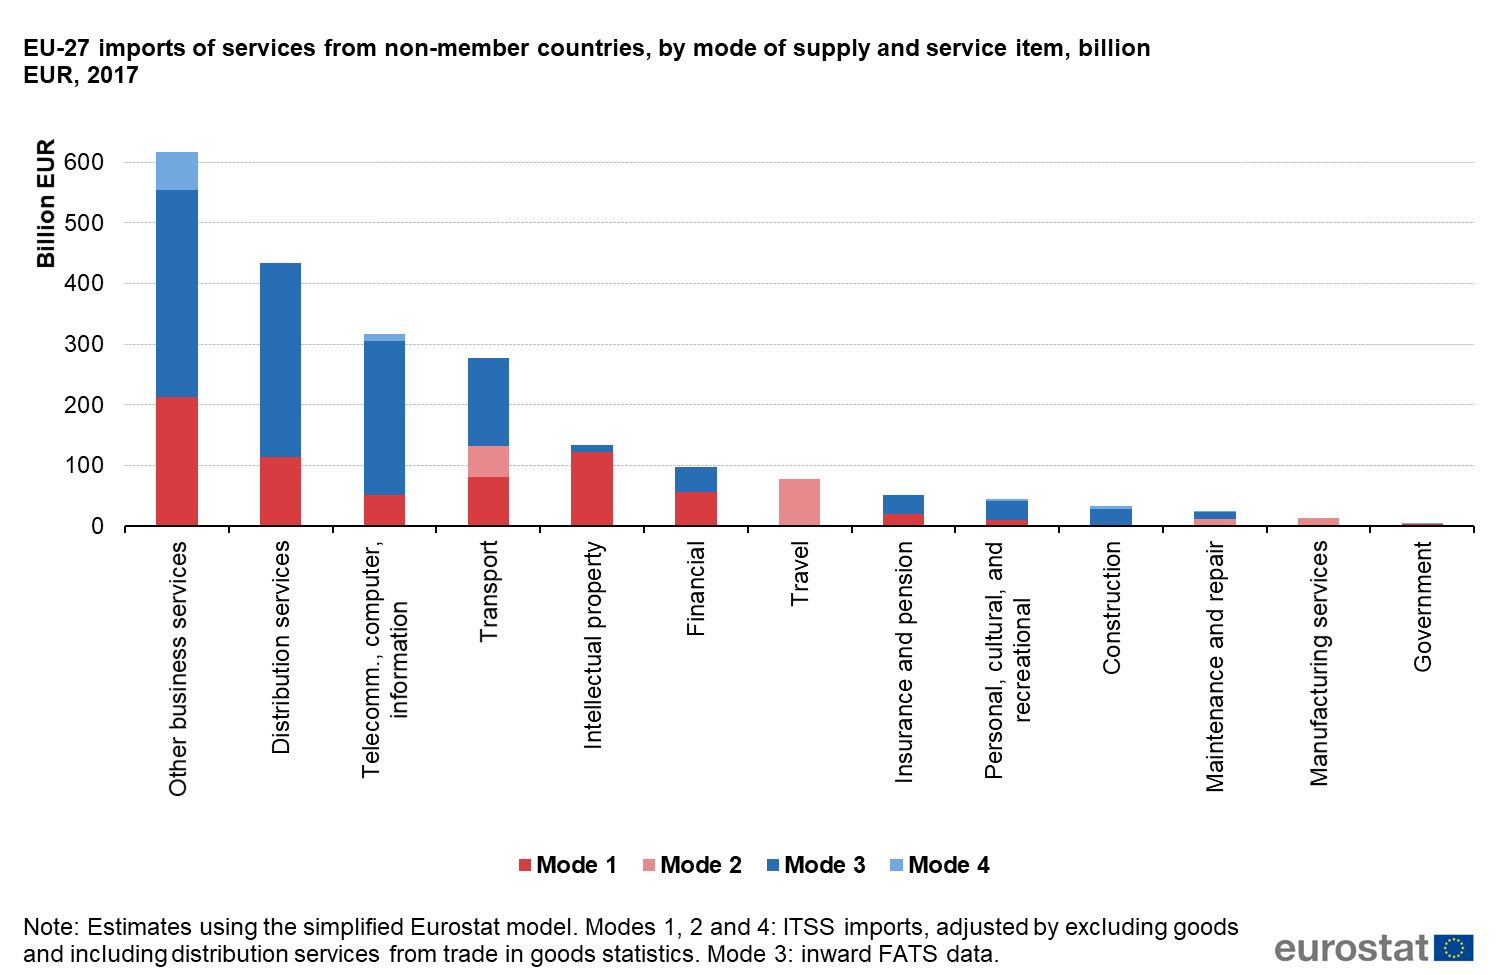
EU-27 imports of services from non-member countries, by mode of supply and service item, billion EUR, 2017.png
(
file
)
110 KB
1
16:47, 17 July 2020
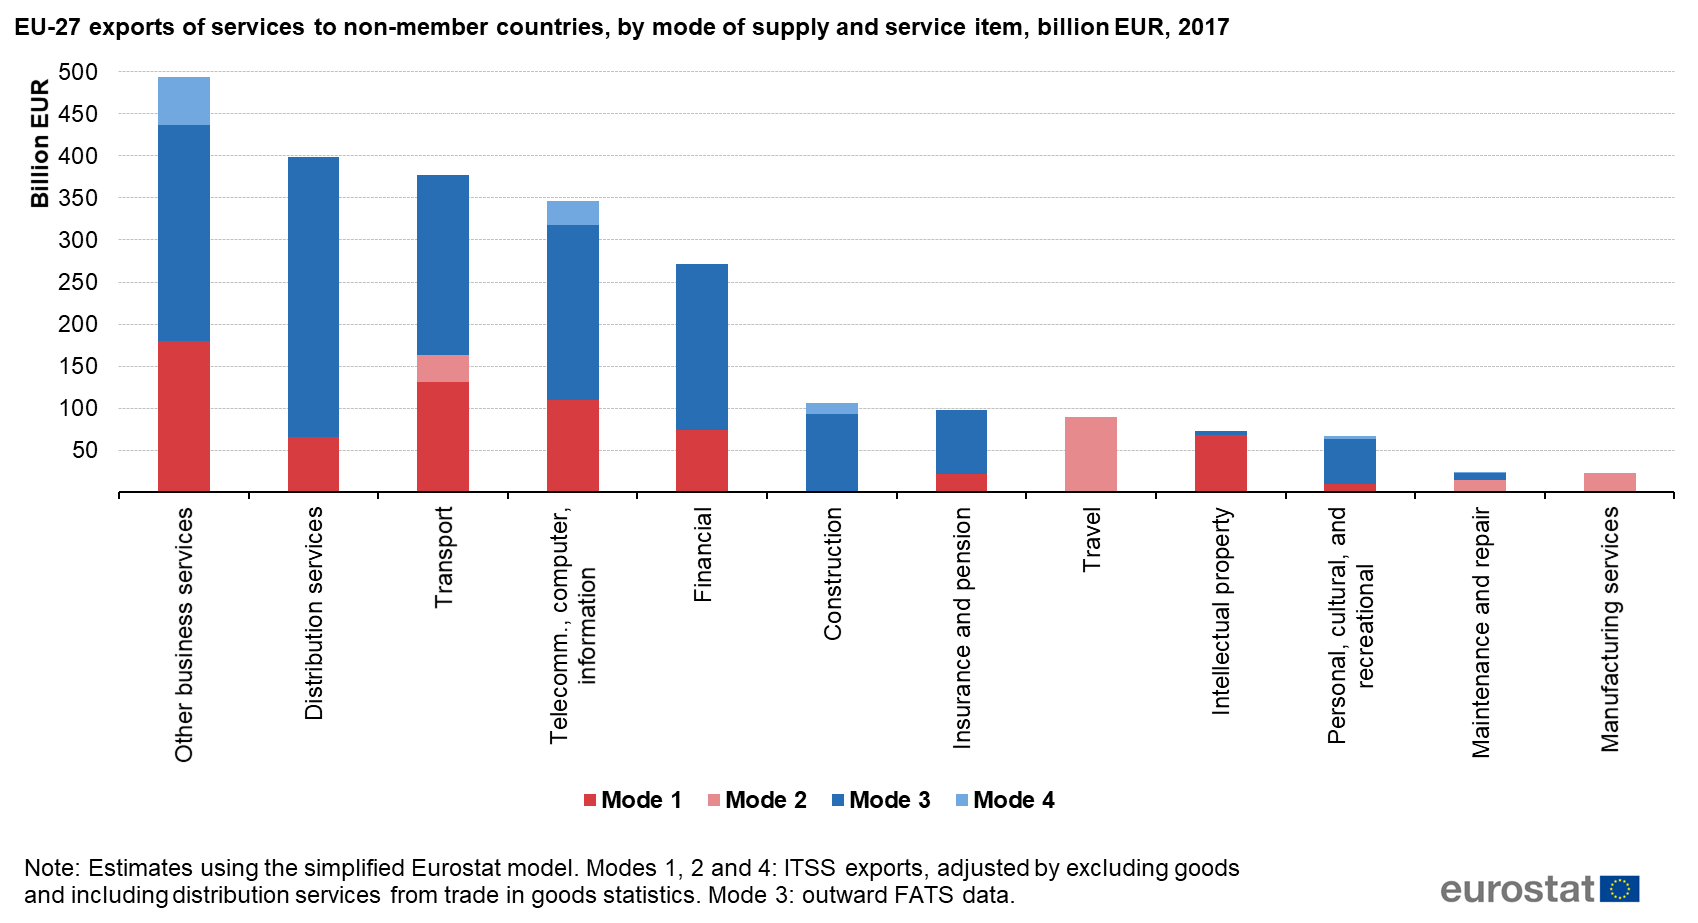
EU-27 exports of services to non-member countries, by mode of supply and service item, billion EUR, 2017.png
(
file
)
120 KB
1
16:47, 17 July 2020
EU-27 imports of services from non-member countries by service item, share of modes of supply (%), 2017.png
(
file
)
124 KB
1
16:47, 17 July 2020
EU-27 exports of services to non-member countries by service item, share of modes of supply (%), 2017.png
(
file
)
127 KB
1
16:47, 17 July 2020
Share of modes in services imports from the rest of the world, by country, 2017.png
(
file
)
168 KB
1
16:47, 17 July 2020
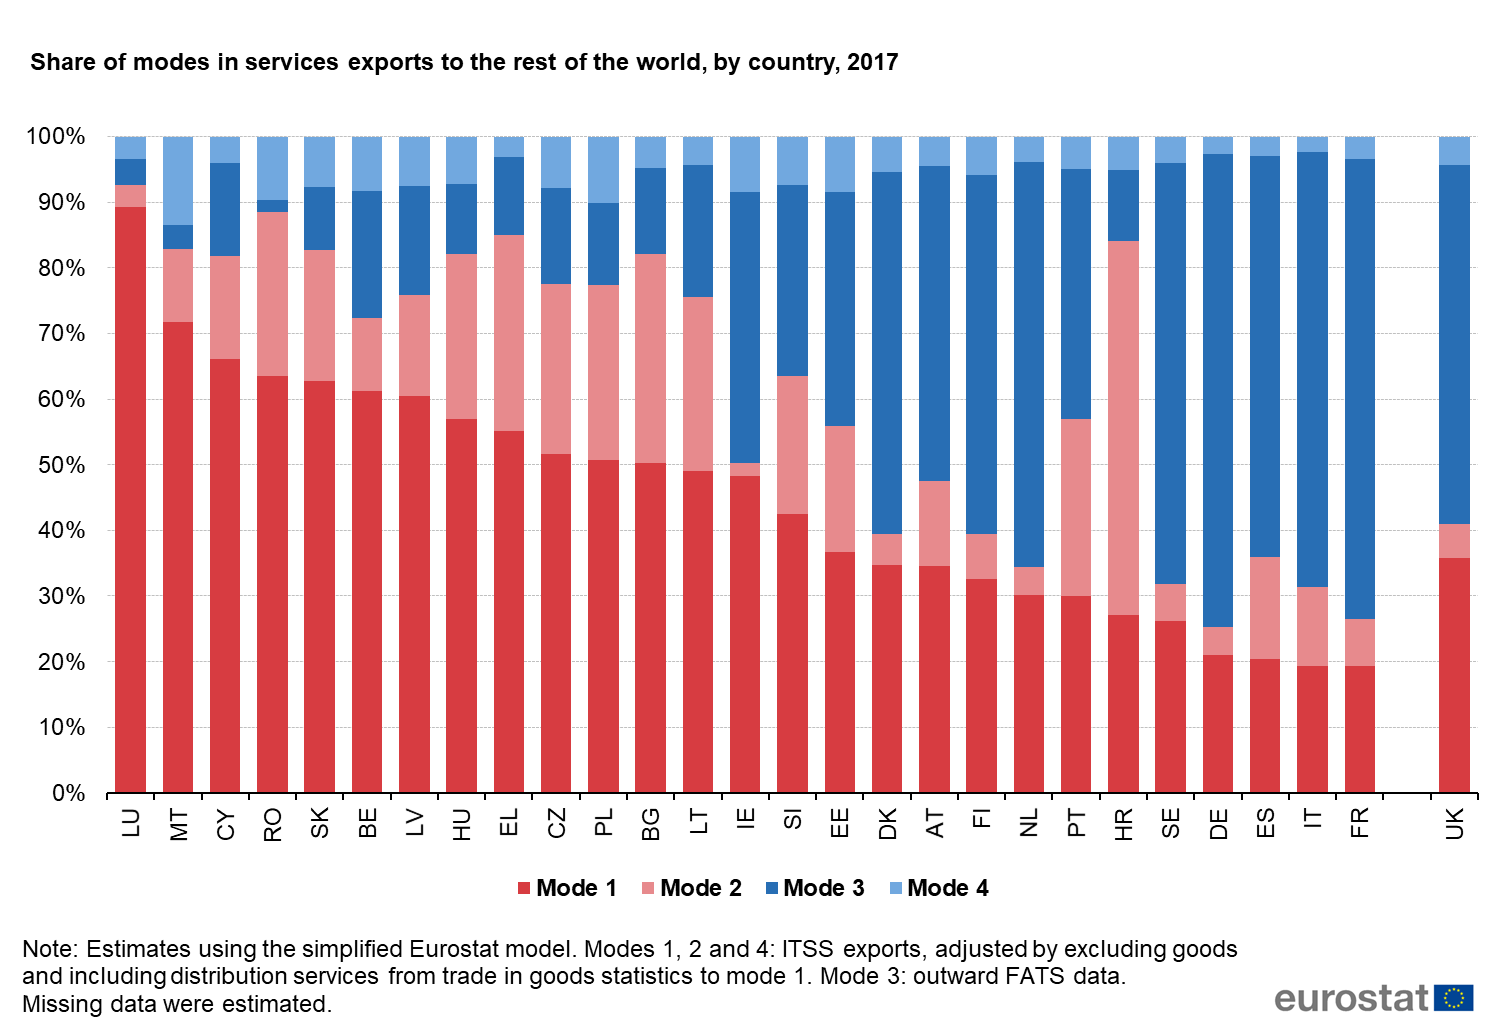
Share of modes in services exports to the rest of the world, by country, 2017.png
(
file
)
175 KB
1
16:47, 17 July 2020
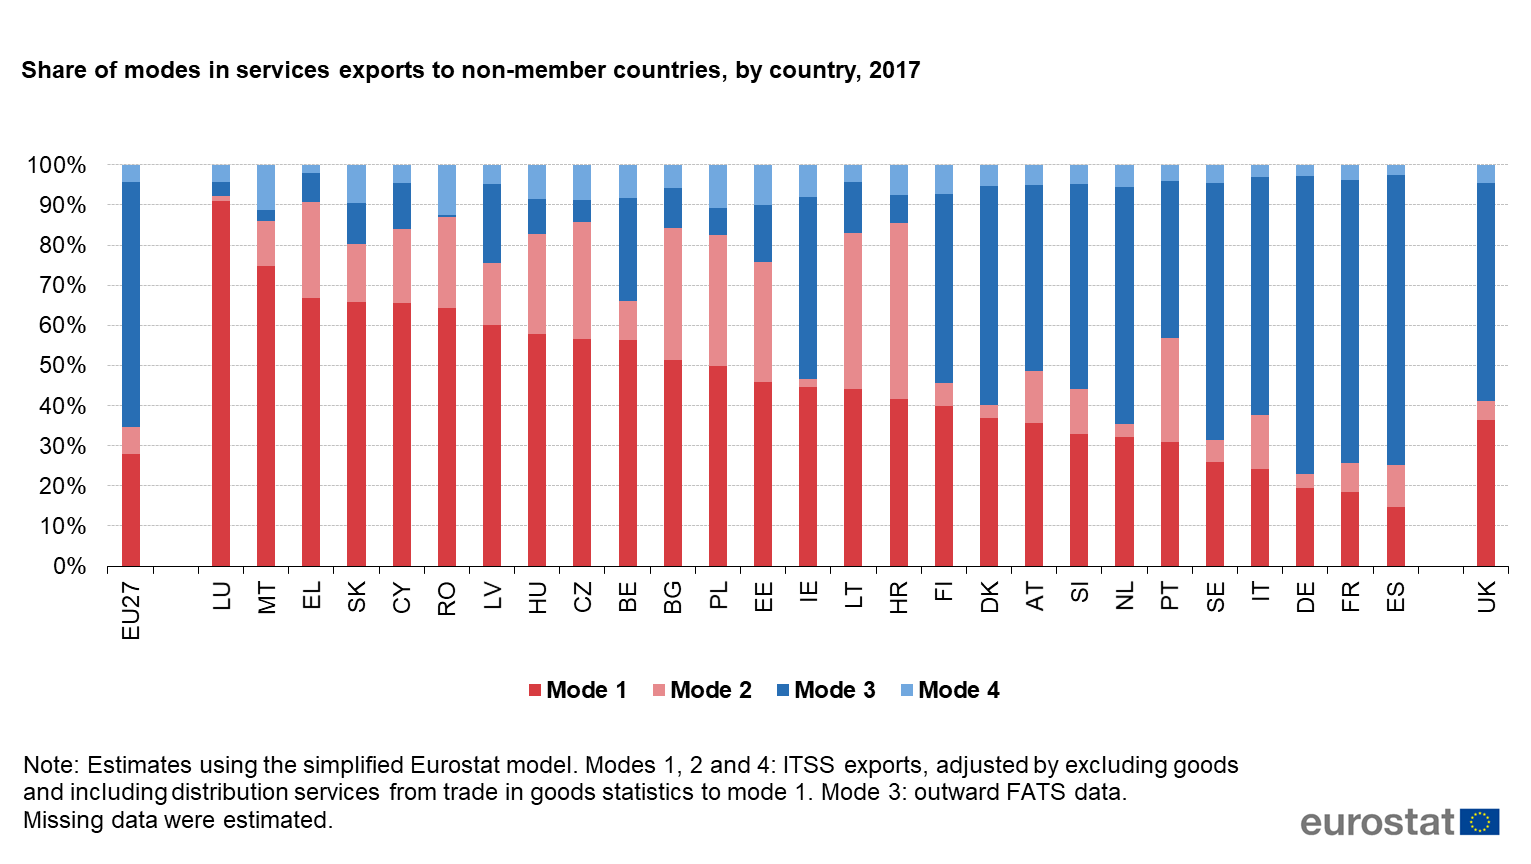
Share of modes in services exports to non-member countries, by country, 2017.png
(
file
)
133 KB
1
16:47, 17 July 2020
Share of modes in services imports to non-member countries, by country, 2017.png
(
file
)
132 KB
1
16:45, 17 July 2020
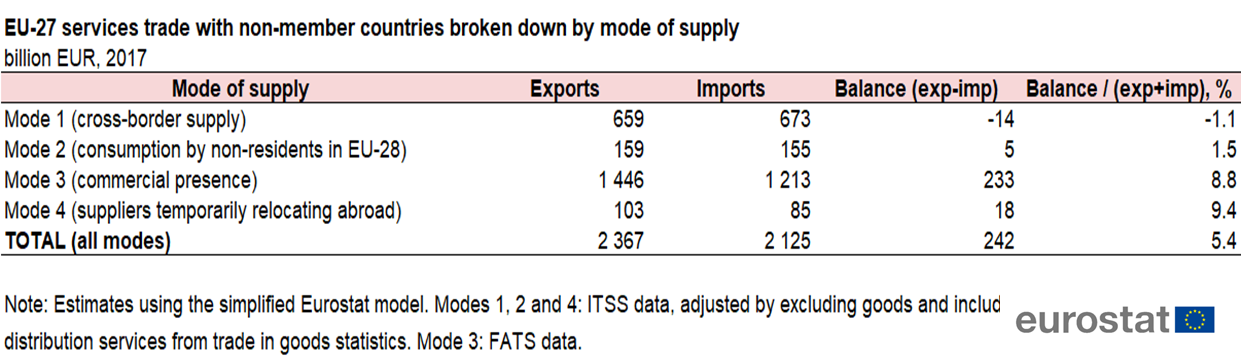
EU-27 services trade with non-member countries broken down by mode of supply billion EUR, 2017.png
(
file
)
220 KB
1
16:30, 17 July 2020
EU-27 trade balance with non-member countries, supply of services compared to goods billion EUR, 2017.png
(
file
)
235 KB
1
16:29, 17 July 2020
EU-27 exports of services to non-member countries, 2017.png
(
file
)
52 KB
1
18:20, 19 March 2019
ARTICLE-MoS-updated March 2019.xlsx
(
file
)
115 KB
1
17:52, 19 March 2019
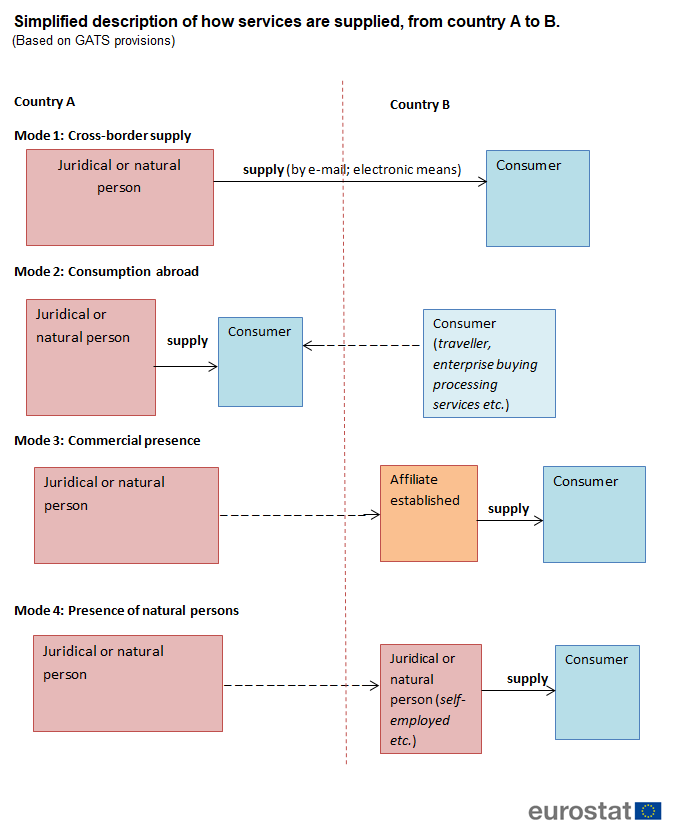
Simplified description of how services are supplied, from country A to B (Based on GATS provisions).png
(
file
)
50 KB
1
16:32, 19 March 2019
EU-28 exports of services to non-member countries, 2015.png
(
file
)
26 KB
Reverted to version as of 14:30, 19 March 2019
5
16:03, 19 March 2019
Proportional allocation of EBOPS categories to modes of supply level.png
(
file
)
81 KB
1
16:02, 19 March 2019
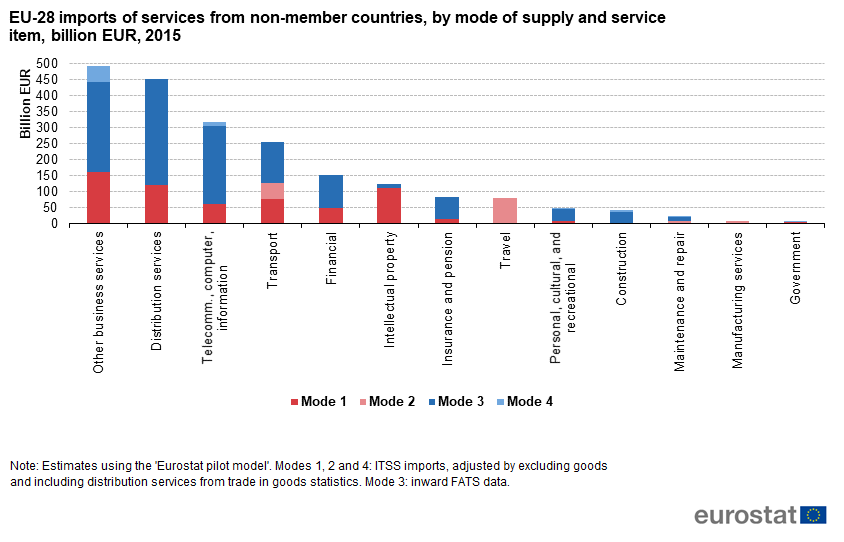
EU-28 imports of services from non-member countries, by mode of supply and service item, billion EUR, 2015.png
(
file
)
40 KB
1
16:02, 19 March 2019
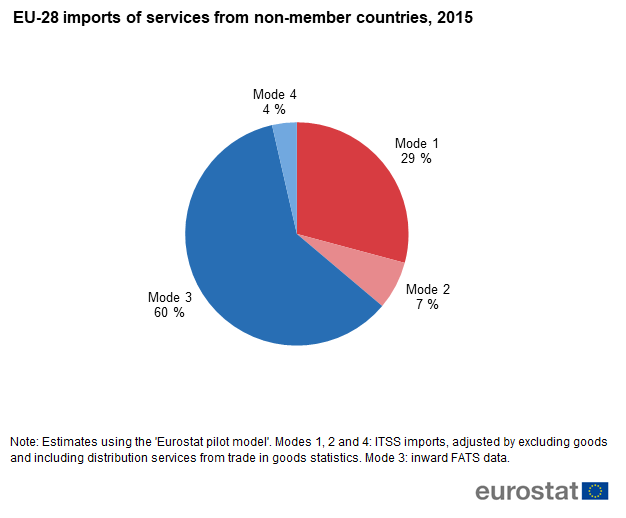
EU-28 imports of services from non-member countries, 2015.png
(
file
)
28 KB
2
First page
Previous page
Next page
Last page
Special page
ISSN 2443-8219


_to_non-member_countries,_2021.png)
_to_non-member_countries,_2021.png)


.png)

-2023.png)
-2023.png)
.png)
.png)
-new.png)
-2023.png)


-2021.png)


.png)


_to_non-member_countries,_2017.png)
_to_non-member_countries,_2017.png)


,_2017.png)
,_2017.png)


.png)


