Tutorials
Log in
Statistics Explained
menu
search
search
Navigation
Main page
Statistical themes
Glossary
Categories
Statistics 4 beginners
Tutorials
Help
Eurostat home
Education corner
Online publications
Regional yearbook
Sustainable development
Full list
Tools
User contributions
Logs
View user groups
Special pages
search
Navigation
Main page
Statistical themes
Glossary
Categories
Statistics 4 beginners
Tutorials
Help
Eurostat home
Education corner
Online publications
Regional yearbook
Sustainable development
Full list
Tools
User contributions
Logs
View user groups
Special pages
Navigation
Main page
Statistical themes
Glossary
Categories
Statistics 4 beginners
Tutorials
Help
Eurostat home
Education corner
Online publications
Regional yearbook
Sustainable development
Full list
Tools
User contributions
Logs
View user groups
Special pages
Uploads by Nparvado
This special page shows all uploaded files.
File list
Items per page:
20
50
100
250
500
Search for media name:
Username:
Include old versions of files
Go
First page
Previous page
Next page
Last page
Date
Name
Thumbnail
Size
Description
Versions
15:25, 20 December 2021
Passenger mobility statistics update Dec 2021 v1.xlsx
(
file
)
71 KB
1
15:25, 20 December 2021
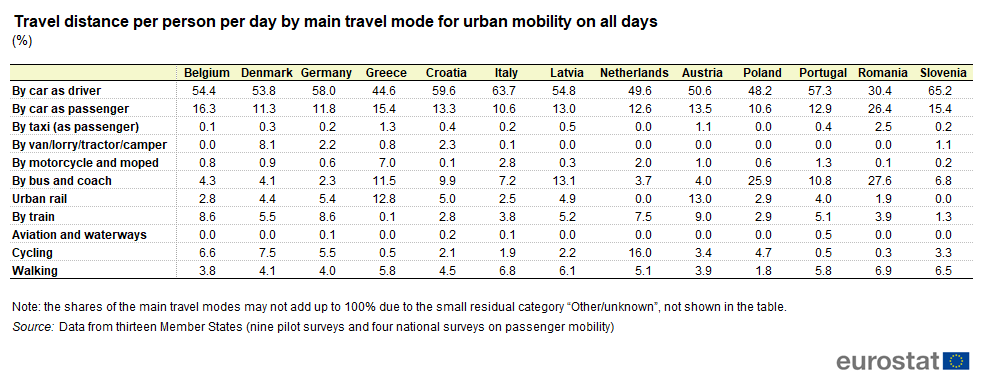
Travel distance per person per day by main travel mode for urban mobility on all days (%) v3.png
(
file
)
34 KB
1
15:24, 20 December 2021
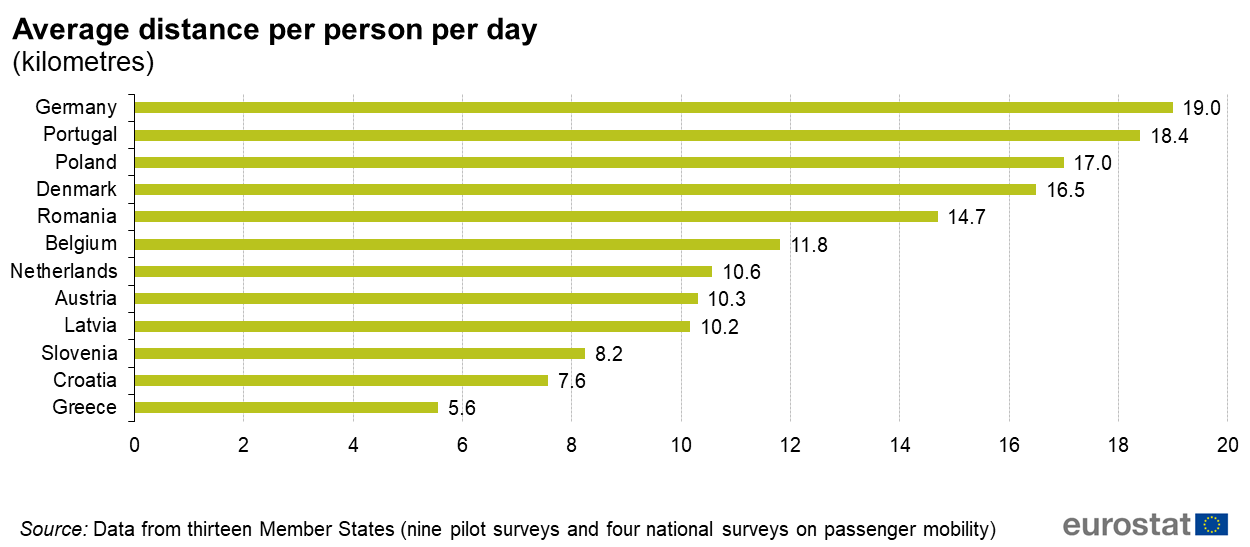
Average distance per person per day (kilometres) v3.png
(
file
)
27 KB
1
15:39, 19 December 2021
Passenger mobility statistics update Dec 2021.xlsx
(
file
)
71 KB
1
15:38, 19 December 2021
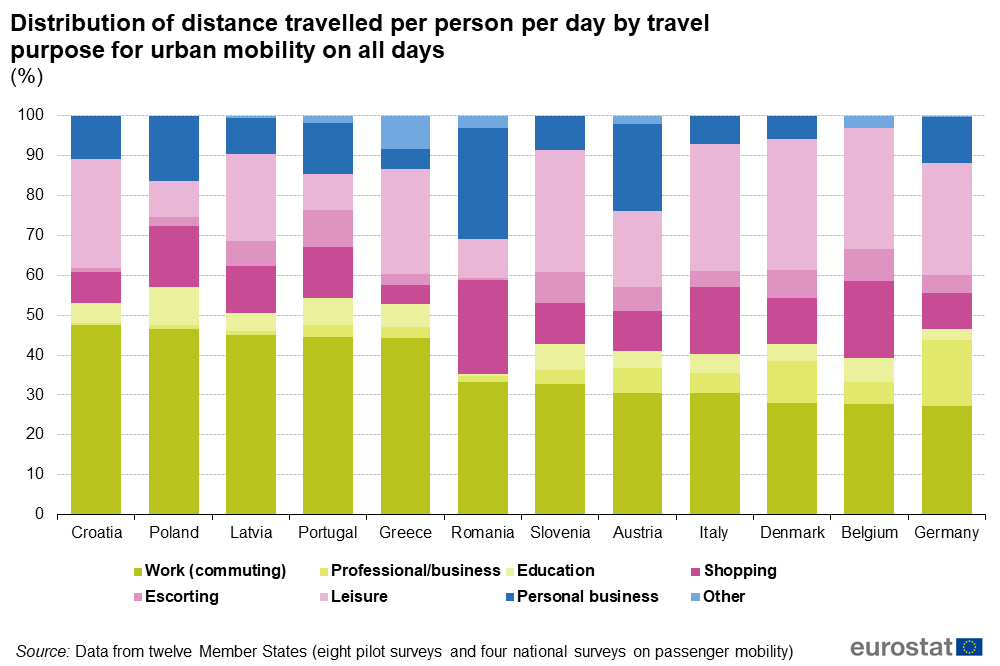
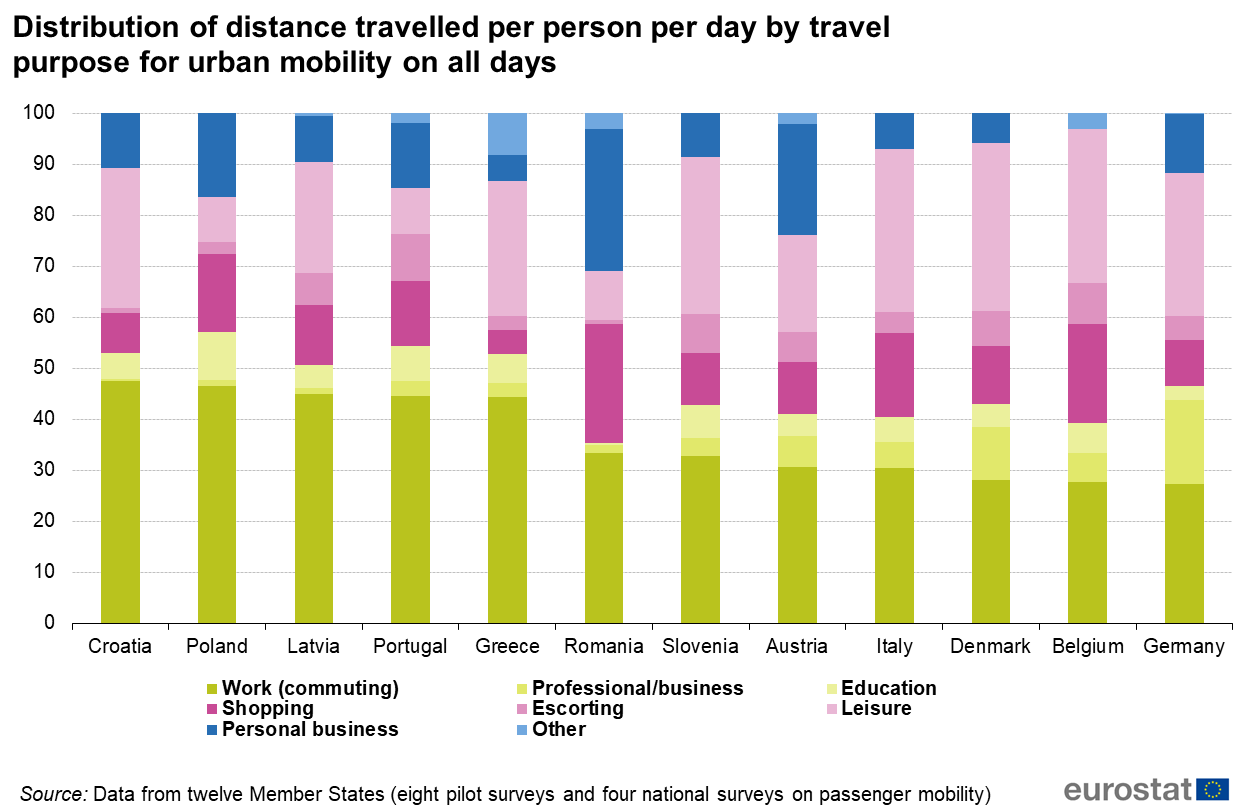
Distribution of distance travelled per person per day by travel purpose for urban mobility on all days (%) v2.png
(
file
)
47 KB
1
15:35, 19 December 2021
Distribution of distance travelled per person per day by travel purpose for urban mobility on all days v2.png
(
file
)
30 KB
1
15:34, 19 December 2021
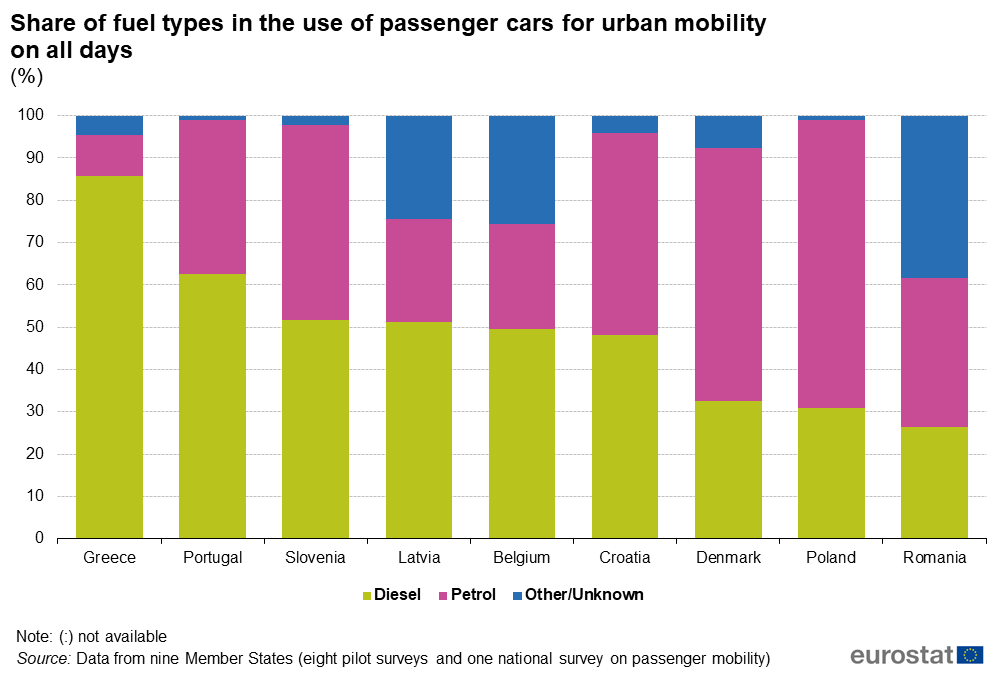
Share of fuel types in the use of passenger cars for urban mobility on all days (%) v3.png
(
file
)
40 KB
1
15:33, 19 December 2021
Average passenger car occupancy for urban mobility on all days v2.png
(
file
)
75 KB
1
15:33, 19 December 2021
Travel distance per person per day by main travel mode for urban mobility on all days (%) v2.png
(
file
)
33 KB
1
15:28, 19 December 2021
Average distance per person per day (kilometres) v2.png
(
file
)
40 KB
2
15:25, 19 December 2021
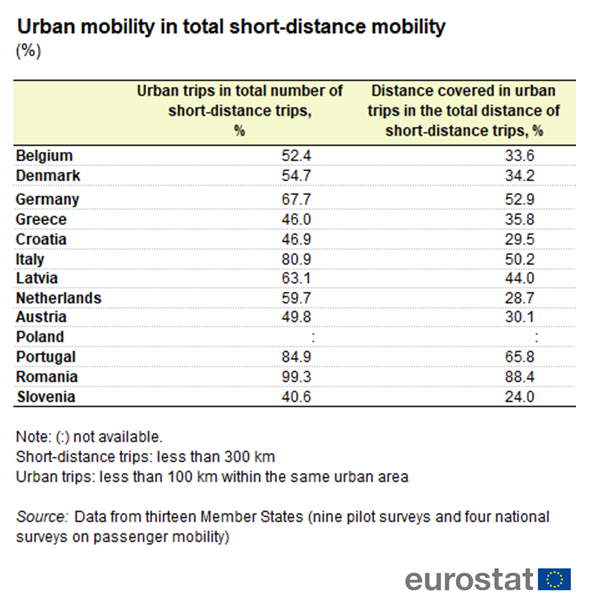
Urban mobility in total short-distance mobility (%) v2.png
(
file
)
22 KB
1
15:24, 19 December 2021
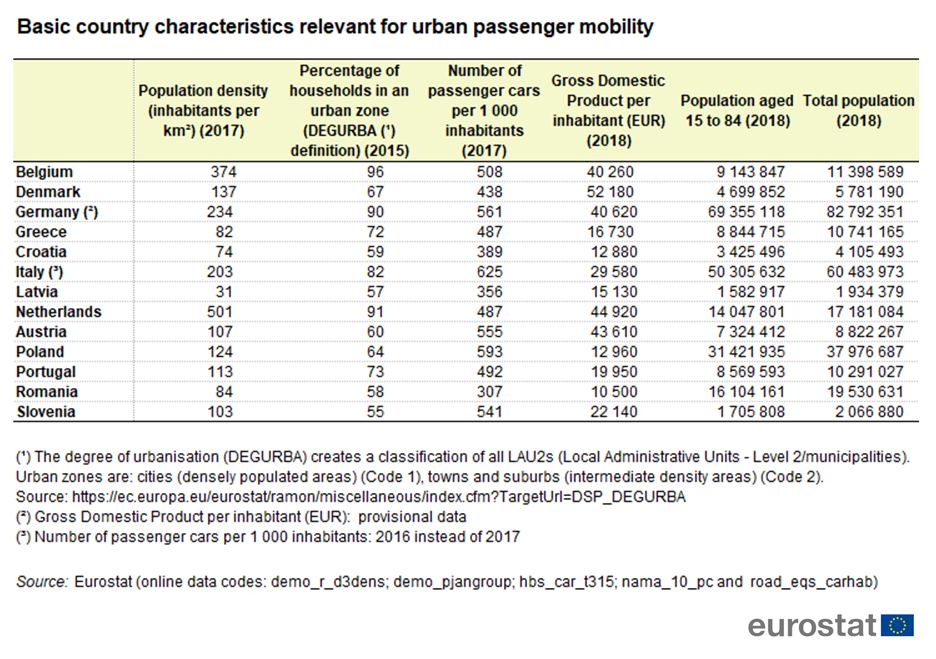
Basic country characteristics relevant for urban passenger mobility v2.png
(
file
)
44 KB
1
21:06, 6 December 2021
Passenger mobility statistics November 2021-update.xlsx
(
file
)
72 KB
1
20:58, 6 December 2021
Information on surveys’ sample and respondents for trips less than 300 km, performed all days v1.png
(
file
)
279 KB
1
20:58, 6 December 2021
Share of fuel types in the use of passenger cars for urban mobility on all days (%) v1.png
(
file
)
64 KB
1
20:57, 6 December 2021
Average passenger car occupancy for urban mobility on all days v1.png
(
file
)
73 KB
1
20:57, 6 December 2021
Travel distance per person per day by main travel mode for urban mobility on all days (%) v1.png
(
file
)
246 KB
1
20:56, 6 December 2021
Distribution of distance travelled per person per day by travel purpose for urban mobility on all days T3 v1.png
(
file
)
194 KB
1
20:55, 6 December 2021
Average distance per person per day (kilometres) v1.png
(
file
)
39 KB
1
20:55, 6 December 2021
Urban mobility in total short-distance mobility (%) v1.png
(
file
)
162 KB
1
20:54, 6 December 2021
Basic country characteristics relevant for urban passenger mobility v1.png
(
file
)
373 KB
1
20:53, 6 December 2021
Distribution of distance travelled per person per day by travel purpose for urban mobility on all days v1.png
(
file
)
65 KB
1
10:26, 13 October 2021
Transport equipment statistics update 2021 v6.xlsx
(
file
)
145 KB
1
10:24, 13 October 2021
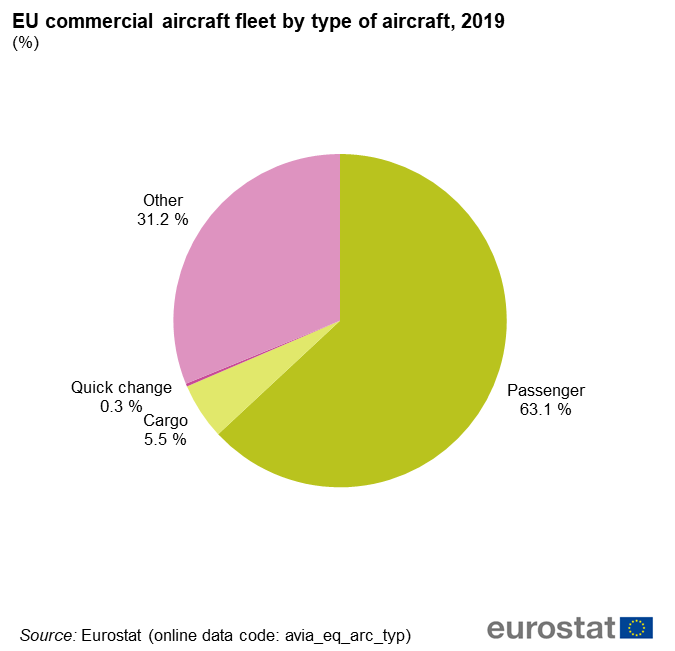
EU commercial aircraft fleet by type of aircraft, 2019 (%).png
(
file
)
23 KB
1
10:21, 13 October 2021
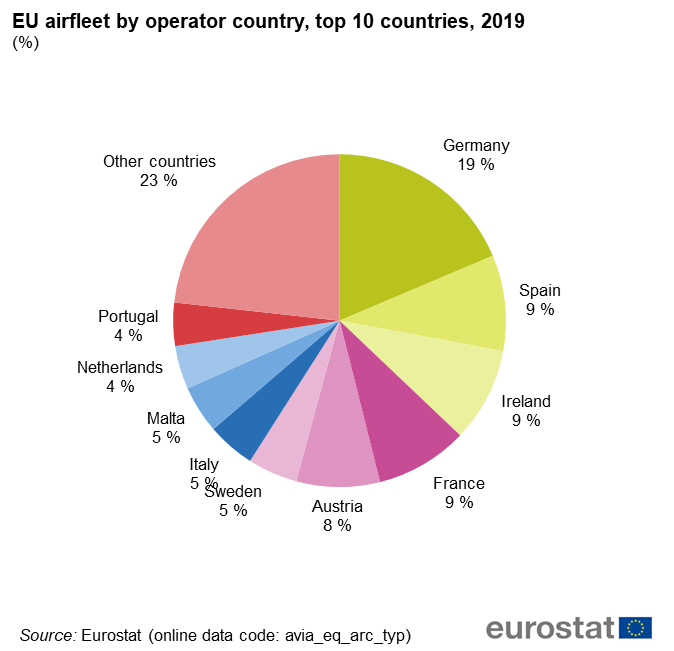
EU commercial aircraft fleet by operator country, top 10 countries, 2019 (%).png
(
file
)
31 KB
1
15:08, 14 September 2021
SE Passenger cars in the EU update 2021 v3.xlsx
(
file
)
74 KB
1
15:08, 14 September 2021
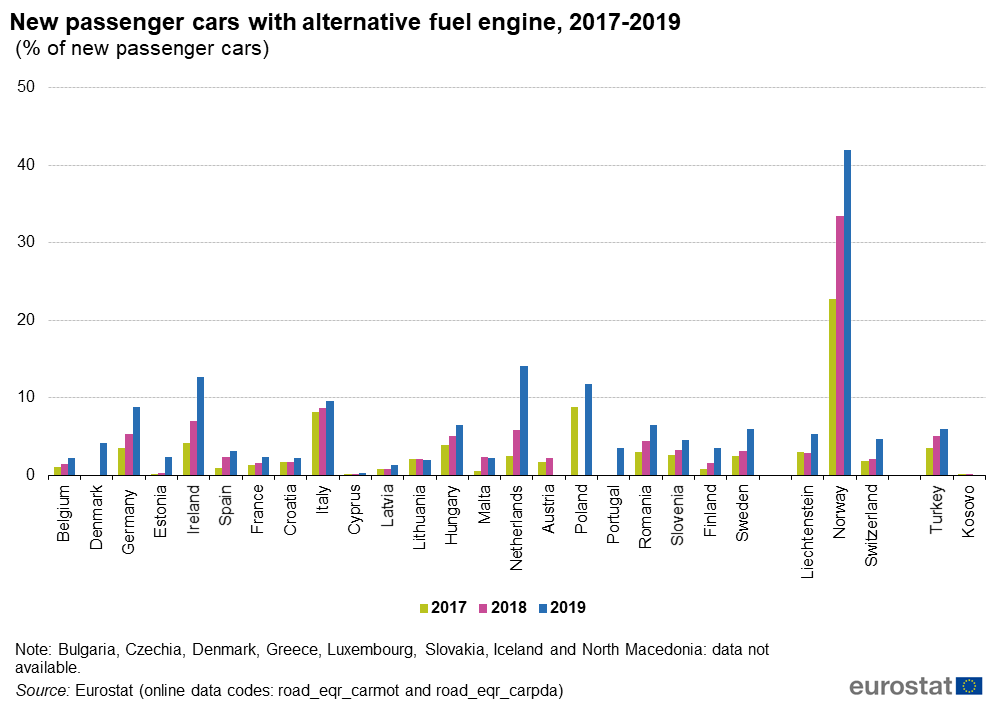
New passenger cars with alternative fuel engine, 2017-2019 (% of new passenger cars) v2.png
(
file
)
43 KB
1
15:07, 14 September 2021
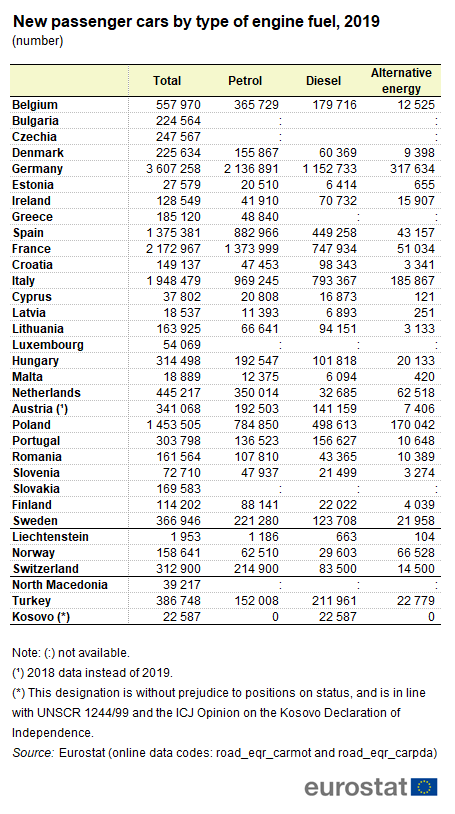
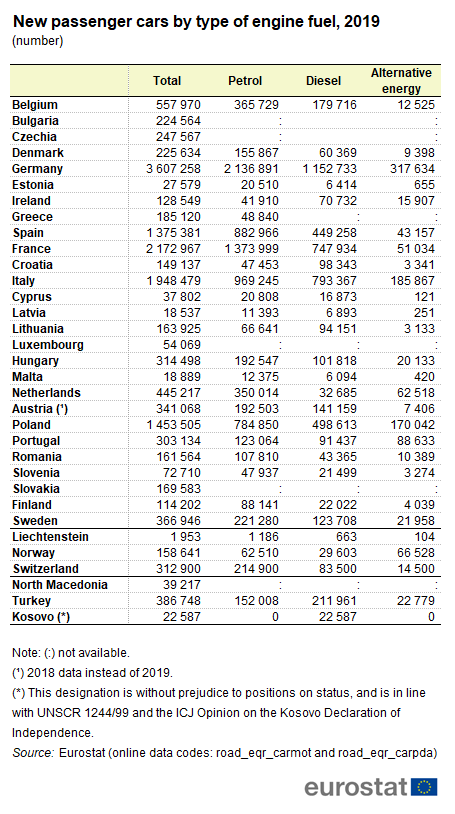
New passenger cars by type of engine fuel, 2019 v3.png
(
file
)
46 KB
1
12:54, 26 August 2021
New passenger cars by type of engine fuel, 2019 v2.png
(
file
)
46 KB
1
19:25, 25 August 2021
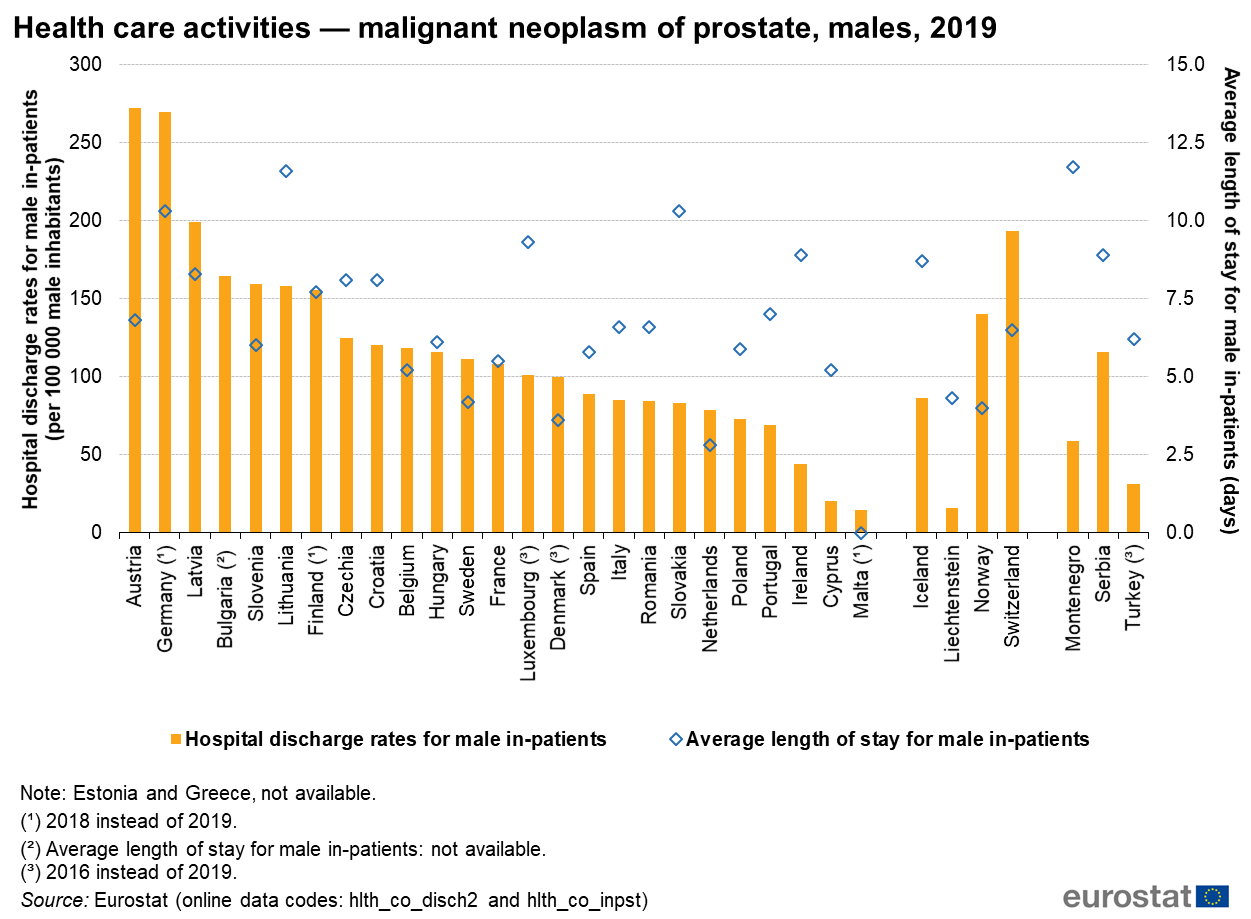
Health care activities — malignant neoplasm of prostate, males, 2019.png
(
file
)
127 KB
1
19:24, 25 August 2021
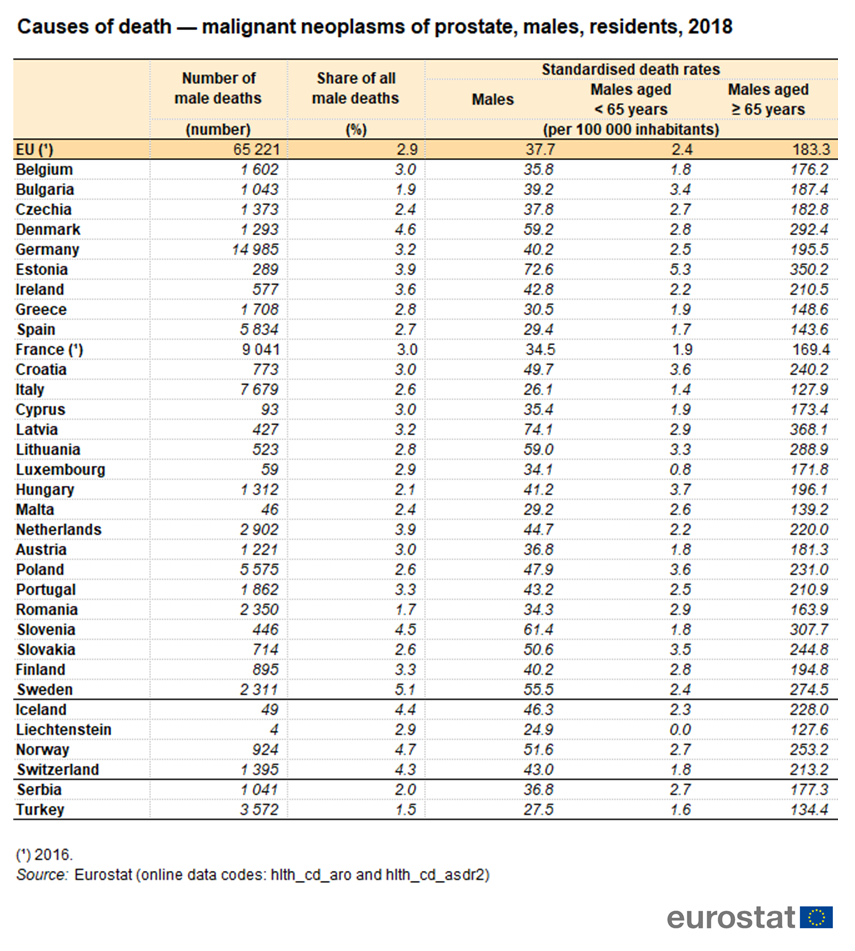
Causes of death — malignant neoplasms of prostate, males, residents, 2018.png
(
file
)
349 KB
1
19:24, 25 August 2021
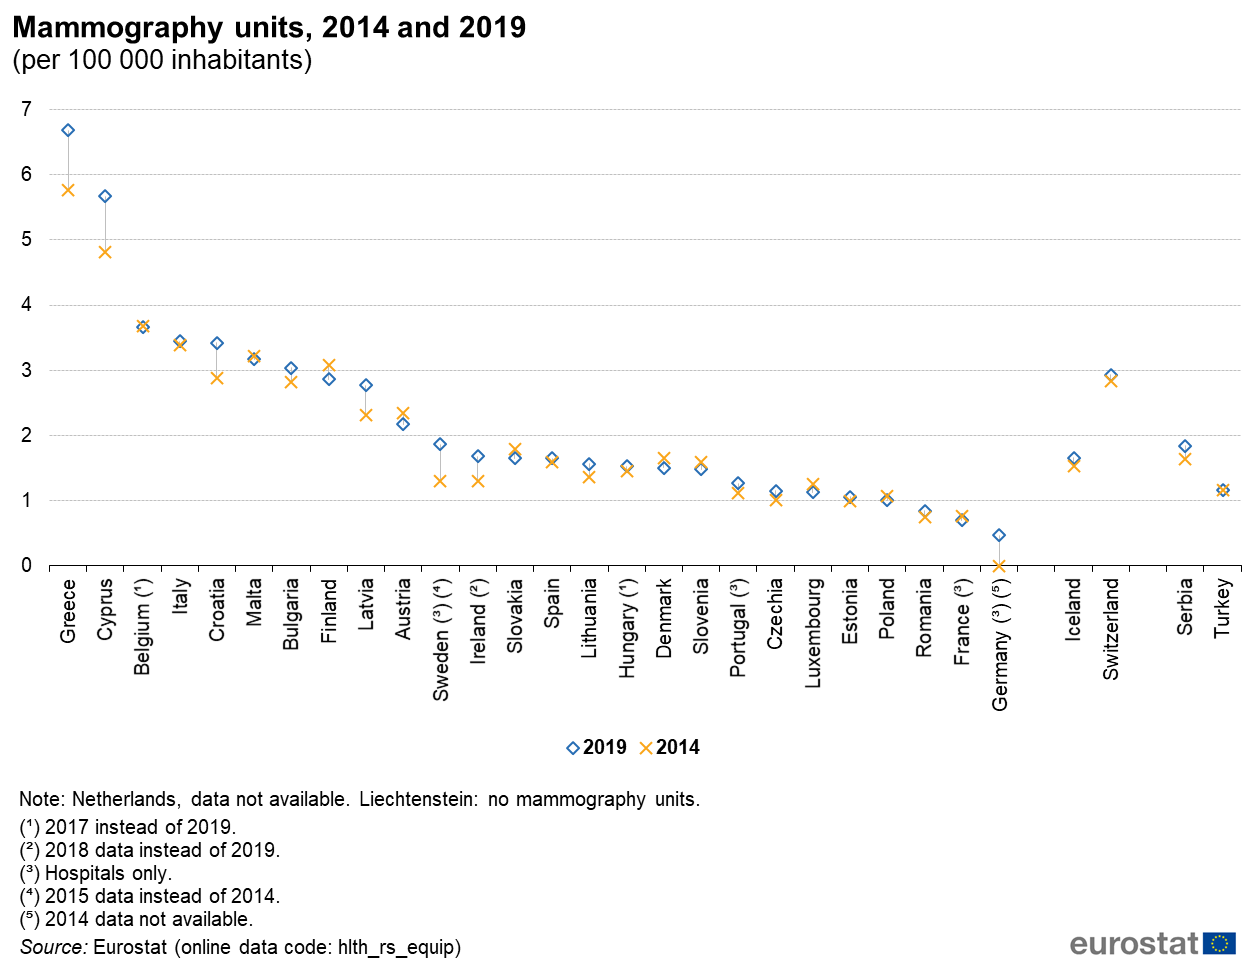
Mammography units, 2014 and 2019 (per 100 000 inhabitants).png
(
file
)
76 KB
1
19:24, 25 August 2021
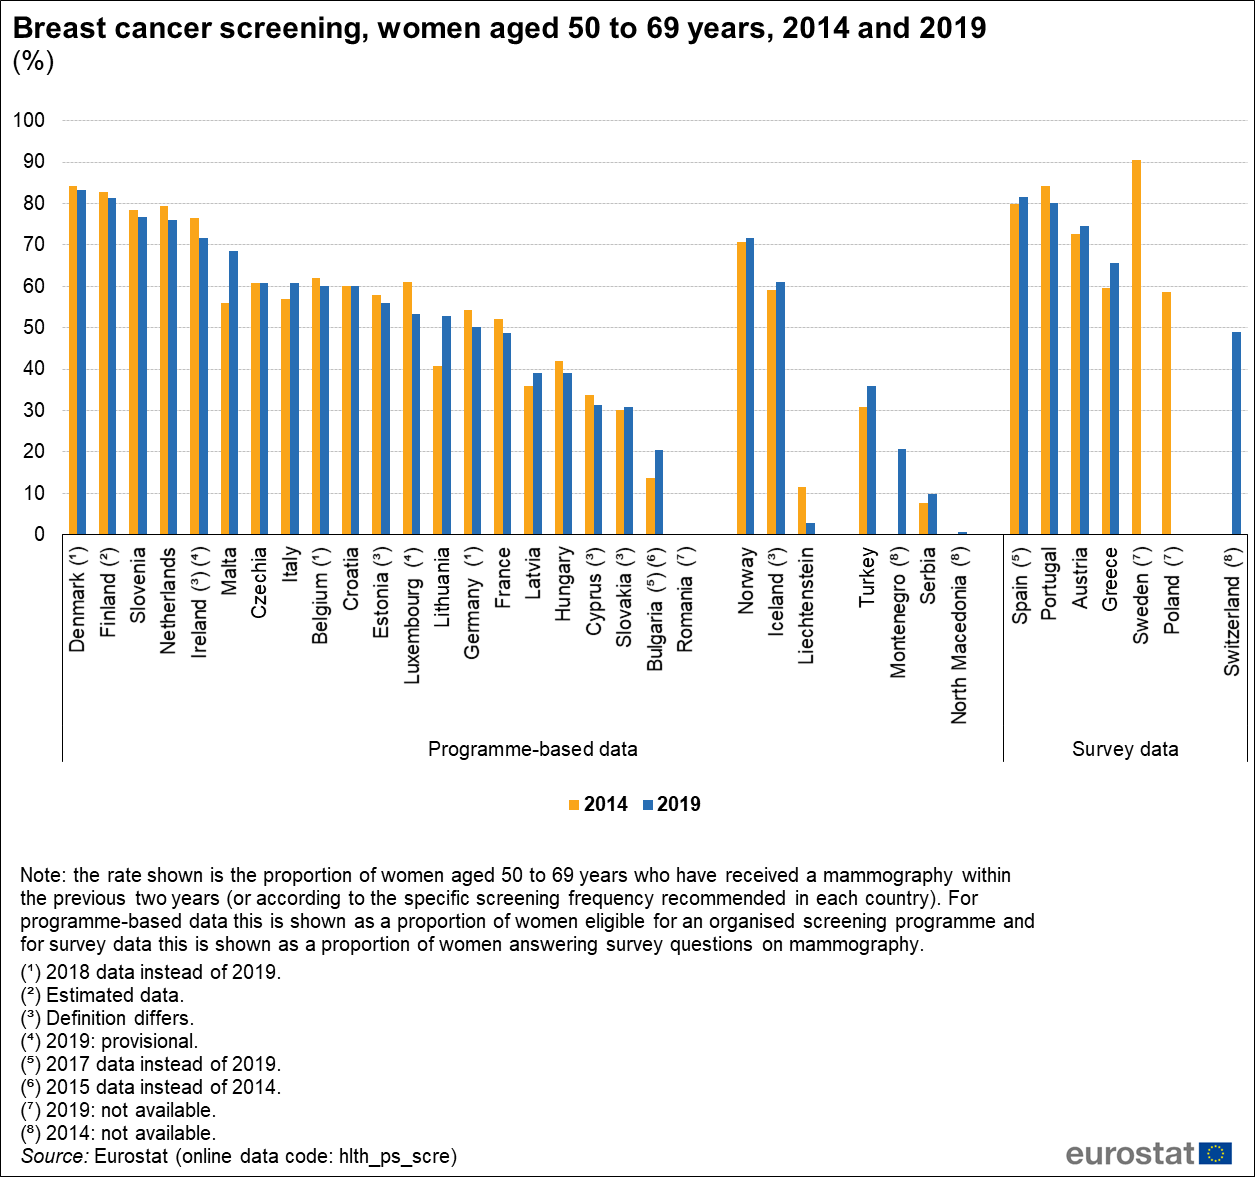
Breast cancer screening, women aged 50 to 69 years, 2014 and 2019 (%) Health20.png
(
file
)
146 KB
1
18:53, 25 August 2021
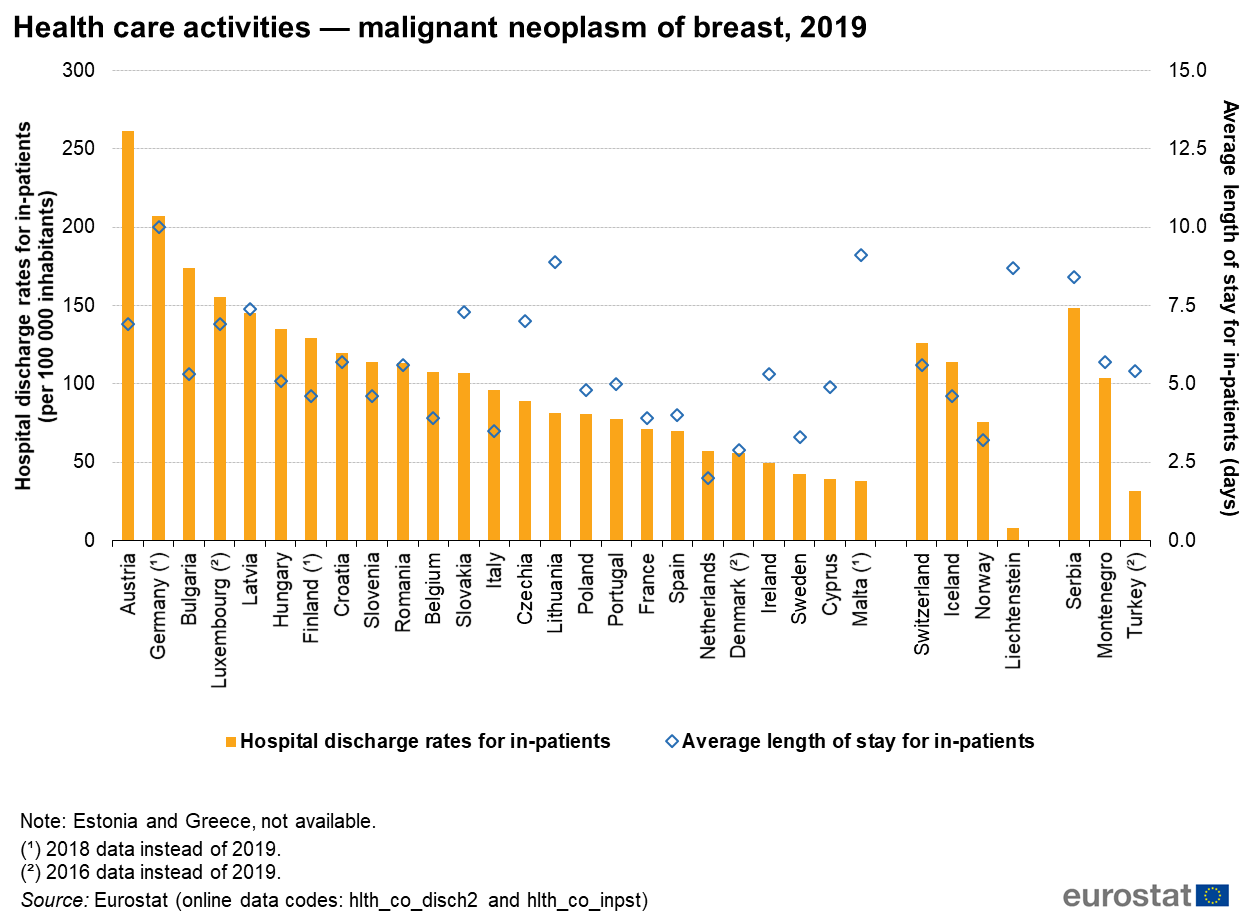
Health care activities — malignant neoplasm of breast, 2019.png
(
file
)
114 KB
1
18:53, 25 August 2021
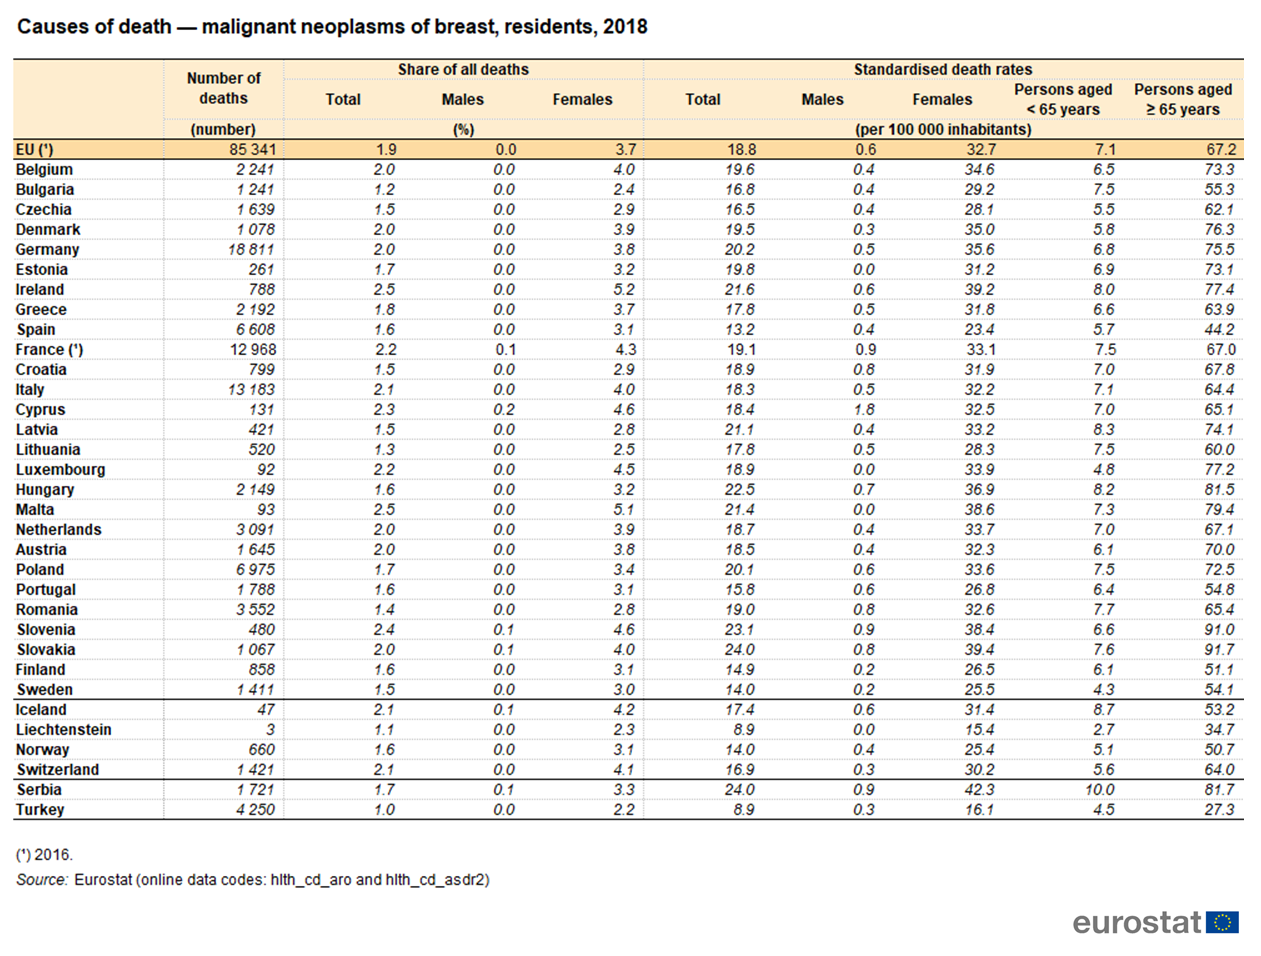
Causes of death — malignant neoplasms of breast, residents, 2018.png
(
file
)
461 KB
1
18:52, 25 August 2021
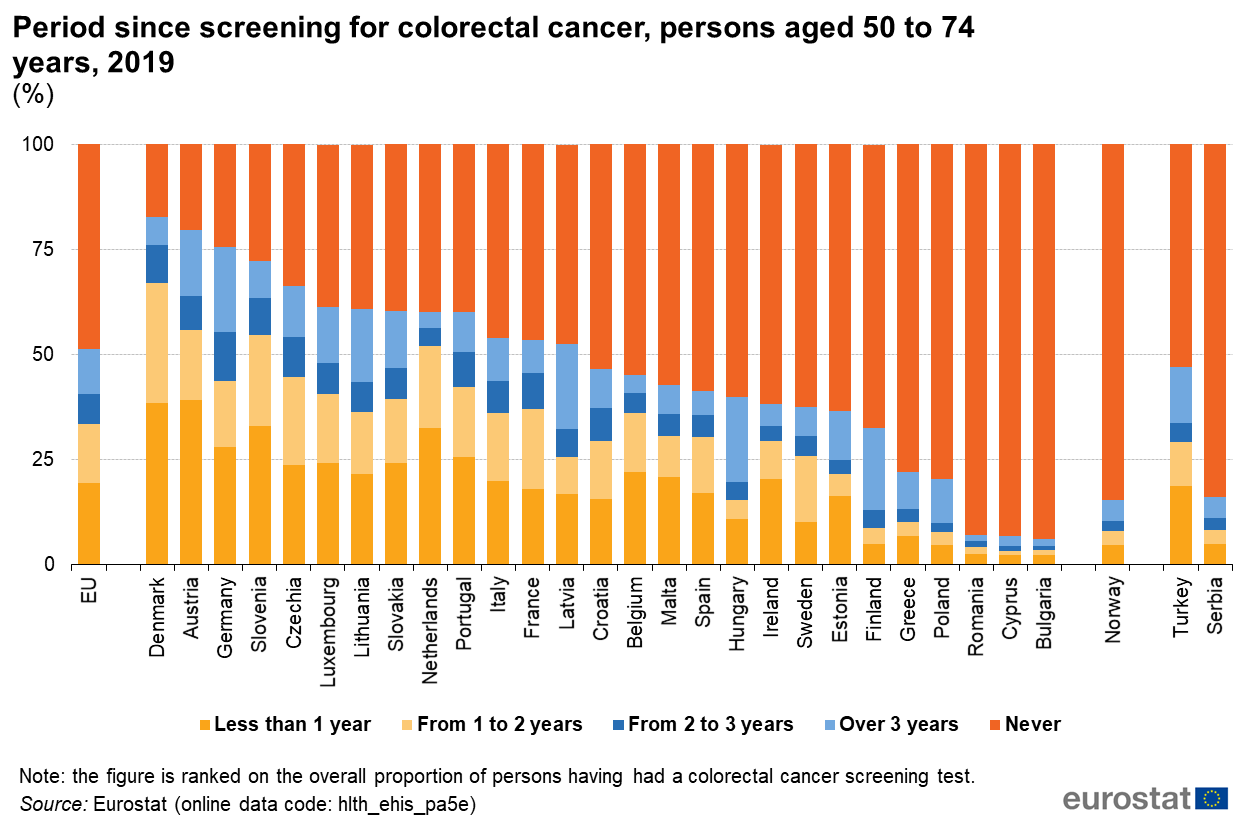
Period since screening for colorectal cancer, persons aged 50 to 74 years, 2019.png
(
file
)
107 KB
1
18:51, 25 August 2021
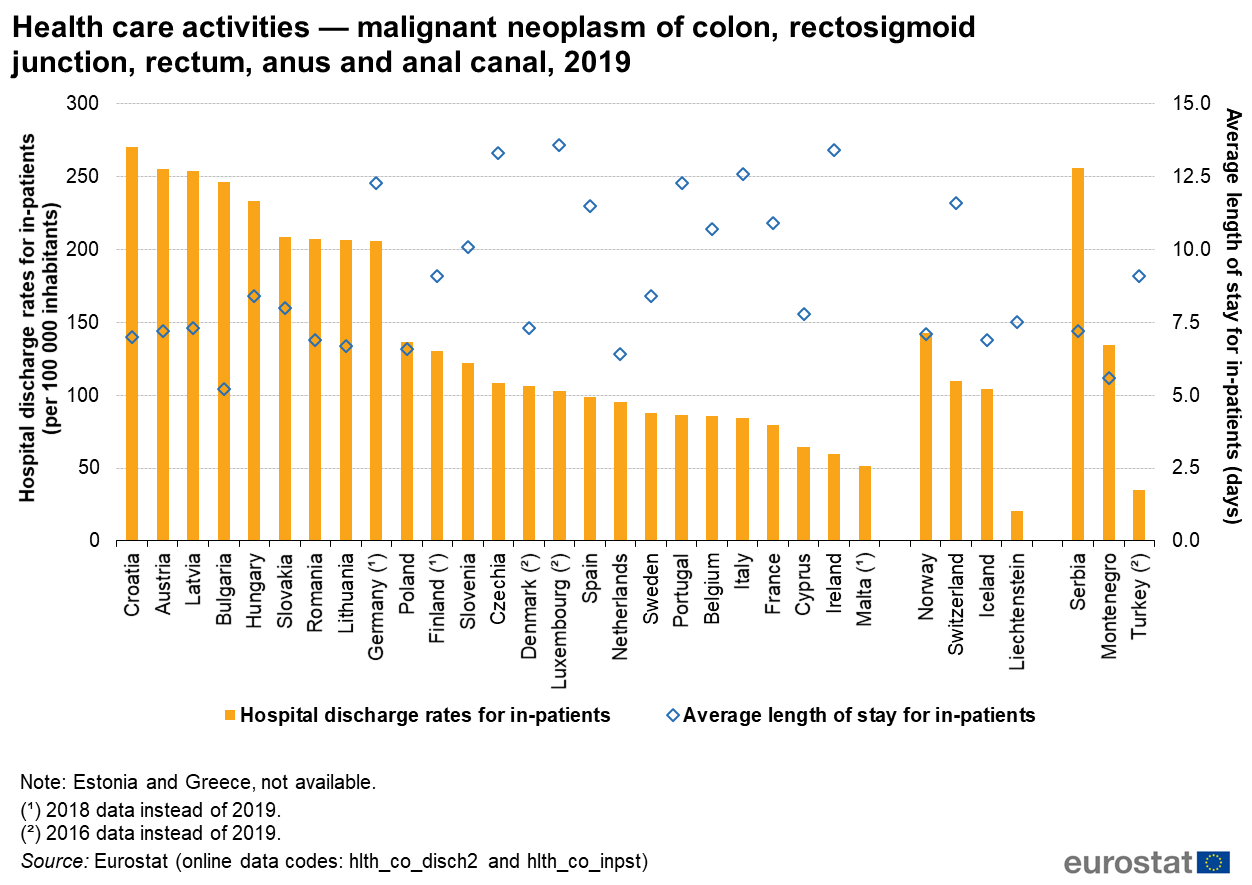
Health care activities — malignant neoplasm of colon, rectosigmoid junction, rectum, anus and anal canal, 2019.png
(
file
)
121 KB
1
18:51, 25 August 2021
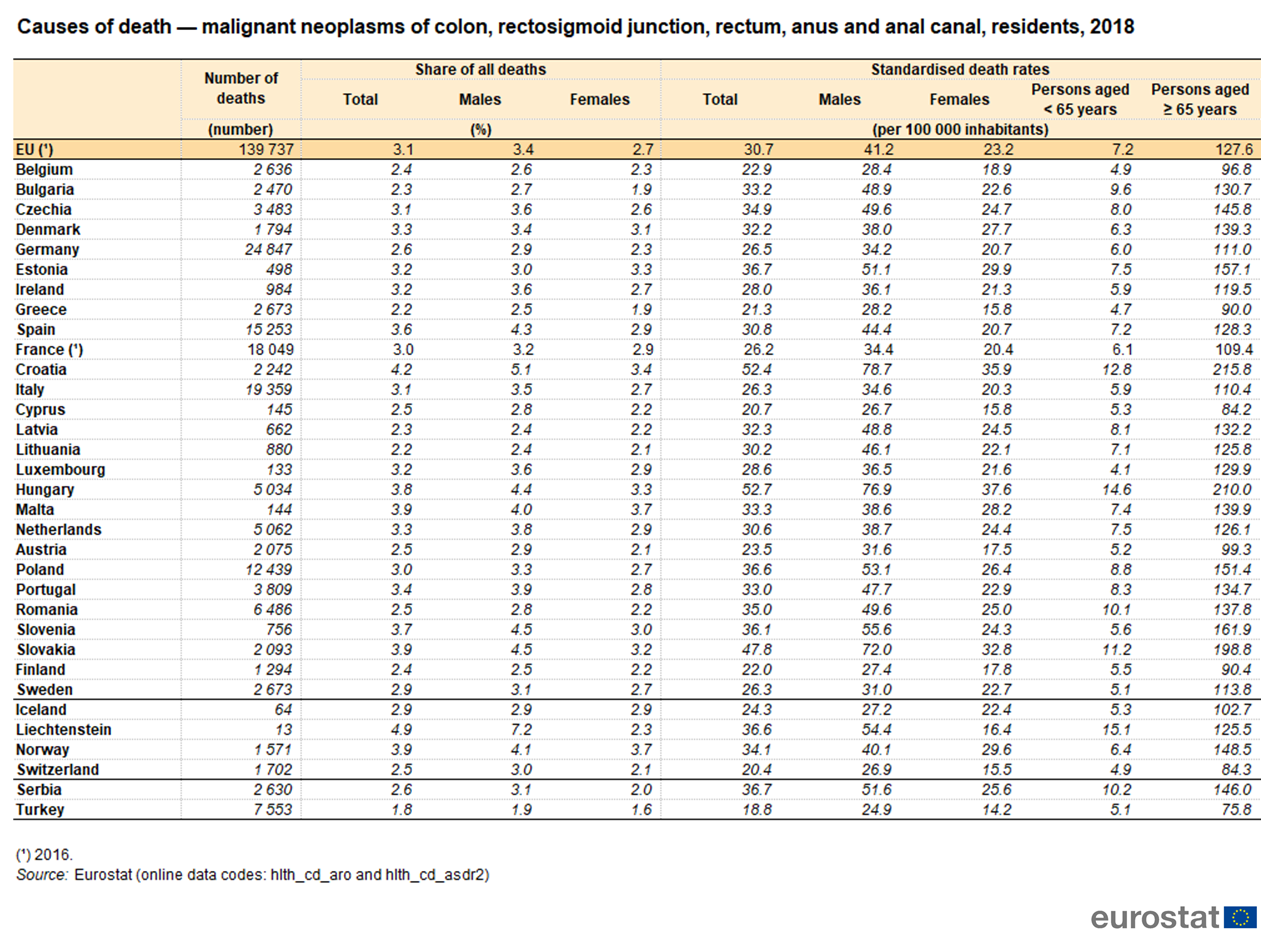
Causes of death — malignant neoplasms of colon, rectosigmoid junction, rectum, anus and anal canal, residents, 2018.png
(
file
)
507 KB
1
18:50, 25 August 2021
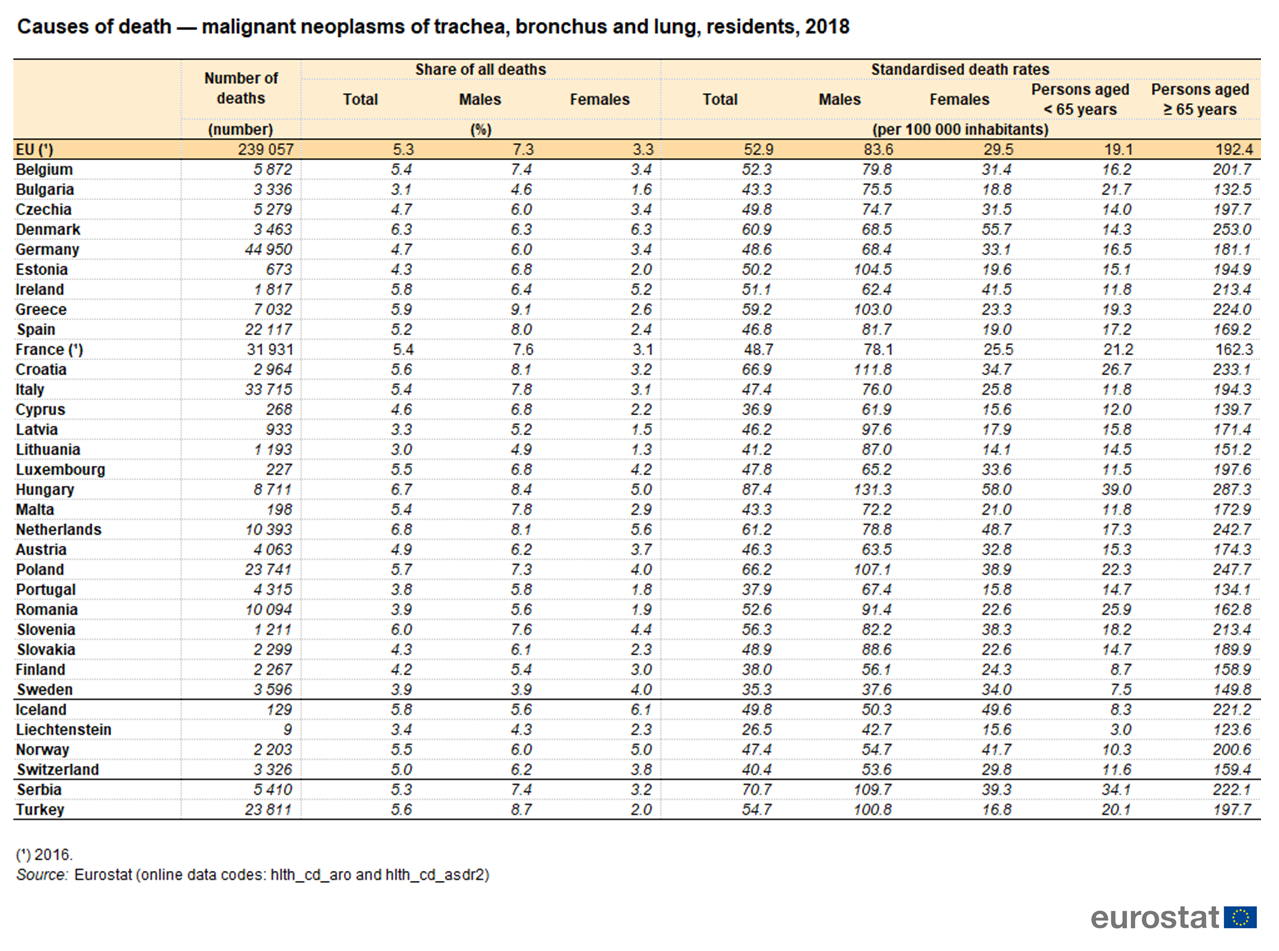
Causes of death — malignant neoplasms of trachea, bronchus and lung, residents, 2018.png
(
file
)
510 KB
1
17:44, 5 August 2021
Cardiovascular diseases Health update 2021.xlsx
(
file
)
59 KB
1
17:37, 5 August 2021
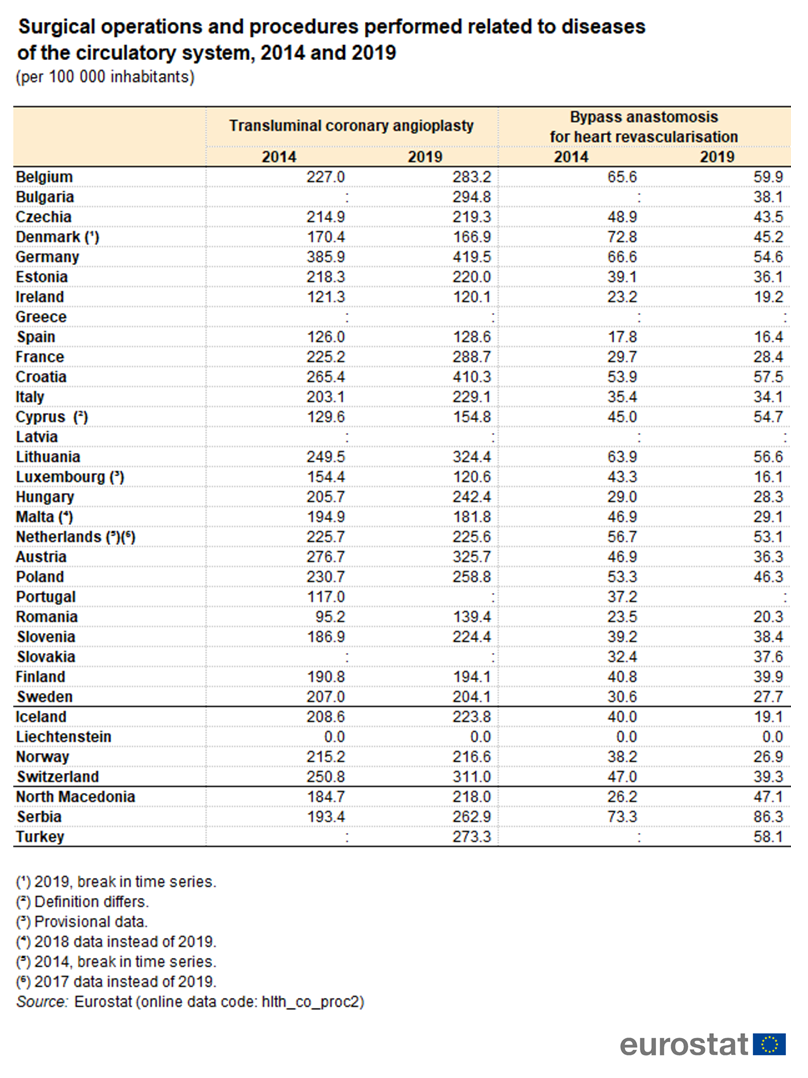
Surgical operations and procedures performed related to diseases of the circulatory system, 2014 and 2019.png
(
file
)
363 KB
1
17:36, 5 August 2021
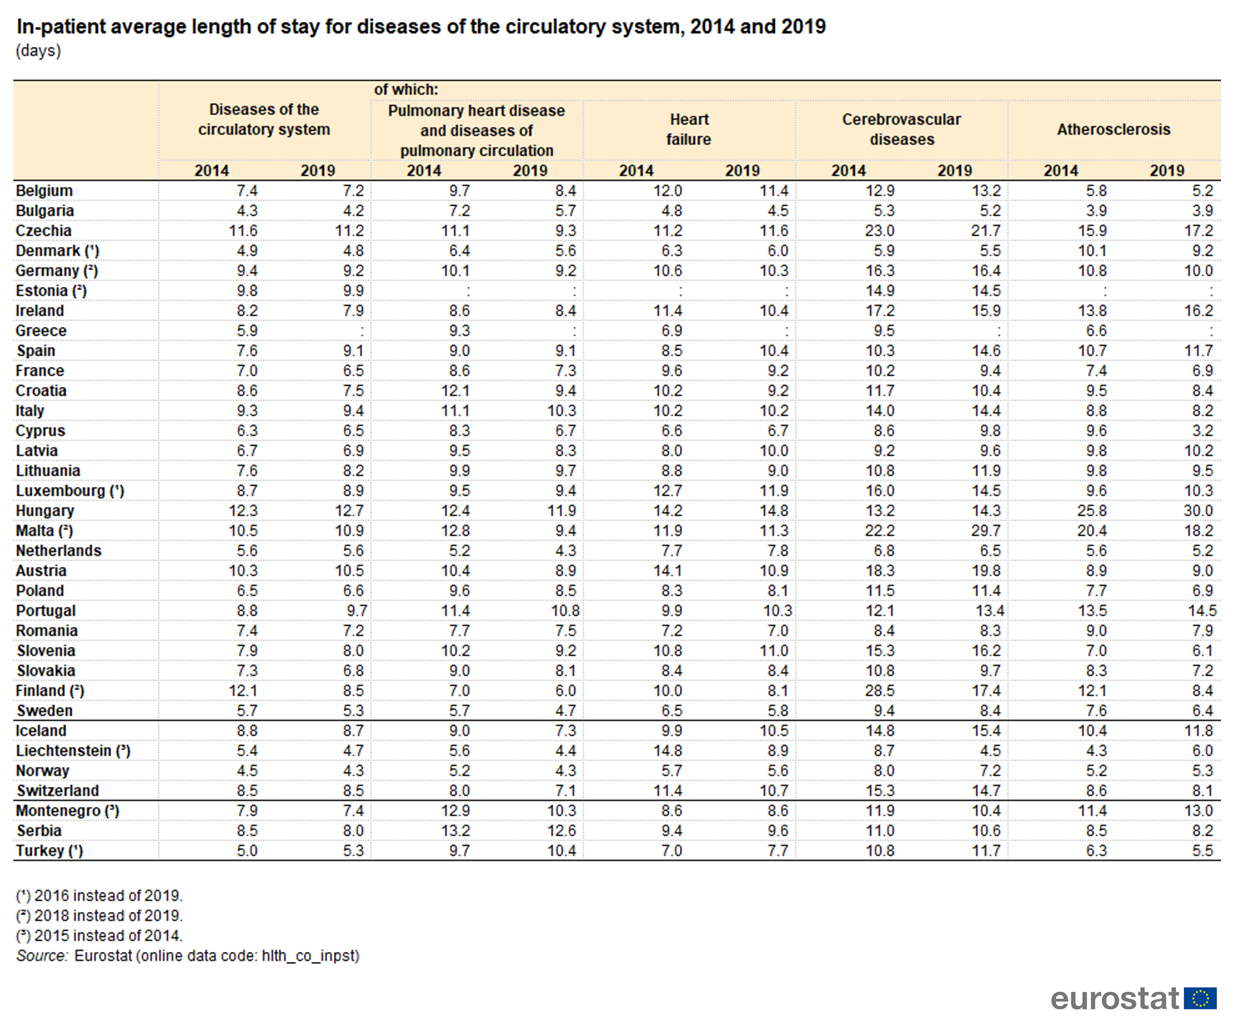
In-patient average length of stay for diseases of the circulatory system, 2014 and 2019 (days).png
(
file
)
500 KB
1
17:36, 5 August 2021
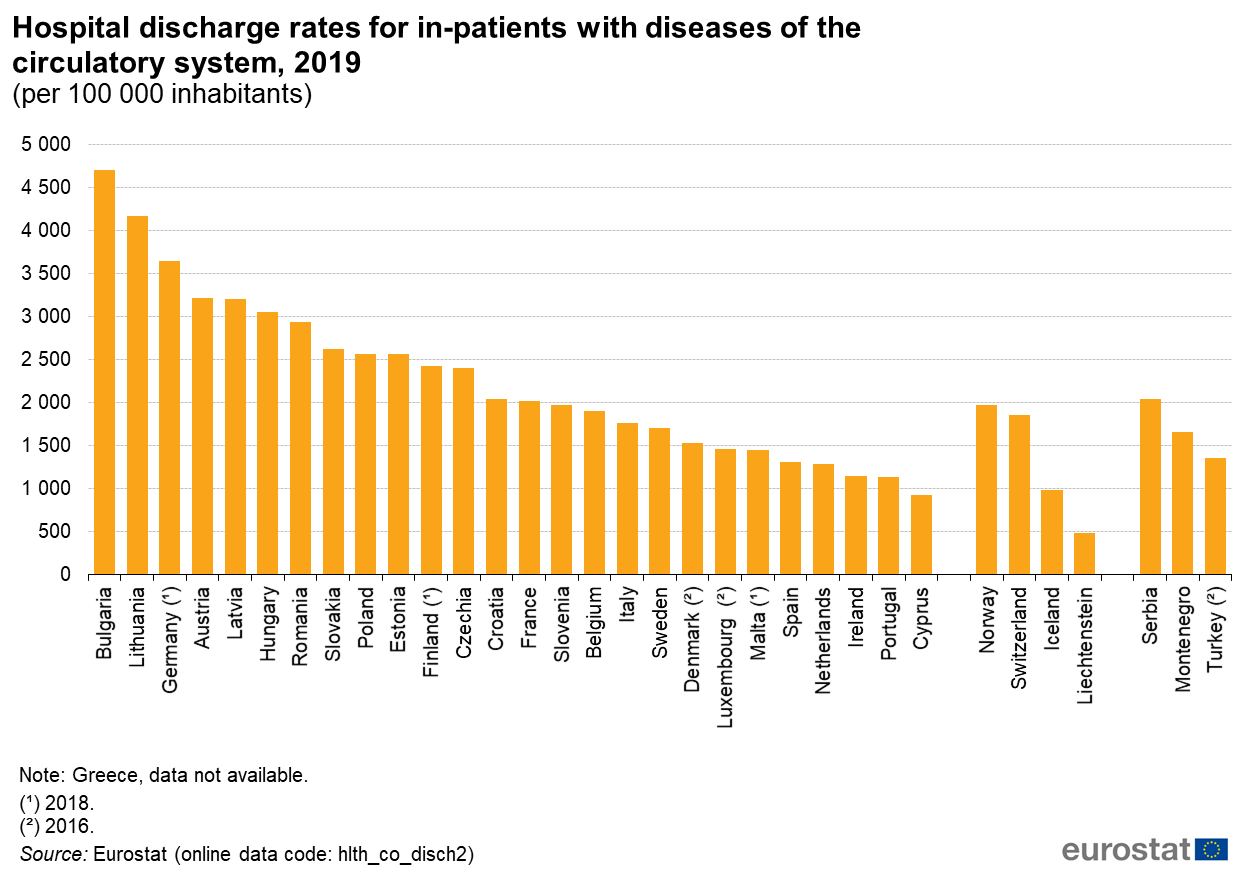
Hospital discharge rates for in-patients with diseases of the circulatory system, 2019 (per 100 000 inhabitants).png
(
file
)
88 KB
1
17:36, 5 August 2021
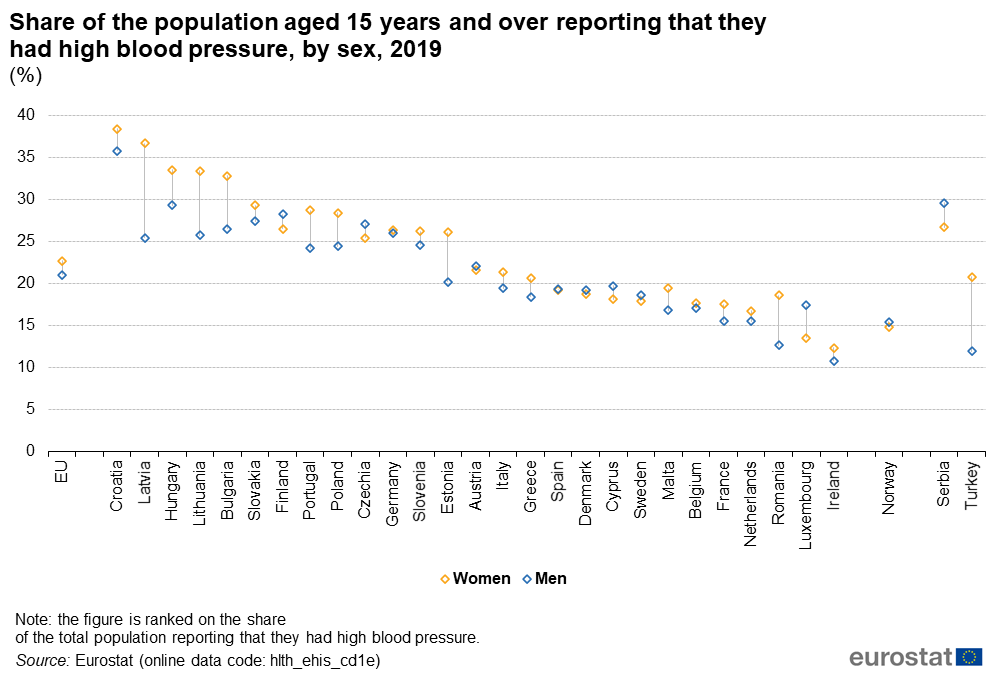
Share of the population aged 15 years and over reporting that they had high blood pressure, by sex, 2019 (%).png
(
file
)
41 KB
1
17:35, 5 August 2021
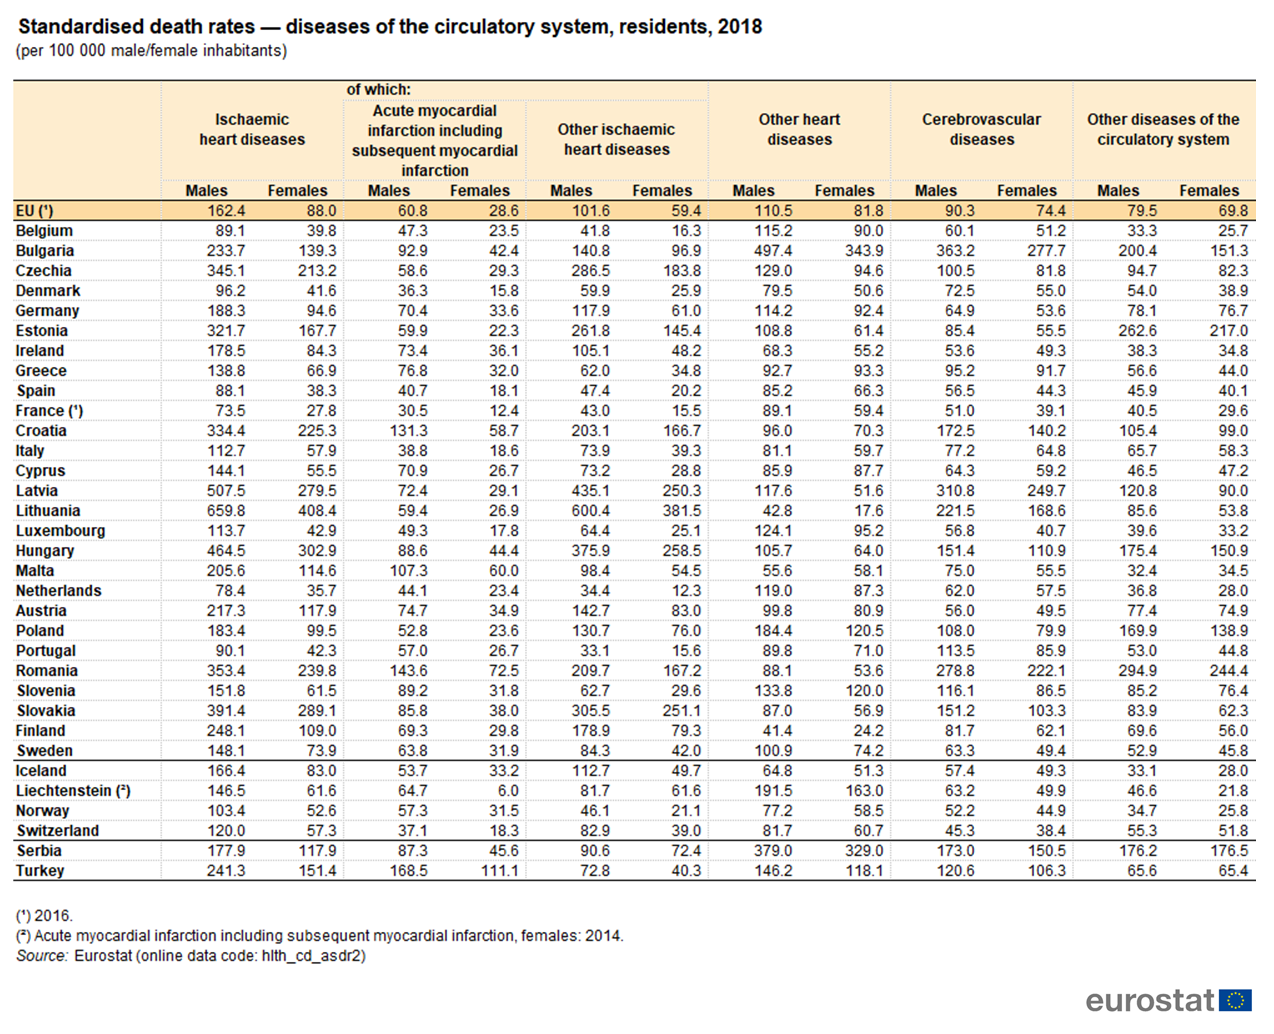
Standardised death rates — diseases of the circulatory system, residents, 2018 (per 100 000 male female inhabitants).png
(
file
)
705 KB
1
17:34, 5 August 2021
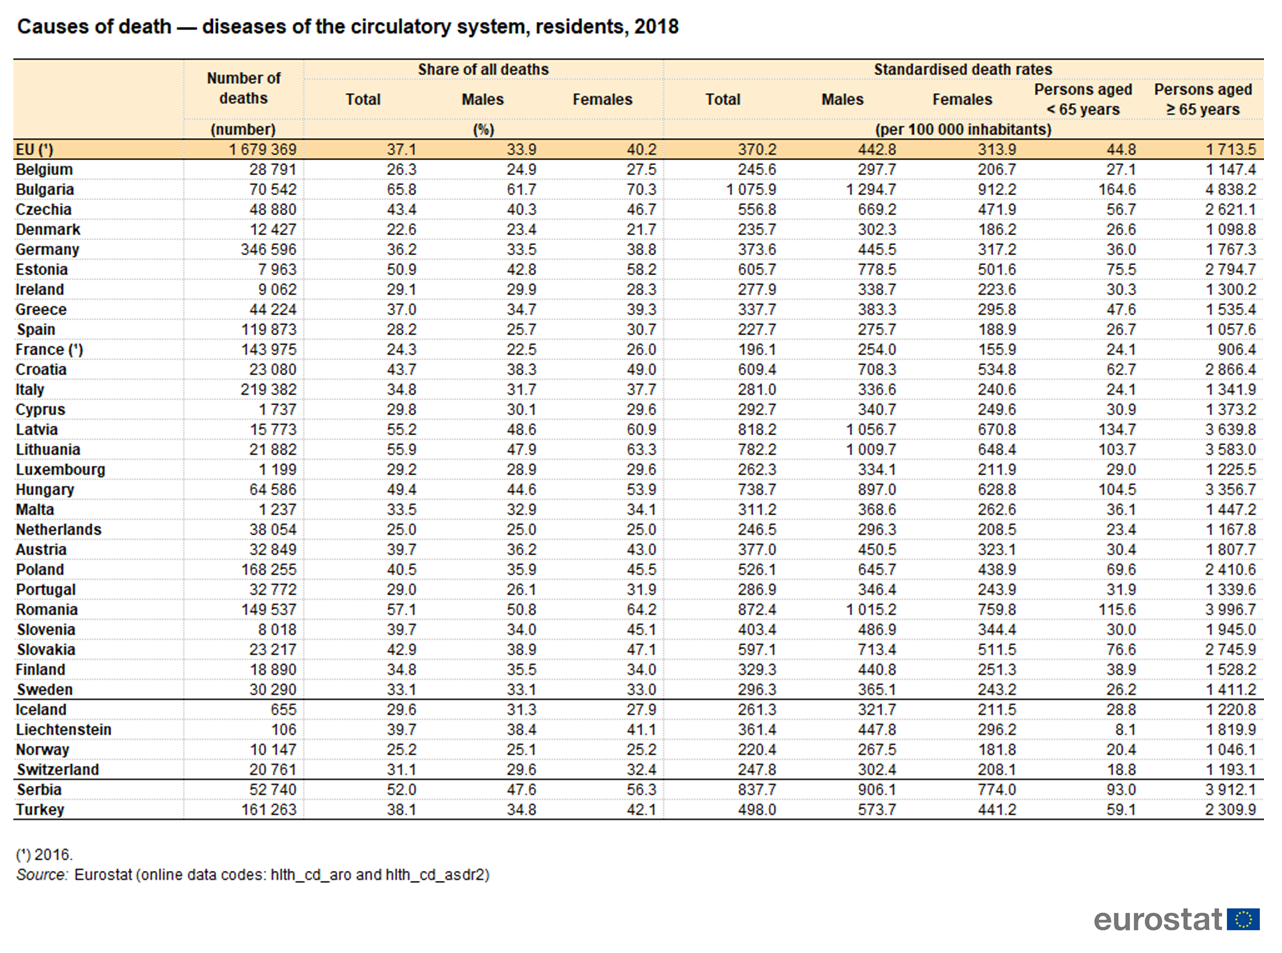
Causes of death — diseases of the circulatory system, residents, 2018.png
(
file
)
562 KB
1
14:43, 27 July 2021
Alcohol consumption statistics 2020-update v1.xlsx
(
file
)
58 KB
1
14:42, 27 July 2021
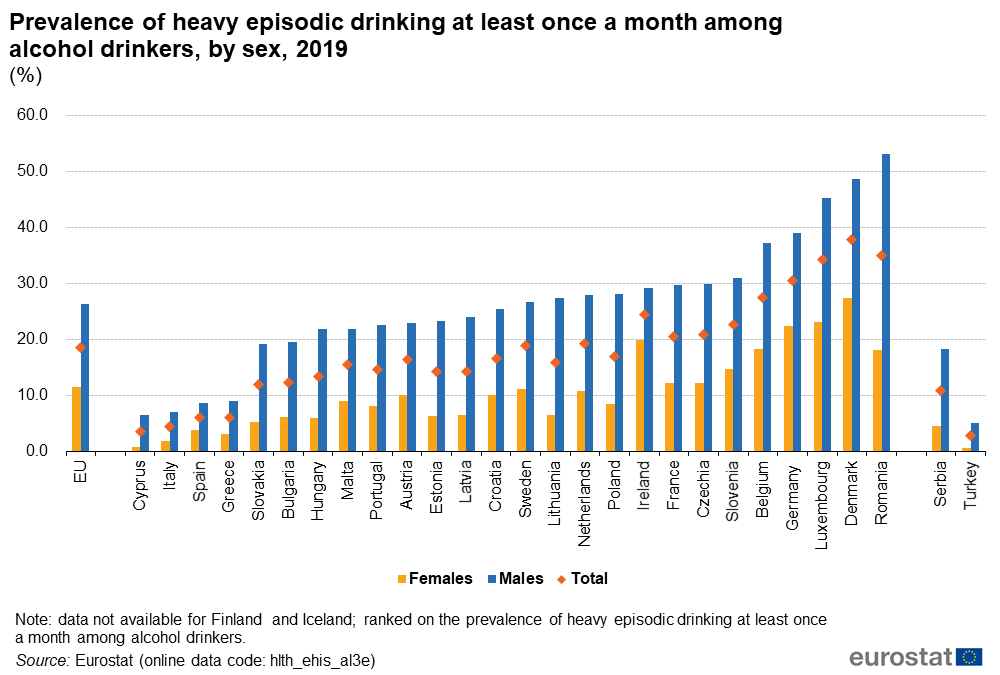
Prevalence of heavy episodic drinking at least once a month among alcohol drinkers, by sex, 2019 (%) v1.png
(
file
)
56 KB
1
13:01, 26 July 2021
Alcohol consumption statistics 2020-update.xlsx
(
file
)
58 KB
1
13:01, 26 July 2021
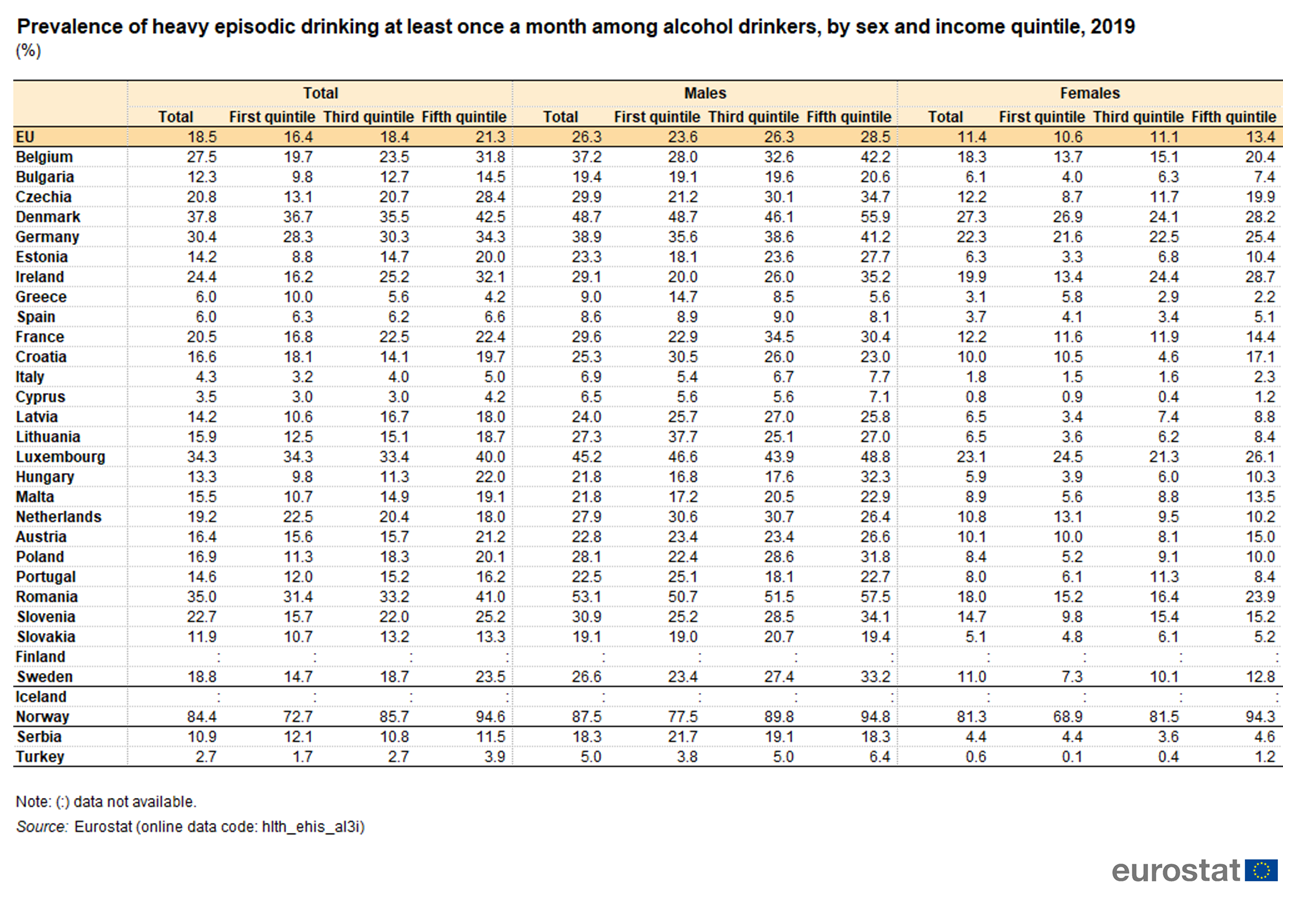
Prevalence of heavy episodic drinking at least once a month among alcohol drinkers, by sex and income quintile, 2019 (%).png
(
file
)
493 KB
1
First page
Previous page
Next page
Last page
Special page
ISSN 2443-8219
_v3.png)
_v3.png)
_v2.png)

_v3.png)

_v2.png)
_v2.png)
_v2.png)


_v1.png)

_v1.png)

_v1.png)
_v1.png)


.png)
.png)
_v2.png)


.png)
_Health20.png)


.png)
.png)
.png)
.png)

_v1.png)
.png)