Tutorials
Log in
Statistics Explained
menu
search
search
Navigation
Main page
Statistical themes
Glossary
Categories
Statistics 4 beginners
Tutorials
Help
Eurostat home
Education corner
Online publications
Regional yearbook
Sustainable development
Full list
Tools
User contributions
Logs
View user groups
Special pages
search
Navigation
Main page
Statistical themes
Glossary
Categories
Statistics 4 beginners
Tutorials
Help
Eurostat home
Education corner
Online publications
Regional yearbook
Sustainable development
Full list
Tools
User contributions
Logs
View user groups
Special pages
Navigation
Main page
Statistical themes
Glossary
Categories
Statistics 4 beginners
Tutorials
Help
Eurostat home
Education corner
Online publications
Regional yearbook
Sustainable development
Full list
Tools
User contributions
Logs
View user groups
Special pages
Uploads by Lucarca
This special page shows all uploaded files.
File list
Items per page:
20
50
100
250
500
Search for media name:
Username:
Include old versions of files
Go
First page
Previous page
Next page
Last page
Date
Name
Thumbnail
Size
Description
Versions
20:23, 23 March 2022
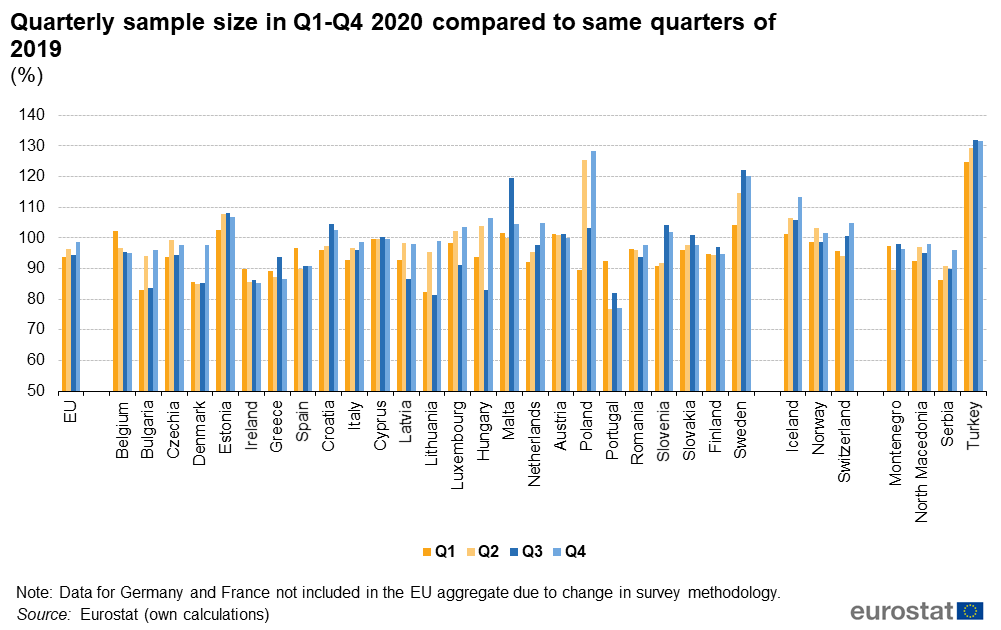
Quarterly sample size in Q1-Q4 2020 compared to same quarters of 2019 .png
(
file
)
74 KB
1
20:14, 23 March 2022
Sample size and non-response 2022 03 23 uploaded.xlsx
(
file
)
342 KB
1
20:12, 23 March 2022
Quarterly sample size in Q1-Q4 2020 compared to same quarters of 2019.png
(
file
)
74 KB
2
20:08, 23 March 2022
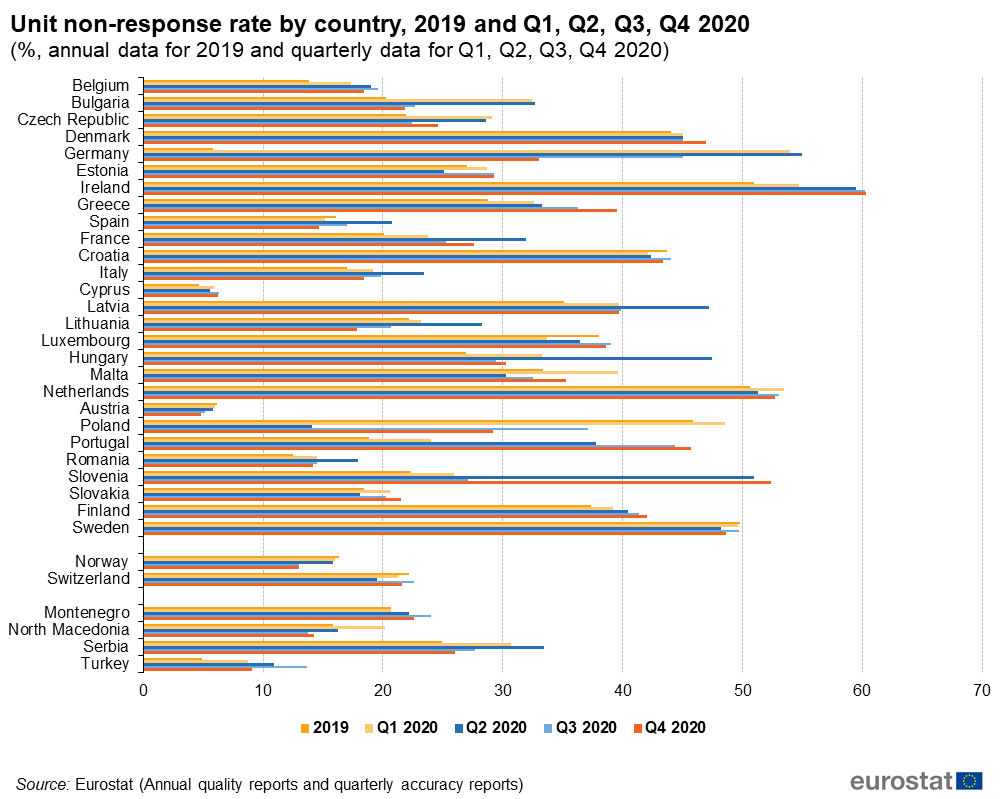
Unit non-response rate by country, 2019 and Q1, Q2, Q3, Q4 2020 .png
(
file
)
58 KB
1
15:53, 24 June 2021
Sample size and non-response 2021 06 24 uploaded.xlsx
(
file
)
342 KB
1
17:12, 17 June 2021
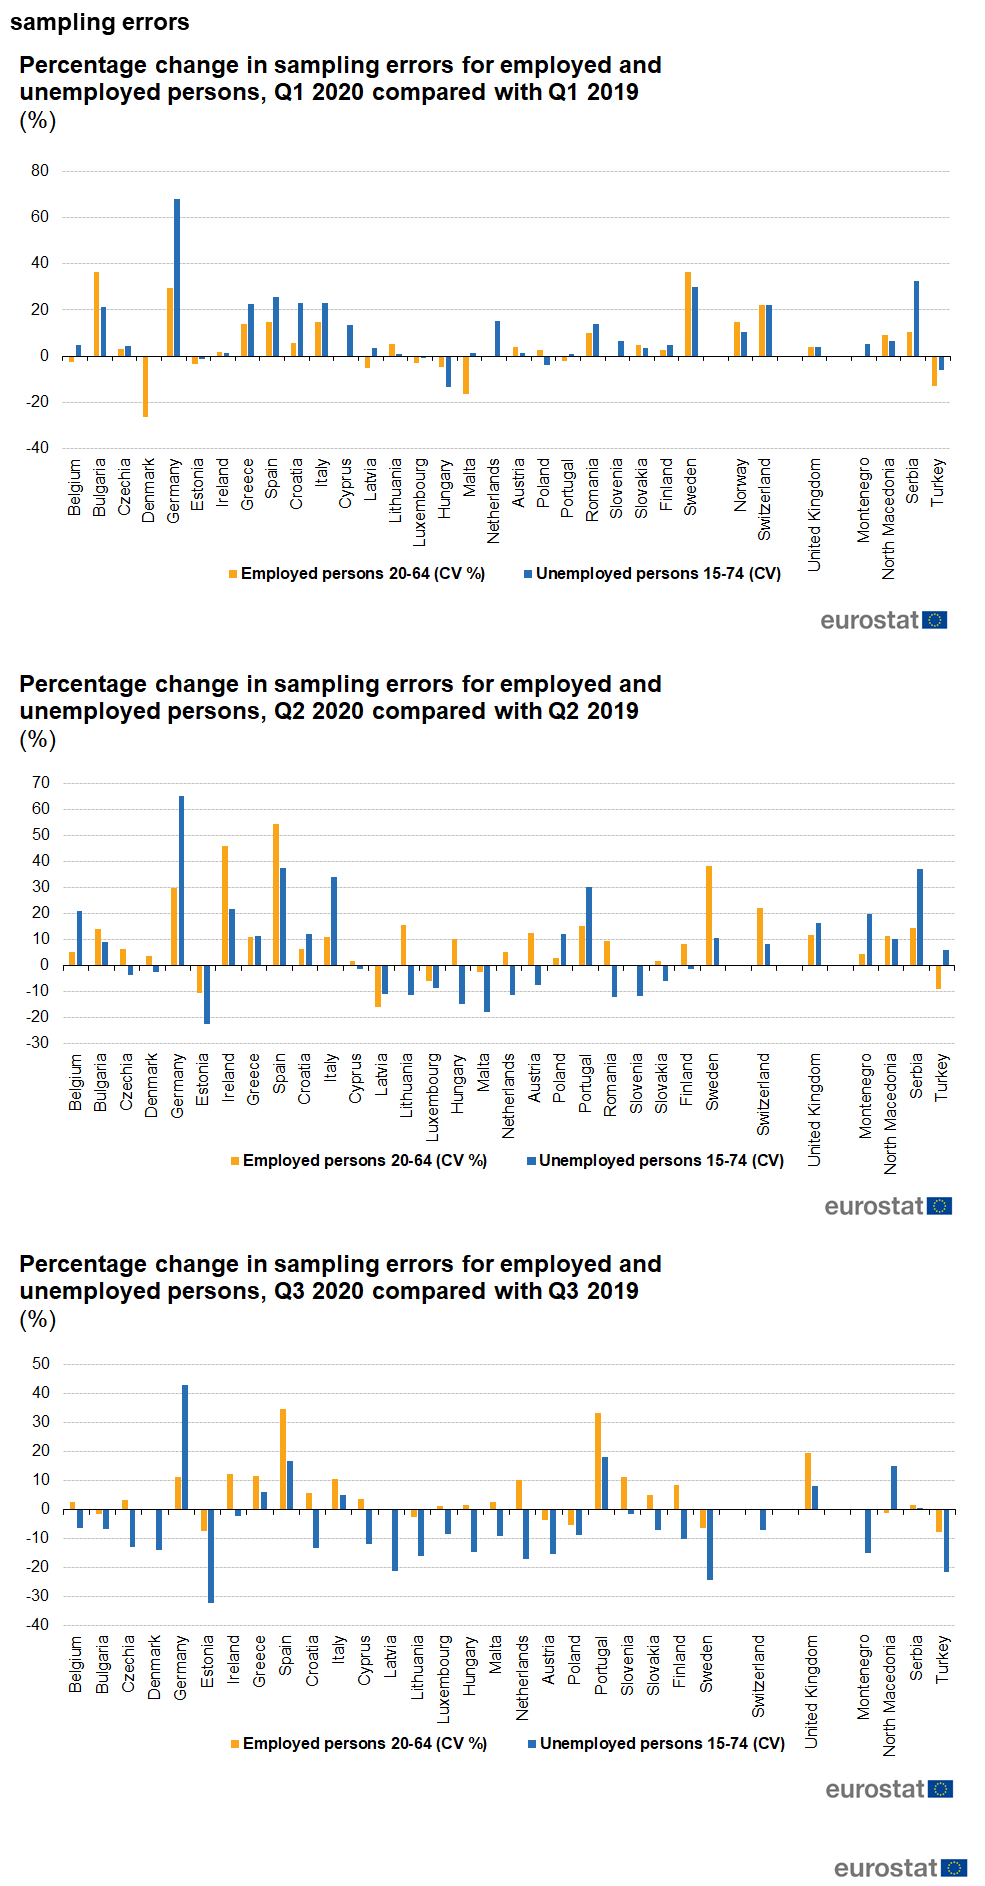
Percentage change in quarterly sampling errors for employed and unemployed persons, 2020 compared with 2019 new.png
(
file
)
214 KB
1
17:10, 17 June 2021
Percentage change in quarterly sampling errors for employed and unemployed persons, 2020 compared with 2019.png
(
file
)
214 KB
1
17:09, 17 June 2021
Data collection by mode at EU level in 2017, 2018, 2019 and Q1-Q4 2020.png
(
file
)
53 KB
1
17:07, 17 June 2021
Unit non-response rate by country, 2019 and Q1, Q2, Q3, Q4 2020.png
(
file
)
58 KB
1
17:06, 17 June 2021
Unit non-response rate at EU level and for the set of all EU-LFS participating countries, 2011-2019 and Q1,Q2, Q3, Q4 2020 .png
(
file
)
55 KB
1
19:26, 16 April 2021
Q4 Quarterly change in total actual hours worked in the main job, by country and sex, Q4 2020 compared to Q4 2019.png
(
file
)
67 KB
1
19:24, 16 April 2021
Q4 Quarterly change in total actual hours worked in the main job, by country, Q1-Q4 2020 compared to Q4 2019 .png
(
file
)
101 KB
1
19:22, 16 April 2021
Q4 Index of total actual hours worked, EU, 2006-2020.png
(
file
)
63 KB
1
19:17, 16 April 2021
Q4 EO Percentage change of average number of actual weekly hours of work in main job country and occupation, Q1-Q4 2020 compared to Q1-Q4 2019.png
(
file
)
154 KB
2
19:16, 16 April 2021
Q4 SSW Percentage change of average number of actual weekly hours of work in main job country and occupation, Q1-Q4 2020 compared to Q1-Q4 2019.png
(
file
)
181 KB
2
19:16, 16 April 2021
Q4 MANAGERS Percentage change of average number of actual weekly hours of work in main job country and occupation, Q1-Q4 2020 compared to Q1-Q4 2019.png
(
file
)
101 KB
2
19:15, 16 April 2021
Q4 SELF NS CFAM Percentage change of average number of actual weekly hours of work in main job, by country and professional status.png
(
file
)
419 KB
2
19:14, 16 April 2021
Q4 SAL SELF S Percentage change of average number of actual weekly hours of work in main job, by country and professional status, Q1-Q4 2020 compared to Q1-Q4 2019.png
(
file
)
308 KB
2
19:06, 16 April 2021
Q4 MEN Percentage change of average number of actual weekly hours of work in main job, by country and sex, Q1-Q4 2020 compared to Q1-Q4 2019.png
(
file
)
95 KB
2
19:05, 16 April 2021
Q4 TOTAL Percentage change of average number of actual weekly hours of work in main job, by country and sex, Q1-Q4 2020 compared to Q1-Q4 2019.png
(
file
)
155 KB
2
18:55, 16 April 2021
Q4 WOMEN Percentage change of average number of actual weekly hours of work in main job, by country and sex, Q1-Q4 2020 compared to Q1-Q4 2019.png
(
file
)
139 KB
1
14:07, 29 March 2021
Reliability limits.xlsx
(
file
)
128 KB
1
16:42, 26 January 2021
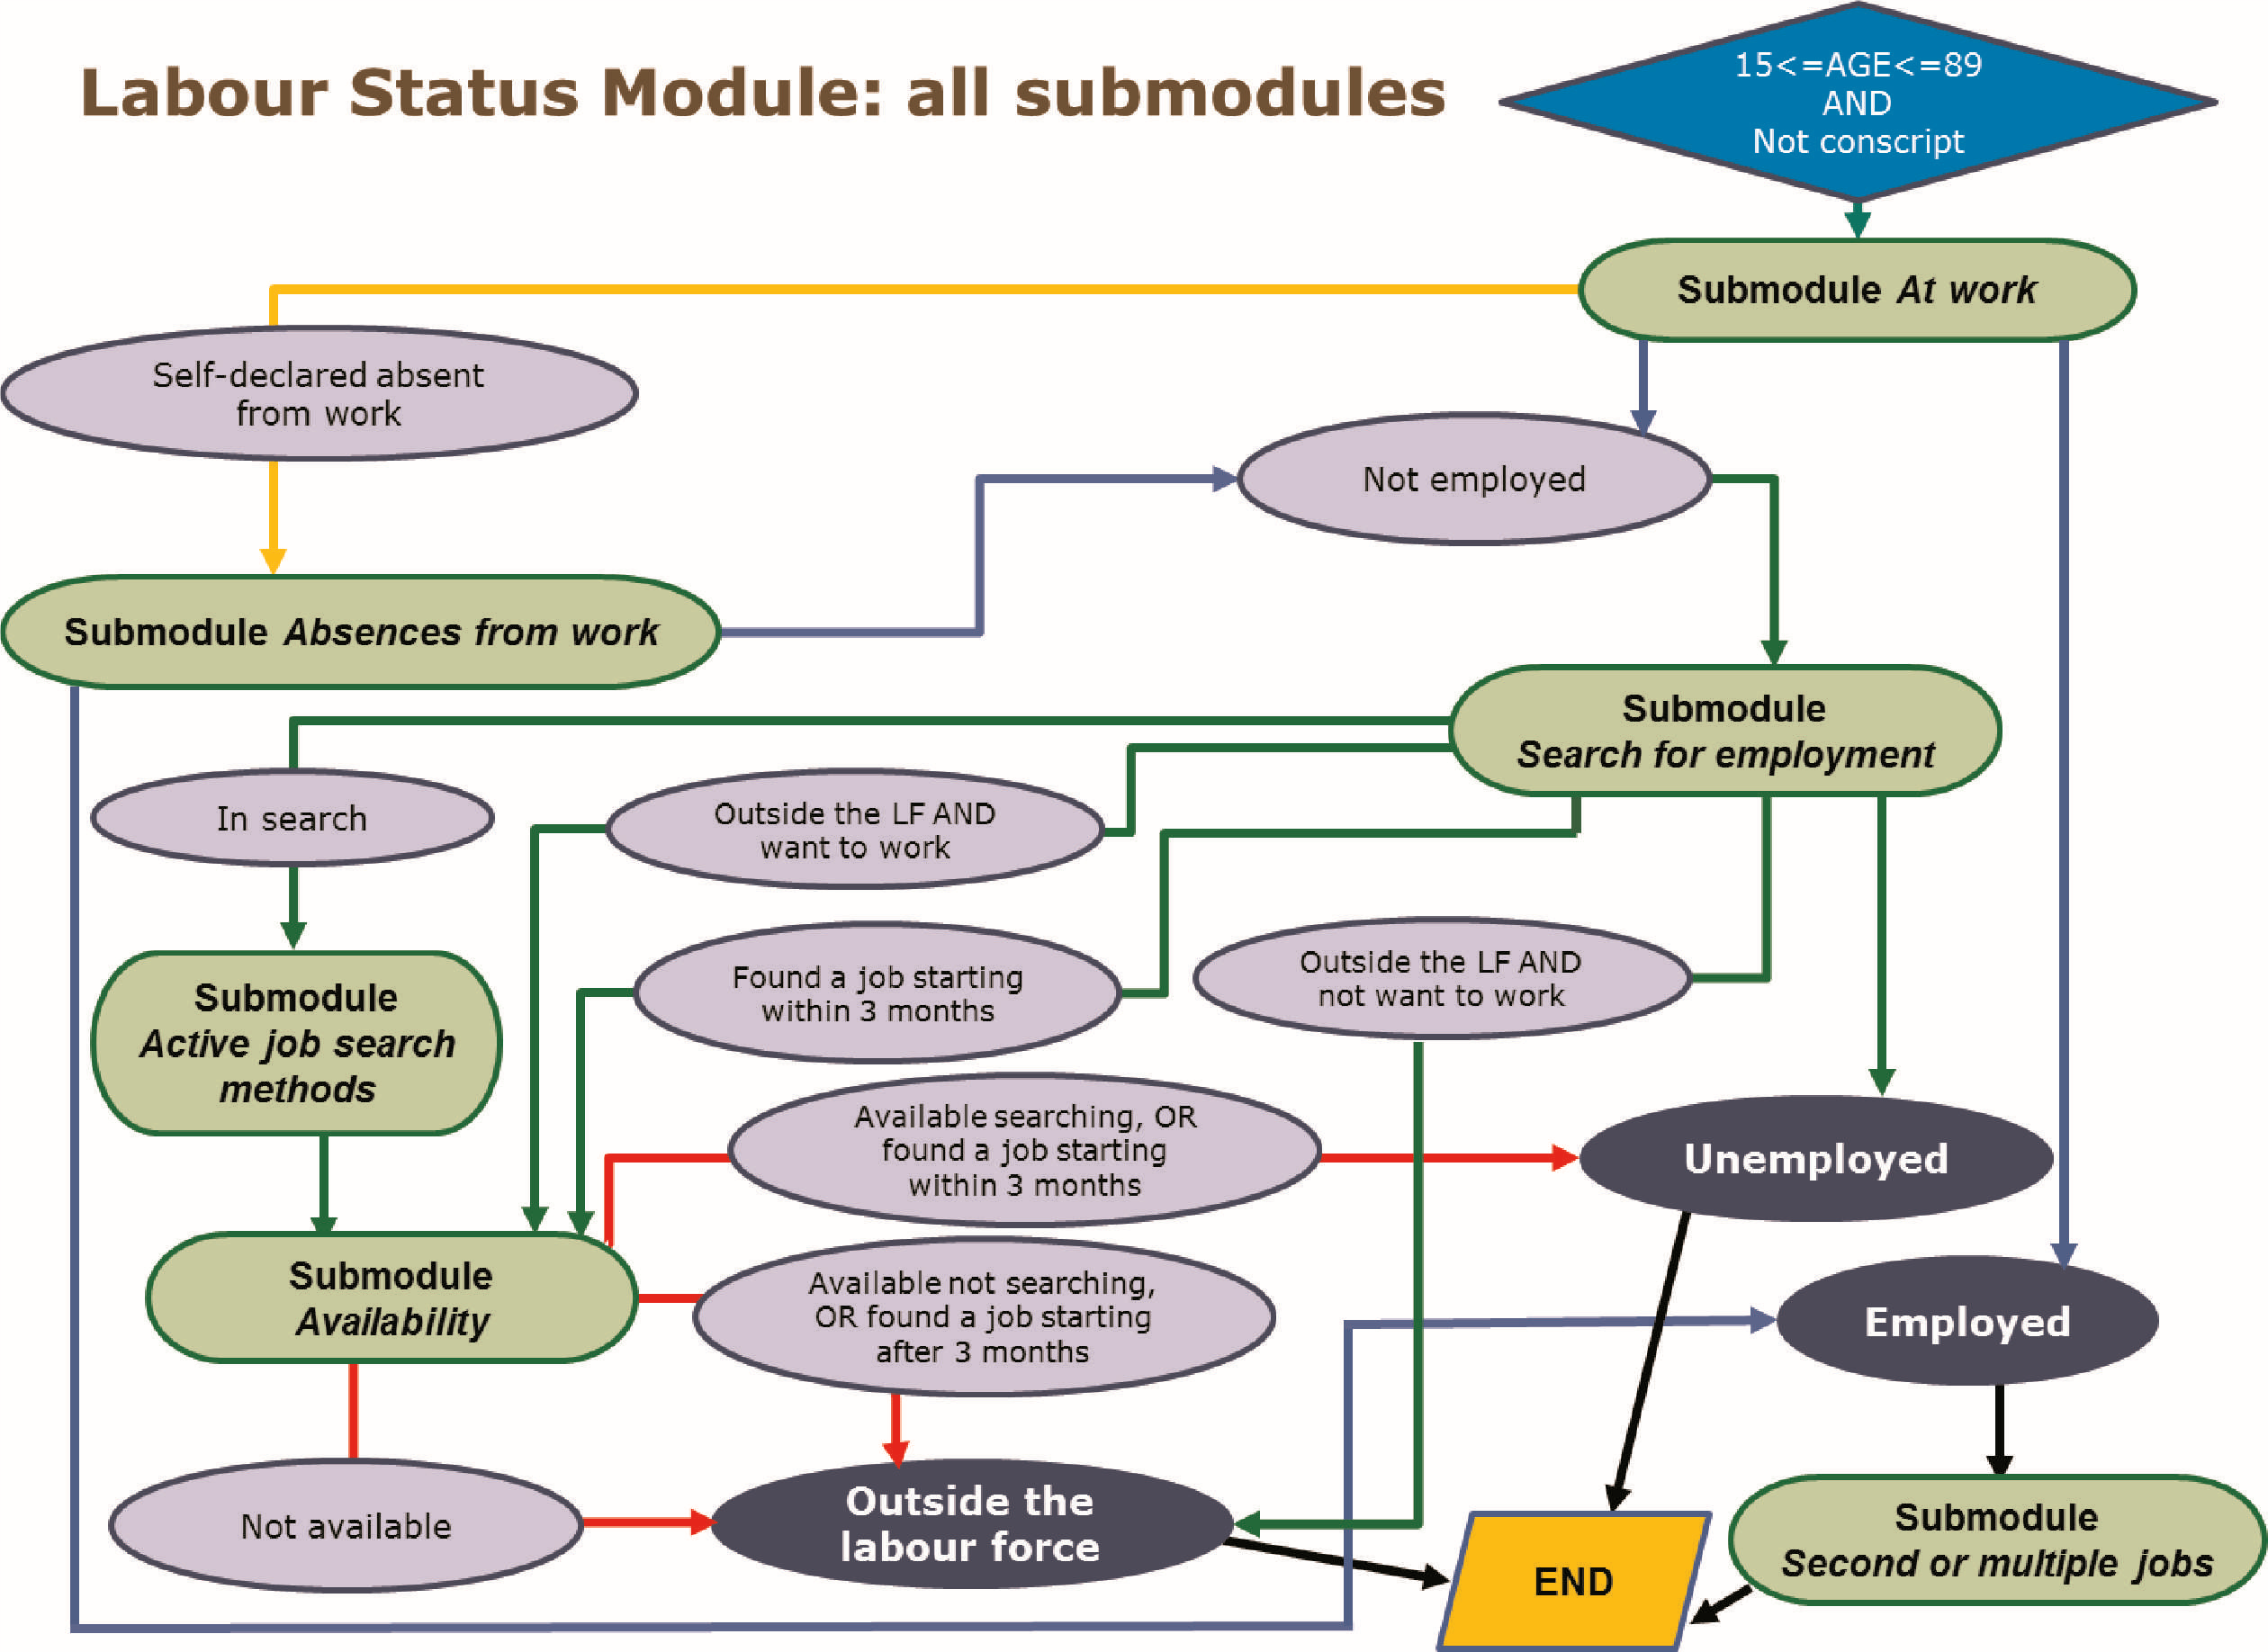
Methodology - Flowchart.png
(
file
)
1.78 MB
1
11:22, 18 January 2021
Sample size and non-response 2021 01 18.xlsx
(
file
)
268 KB
2
11:12, 18 January 2021
Percentage change in sampling errors for employed and unemployed persons by country, for Q1, Q2, Q3 2020.png
(
file
)
257 KB
1
11:08, 18 January 2021
Average weekly sample size in Q1, Q2, Q3 2020 compared to same quarters of 2019.png
(
file
)
78 KB
1
11:05, 18 January 2021
Differences in the EU sample size per week in Q1, Q2, Q3 2020 compared to the same weeks of 2019.png
(
file
)
53 KB
1
10:59, 18 January 2021
Data collection by mode at EU level in 2017, 2018, 2019 and Q1, Q2, Q3 2020.png
(
file
)
50 KB
1
10:54, 18 January 2021
Unit non-response rate by country, 2019 and Q1, Q2, Q3 2020.png
(
file
)
65 KB
3
10:50, 18 January 2021
Unit non-response rate at EU level and for the set of all EU-LFS participating countries, 2011-2019 and Q1,Q2, Q3 2020.png
(
file
)
60 KB
1
10:21, 15 January 2021
Sample size and non-response 2021 01 14.xlsx
(
file
)
302 KB
1
10:19, 15 January 2021
Sampling errors.png
(
file
)
153 KB
1
10:15, 15 January 2021
Average weekly sample size in Q1, Q2 and Q3 2020 compared to same quarters in 2019.png
(
file
)
77 KB
1
10:10, 15 January 2021
Differences in EU sample size per week in Q1, Q2, Q3 2020 compared to the same quarters of 2019.png
(
file
)
59 KB
1
10:04, 15 January 2021
Data collection by survey technique in EU in 2017, 2018, 2019 and Q1, Q2, Q3 2020.png
(
file
)
52 KB
1
22:11, 14 January 2021
Unit non-response rate at EU level and for the set of all EU-LFS participating countries, 2011-2019 and Q1, Q2, Q3 2020 .png
(
file
)
59 KB
1
11:51, 8 December 2020
Sample size and non-response v.08.12.2020.xlsx
(
file
)
87 KB
1
11:40, 8 December 2020
Distribution of the sample size by week, EU-27, Q1 2019 - Q1 2020 (Number of people) .png
(
file
)
46 KB
1
17:48, 1 October 2020
Sample size and non-response v.01.10.2020.xlsx
(
file
)
87 KB
1
17:47, 1 October 2020
Percentage change in sampling errors for employed and unemployed persons, Q1 2020 compared with Q1 2019.png
(
file
)
58 KB
1
17:45, 1 October 2020
Relative share of average weekly sample size in weeks 10-13 to weeks 1-9, Q1 2019 - Q1 2020.png
(
file
)
57 KB
1
17:42, 1 October 2020
Distribution of the sample size by week, EU-27, Q1 2019 - Q1 2020.png
(
file
)
45 KB
2
15:53, 1 October 2020
Unit non-response rate at EU level and for the set of all EU-LFS participating countries, 2011-2019 and Q1 2020.png
(
file
)
51 KB
1
11:30, 28 September 2020
Sample size and non-response.xlsx
(
file
)
86 KB
2
11:23, 28 September 2020
Annual change in sampling errors.png
(
file
)
93 KB
1
11:19, 28 September 2020
EU-LFS non-response rate by country 2.png
(
file
)
102 KB
1
11:19, 28 September 2020
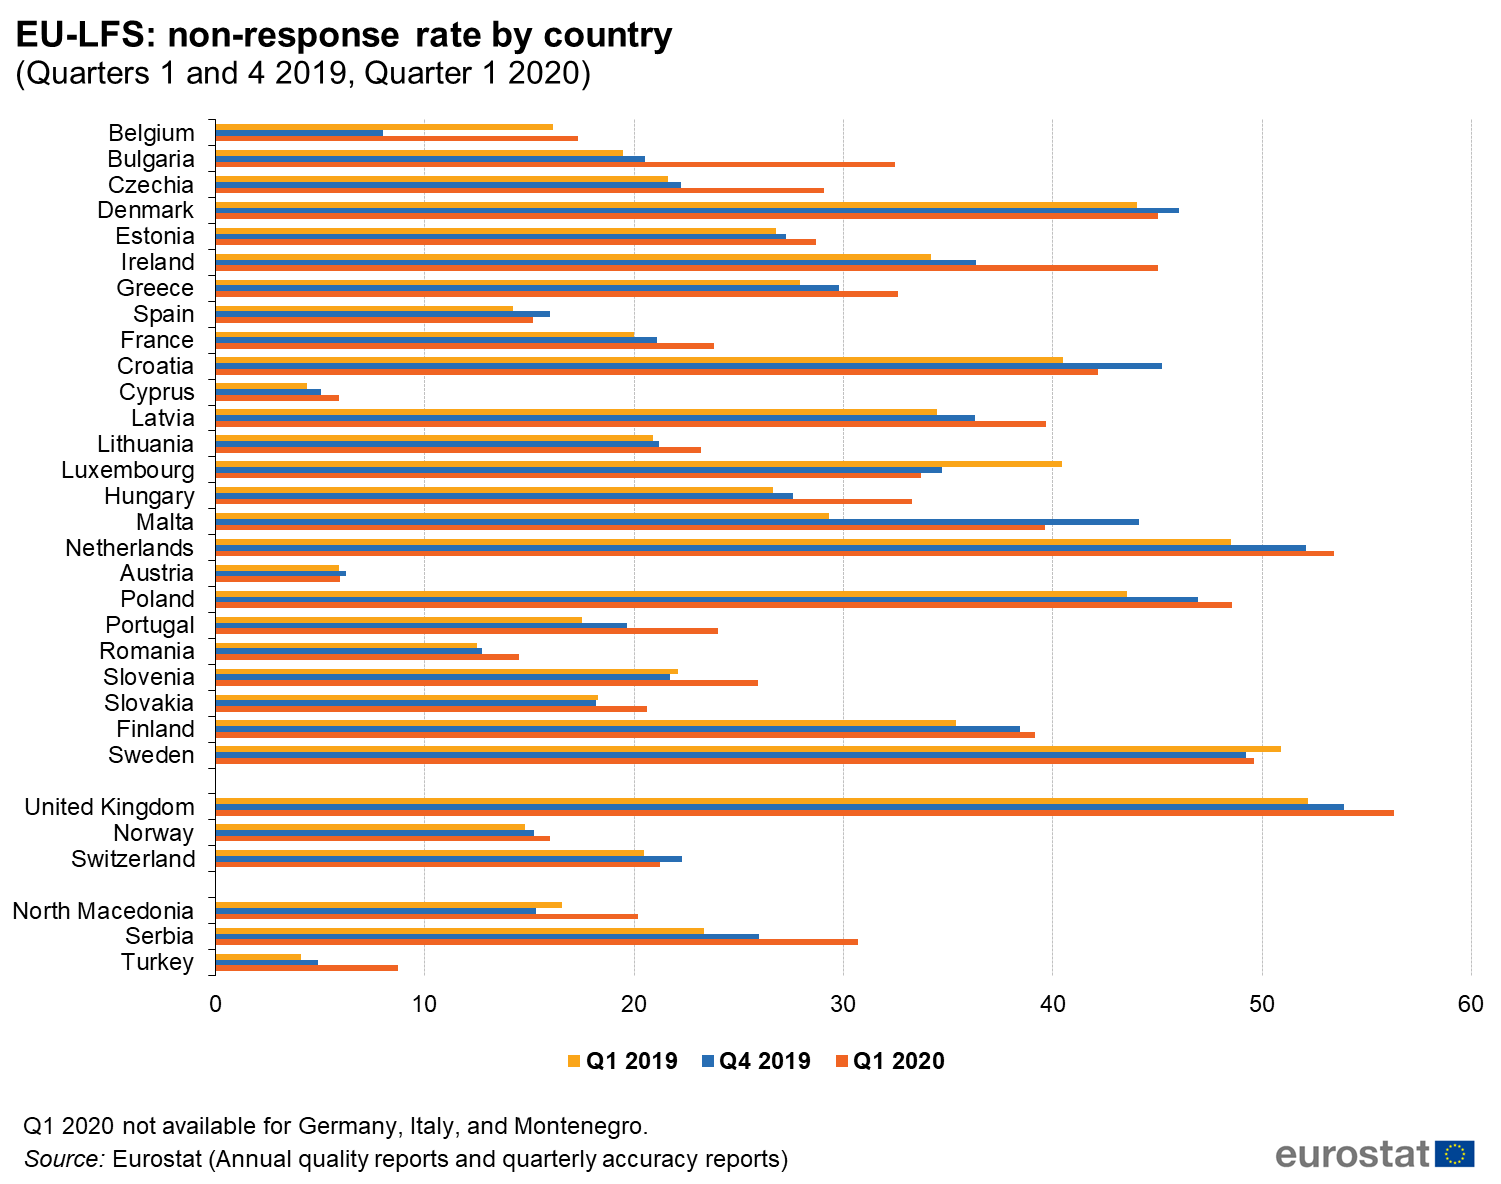
EU-LFS non-response rate by country.png
(
file
)
102 KB
4
10:00, 28 September 2020
Average weekly sample size in EU-LFS in weeks 10-13 compared to weeks 1-9 (%).png
(
file
)
154 KB
1
09:38, 28 September 2020
Distribution of the EU-27 sample size per week.png
(
file
)
74 KB
1
09:27, 28 September 2020
EU-LFS non-response rate by country .png
(
file
)
102 KB
1
First page
Previous page
Next page
Last page
Special page
ISSN 2443-8219


_.png)


.png)

