Tutorials
Log in
Statistics Explained
menu
search
search
Navigation
Main page
Statistical themes
Glossary
Categories
Statistics 4 beginners
Tutorials
Help
Eurostat home
Education corner
Online publications
Regional yearbook
Sustainable development
Full list
Tools
User contributions
Logs
View user groups
Special pages
search
Navigation
Main page
Statistical themes
Glossary
Categories
Statistics 4 beginners
Tutorials
Help
Eurostat home
Education corner
Online publications
Regional yearbook
Sustainable development
Full list
Tools
User contributions
Logs
View user groups
Special pages
Navigation
Main page
Statistical themes
Glossary
Categories
Statistics 4 beginners
Tutorials
Help
Eurostat home
Education corner
Online publications
Regional yearbook
Sustainable development
Full list
Tools
User contributions
Logs
View user groups
Special pages
Uploads by Jeantje
This special page shows all uploaded files.
File list
Items per page:
20
50
100
250
500
Search for media name:
Username:
Include old versions of files
Go
Date
Name
Thumbnail
Size
Description
Versions
14:20, 23 September 2019
FRUIT VEGETABLES 2019.xlsx
(
file
)
360 KB
Fruits and Vegetables - Tables and charts
2
13:03, 8 November 2011
Agricultural output, price indices and income.xls
(
file
)
71 KB
1
16:56, 19 October 2011
Agricultural production of crops, 2010 (1 000 tonnes).PNG
(
file
)
16 KB
2
10:57, 17 October 2011
Agricultural products 2011.xls
(
file
)
181 KB
6
10:57, 17 October 2011
Production of cereals (including rice), EU-27, 2010 (%).png
(
file
)
4 KB
1
10:56, 17 October 2011
Breakdown of production of vegetables, EU-27, 2010 (% of total, based on tonnes).png
(
file
)
4 KB
1
10:55, 17 October 2011
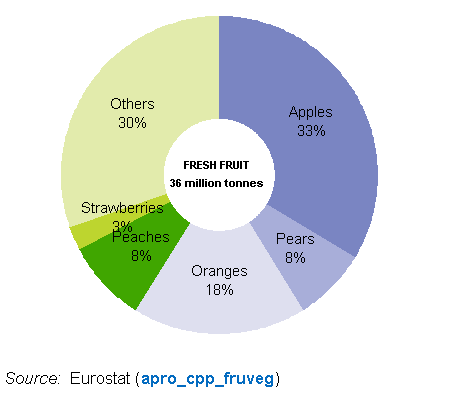
Breakdown of production of fruit, EU-27, 2010 (% of total, based on tonnes).png
(
file
)
4 KB
2
17:14, 10 October 2011
Price indices of agricultural output (nominal), EU-27 (2005=100).png
(
file
)
12 KB
3
12:07, 3 October 2011
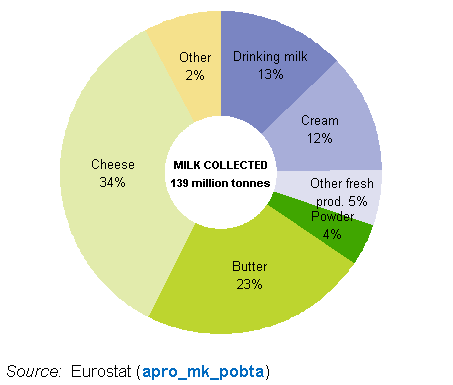
Utilization of milk, EU-27, 2010 (%).png
(
file
)
5 KB
1
13:27, 29 September 2011
Yearbook 2011 agrimonetary statistics.xls
(
file
)
131 KB
1
13:26, 29 September 2011
Index of income from agricultural activity (indicator A) (2005=100).png
(
file
)
19 KB
3
13:26, 29 September 2011
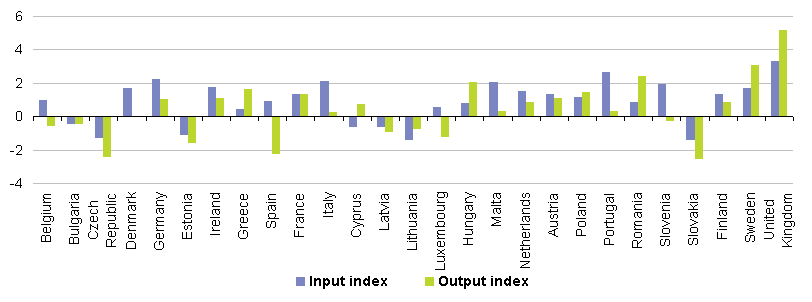
Annual evolution of deflated price indices of agricultural output and input, 2005-10 (%).png
(
file
)
5 KB
1
13:25, 29 September 2011
Agricultural output and value added at producer prices (EUR million).png
(
file
)
22 KB
2
13:25, 29 September 2011
Agricultural output and gross value added (nominal), EU-27 (2005=100).png
(
file
)
5 KB
2
12:41, 29 September 2011
Fishery statistics 2011.xls
(
file
)
71 KB
5
12:40, 29 September 2011
Fishing fleet, 2010 (1 000 kW, 1 000 GT).png
(
file
)
6 KB
2
12:40, 29 September 2011
Catches by fishing region, EU-27, 2009 (% based on tonnes).png
(
file
)
4 KB
3
12:37, 29 September 2011
Total aquaculture production (1 000 tonnes live weight).png
(
file
)
14 KB
1
12:37, 29 September 2011
Total catches in all fishing regions (1 000 tonnes live weight).png
(
file
)
18 KB
3
12:13, 29 September 2011
Total catches in all fishing regions (1 000 tonnes live weight), 2000-2009.png
(
file
)
22 KB
1
12:12, 29 September 2011
Total aquaculture production (1 000 tonnes live weight), 2000-2009.png
(
file
)
18 KB
1
16:59, 14 October 2010
Yearbook 2010 animals statistics.xls
(
file
)
56 KB
3
16:20, 14 October 2010
Utilization of milk, EU-27, 2009 (%).png
(
file
)
512 KB
1
16:03, 30 September 2010
Total aquaculture production (1 000 tonnes live weight), 1999-2008.png
(
file
)
1.7 MB
2
15:56, 30 September 2010
Catches by fishing region, EU-27, 2008 (% based on tonnes).png
(
file
)
521 KB
2
15:52, 30 September 2010
Fishing fleet, 2008 (1 000 kW, 1 000 GT).png
(
file
)
994 KB
1
15:48, 30 September 2010
Yearbook 2010 fishery statistics.xls
(
file
)
87 KB
1
15:41, 30 September 2010
Total catches in all fishing regions (1 000 tonnes live weight), 1999-2008.png
(
file
)
1.98 MB
1
15:40, 30 September 2010
Fishing fleet, 2009 (1 000 kW, 1 000 GT).png
(
file
)
994 KB
1
12:00, 30 September 2010
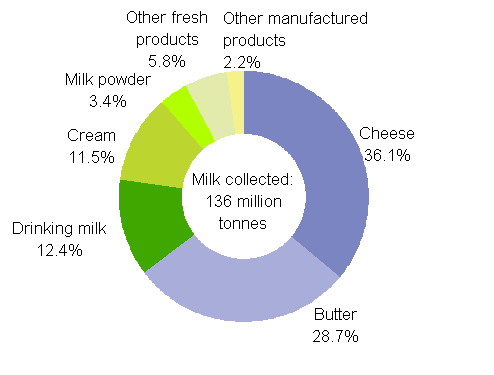
Utilization of milk, EU-27, 2008 (%).png
(
file
)
499 KB
1
11:46, 30 September 2010
Yearbook 2010 crops statistics.xls
(
file
)
90 KB
1
11:24, 30 September 2010
Production of cereals (including rice), EU-27, 2009 (%).png
(
file
)
506 KB
1
11:24, 30 September 2010
Breakdown of production of vegetables, EU-27, 2009 (% of total, based on tonnes).png
(
file
)
506 KB
1
11:23, 30 September 2010
Breakdown of production of fruit, EU-27, 2009 (% of total, based on tonnes).png
(
file
)
523 KB
1
11:23, 30 September 2010
Agricultural production of crops, 2009 (1 000 tonnes).PNG
(
file
)
1.84 MB
1
16:47, 16 September 2010
Yearbook 2010 agrimonetary statistics.xls
(
file
)
126 KB
1
15:02, 16 September 2010
Annual evolution of deflated price indices of agricultural output and input, 2005-09 (%).png
(
file
)
1,000 KB
1
13:13, 7 July 2010
Breakdown of production of vegetables, EU-27, 2009.png
(
file
)
516 KB
1
13:11, 7 July 2010
Production of cereals (including rice), EU-27, 2009.png
(
file
)
499 KB
2
13:06, 7 July 2010
Breakdown of production of fruit, EU-27, 2009.png
(
file
)
518 KB
1
12:53, 7 July 2010
Agricultural production of crops, 2009.PNG
(
file
)
1.82 MB
1
12:44, 7 July 2010
Indices of the agricultural production of crops, EU-27 (2000 = 100).png
(
file
)
1,005 KB
4
12:15, 7 July 2010
Indices of the agricultural production of crops, EU-27, (2000 = 100).png
(
file
)
919 KB
1
12:06, 21 May 2010
Agricultural Labour Input (in 1000 AWU).png
(
file
)
1.65 MB
1
16:18, 18 May 2010
Real factor income per annual work unit (EUR 1000).png
(
file
)
941 KB
1
16:18, 18 May 2010
Production volume, total and per AWU, indices (2000=100).png
(
file
)
1.2 MB
1
15:25, 18 May 2010
Agricultural labour input, AWU, decrease from 2000 to 2009 (%).png
(
file
)
989 KB
1
15:14, 12 April 2010
Agricultural income per worker 2009 2005.png
(
file
)
10 KB
1
14:46, 12 April 2010
Change in agricultural income per worker.png
(
file
)
10 KB
2
Special page
ISSN 2443-8219
.PNG)
,_EU-27,_2010_(%25).png)
.png)
.png)
,_EU-27_(2005%3D100).png)
.png)
_(2005%3D100).png)
.png)
.png)
,_EU-27_(2005%3D100).png)
.png)
.png)
.png)
.png)
,_2000-2009.png)
,_2000-2009.png)
.png)
,_1999-2008.png)
.png)
.png)
,_1999-2008.png)
.png)
.png)
,_EU-27,_2009_(%25).png)
.png)
.png)
.PNG)
.png)

,_EU-27,_2009.png)


.png)
.png)
.png)
.png)
.png)
.png)

