Tutorials
Log in
Statistics Explained
menu
search
search
Navigation
Main page
Statistical themes
Glossary
Categories
Statistics 4 beginners
Tutorials
Help
Eurostat home
Education corner
Online publications
Regional yearbook
Sustainable development
Full list
Tools
User contributions
Logs
View user groups
Special pages
search
Navigation
Main page
Statistical themes
Glossary
Categories
Statistics 4 beginners
Tutorials
Help
Eurostat home
Education corner
Online publications
Regional yearbook
Sustainable development
Full list
Tools
User contributions
Logs
View user groups
Special pages
Navigation
Main page
Statistical themes
Glossary
Categories
Statistics 4 beginners
Tutorials
Help
Eurostat home
Education corner
Online publications
Regional yearbook
Sustainable development
Full list
Tools
User contributions
Logs
View user groups
Special pages
Uploads by Capilbr
This special page shows all uploaded files.
File list
Items per page:
20
50
100
250
500
Search for media name:
Username:
Include old versions of files
Go
Date
Name
Thumbnail
Size
Description
Versions
11:59, 5 July 2019
Population structure and ageing YB2019.xlsx
(
file
)
151 KB
2
12:42, 2 July 2019
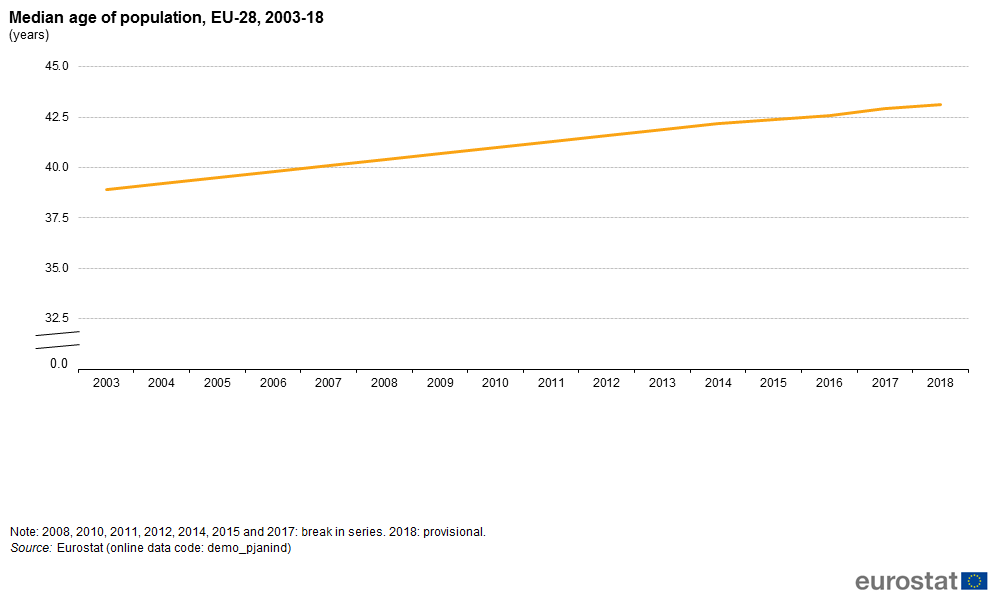
Median age of population, EU-28, 2003-18 (years).png
(
file
)
18 KB
2
11:40, 2 July 2019
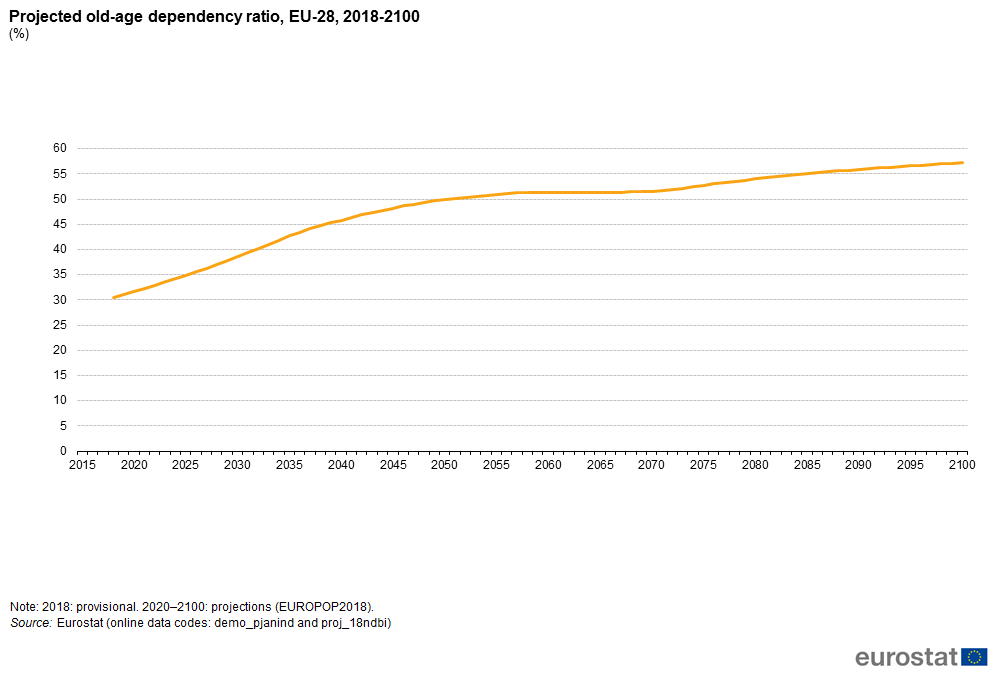
Projected old-age dependency ratio, EU-28, 2018-2100 (%).png
(
file
)
20 KB
1
11:17, 2 July 2019
Population structure by major age groups, EU-28, 2018-2100 (% of total population).png
(
file
)
40 KB
1
17:47, 17 June 2019
Mortality and life expectancy statistics YB2019.xlsx
(
file
)
101 KB
1
15:14, 12 June 2019
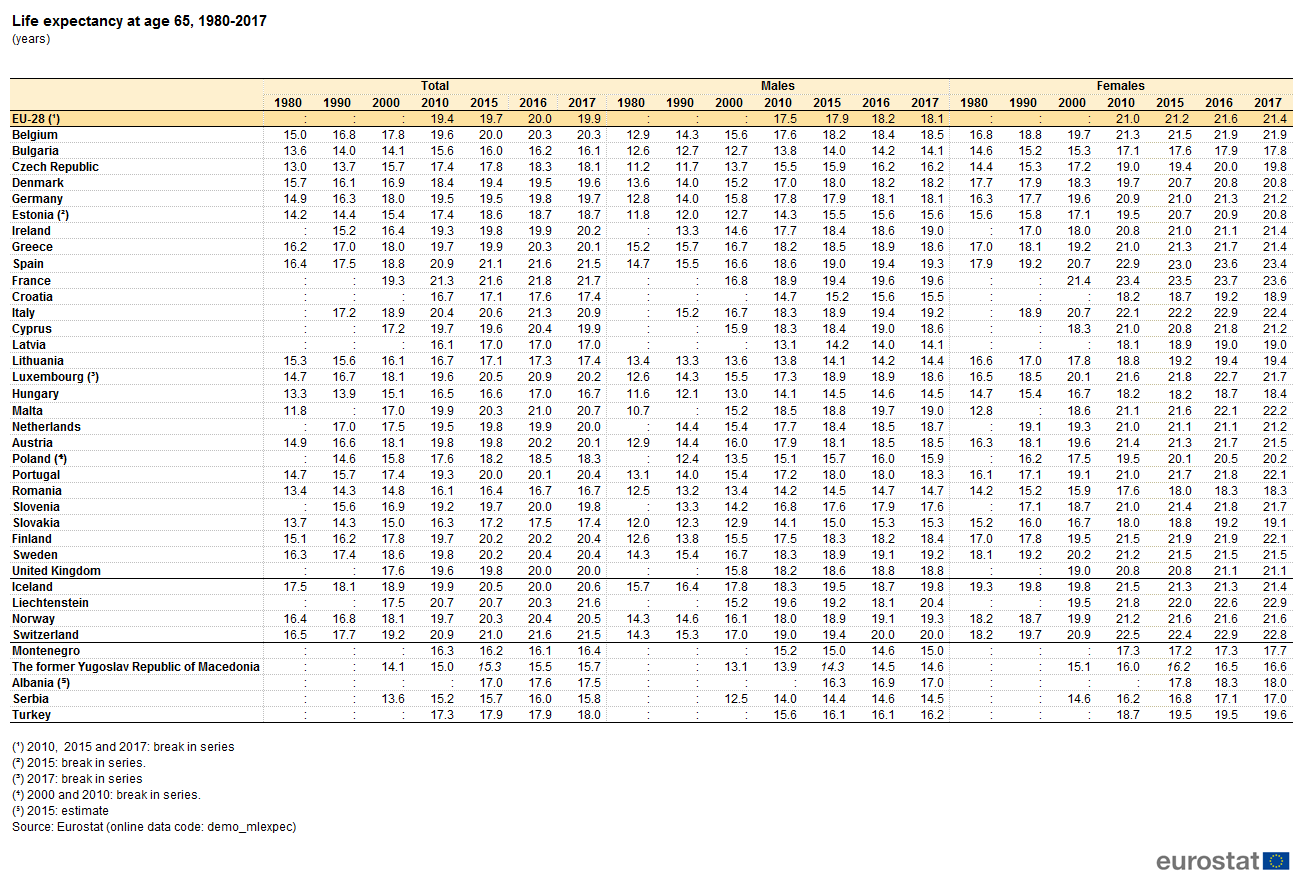
Life expectancy at age 65, 1980-2017 (years).png
(
file
)
89 KB
1
15:03, 12 June 2019
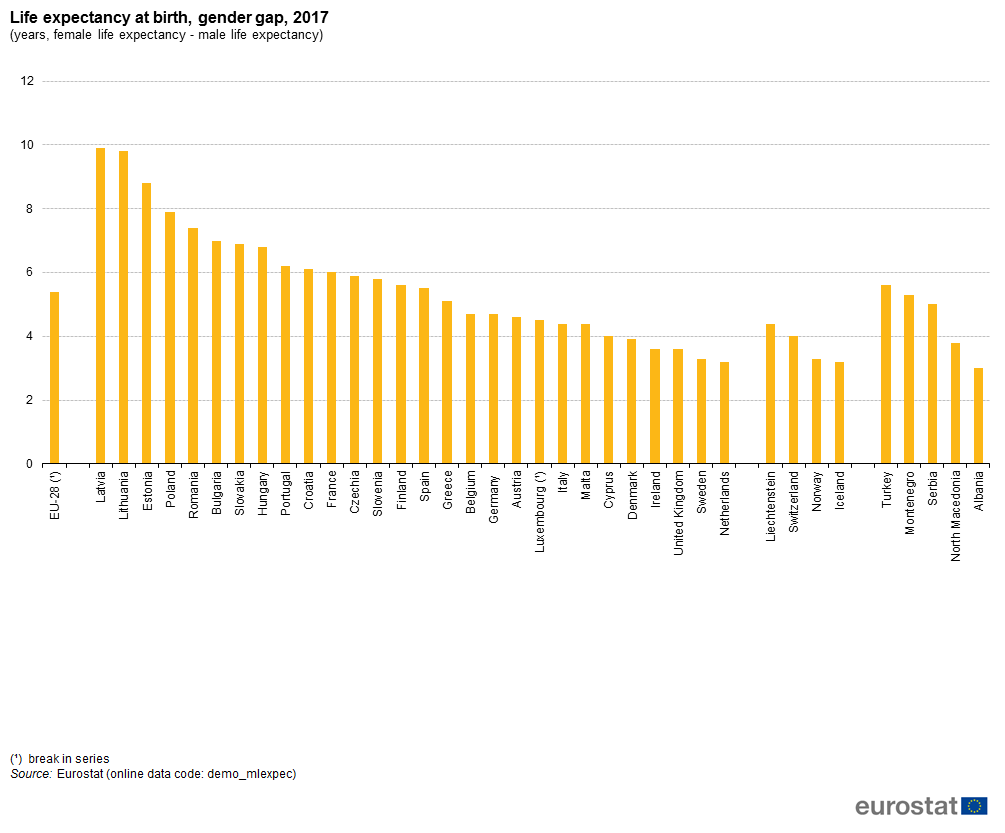
Life expectancy at birth, gender gap, 2017 (years, female life expectancy - male life expectancy).png
(
file
)
43 KB
1
14:49, 12 June 2019
Life expectancy at birth, 1980-2017 (years).png
(
file
)
92 KB
1
14:36, 12 June 2019
Number of deaths, EU-28, 1962-2017 (million).png
(
file
)
18 KB
1
09:06, 4 June 2019
Marriage and divorce statistics YB2019.xlsx
(
file
)
76 KB
1
08:44, 4 June 2019
Crude divorce rate, selected years,1960-2017 (per 1 000 persons).png
(
file
)
58 KB
3
18:52, 3 June 2019
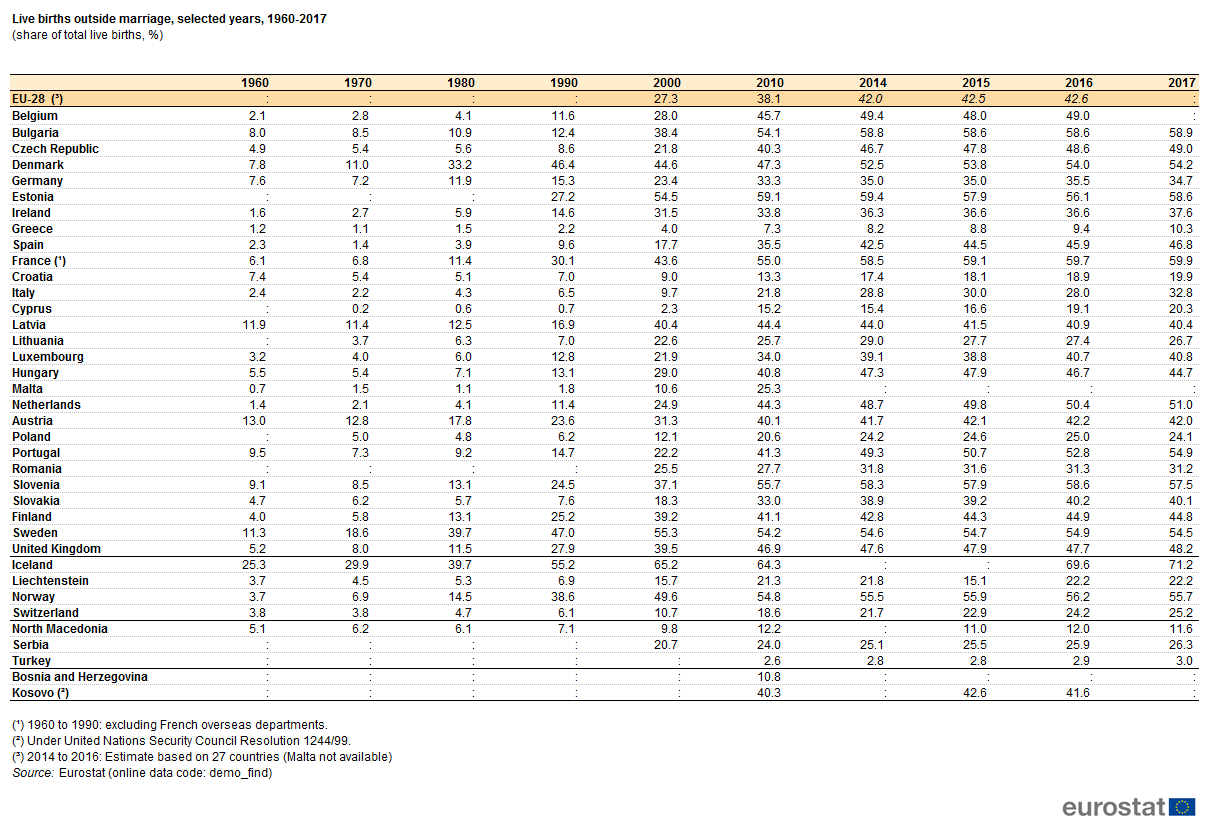
Live births outside marriage, selected years, 1960-2016 (share of total live births, %).png
(
file
)
63 KB
2
18:42, 3 June 2019
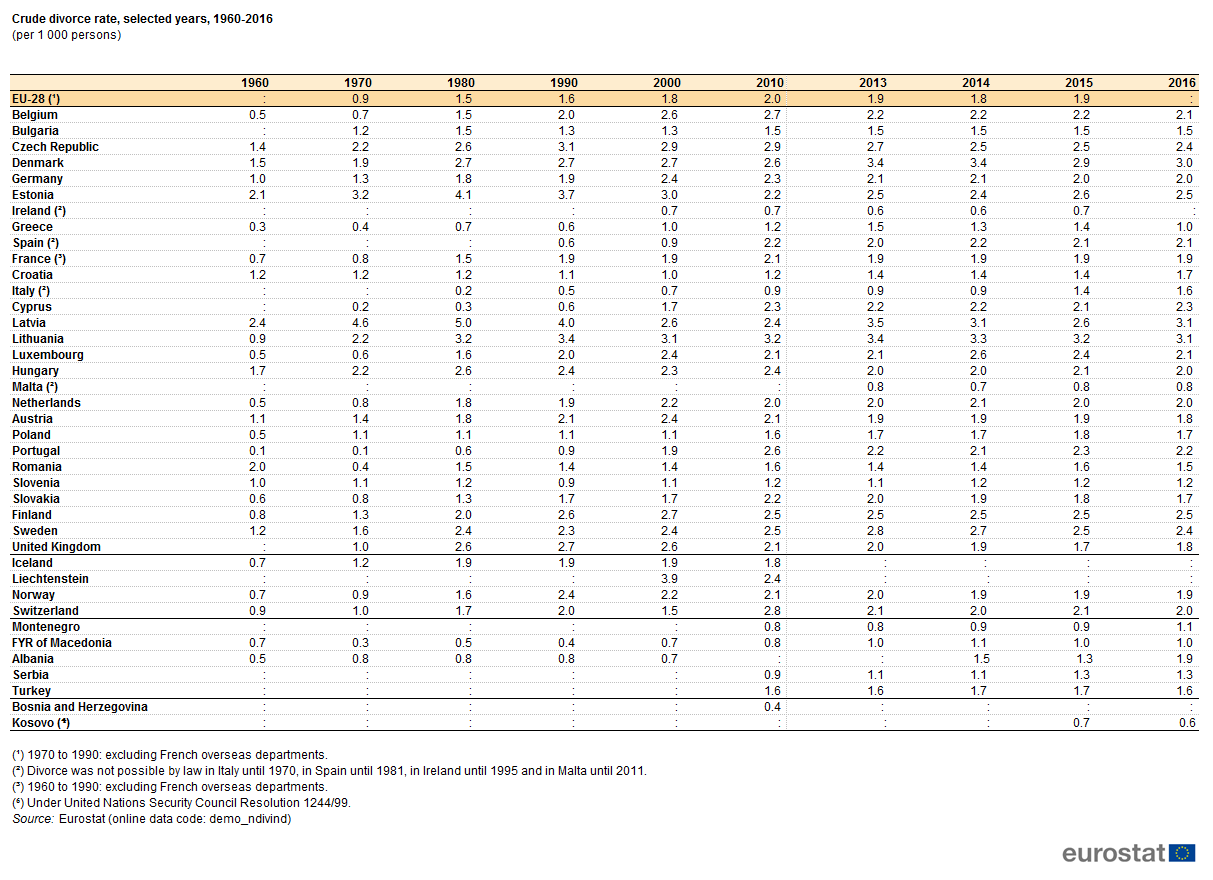
Crude divorce rate, selected years, 1960-2017 (per 1 000 persons).png
(
file
)
57 KB
7
18:24, 3 June 2019
Crudemarriage rate, selected years, 1960-2017 (per 1 000 persons).png
(
file
)
62 KB
1
17:57, 3 June 2019
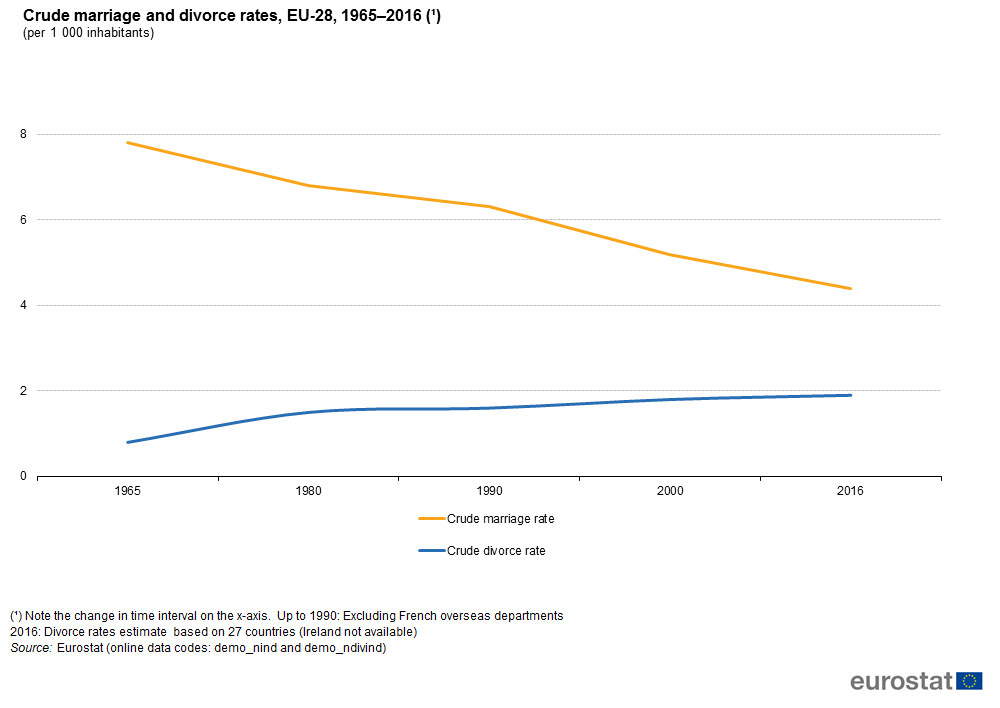
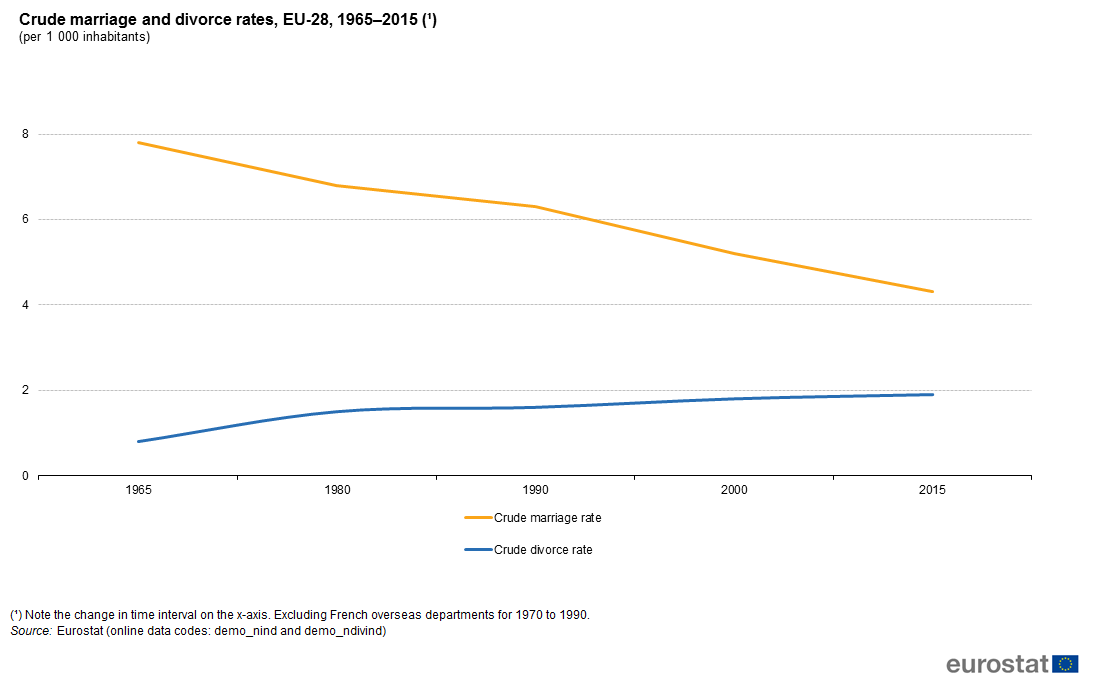
Crude marriage and divorce rates, EU-28, 1965–2016 (¹) (per 1 000 inhabitants).png
(
file
)
23 KB
3
17:41, 3 June 2019
Crude marriage and divorce rates, EU-28, 1965–2016 (¹)(per 1 000 inhabitants).png
(
file
)
23 KB
Reverted to version as of 15:31, 3 June 2019
5
17:05, 29 May 2019
Live births outside marriage, selected years, 1960-2017(share of total live births,%).png
(
file
)
63 KB
2
16:50, 29 May 2019
Live births outside marriage, selected years, 1960-2017(share of total live births, %).png
(
file
)
63 KB
1
16:26, 30 April 2019
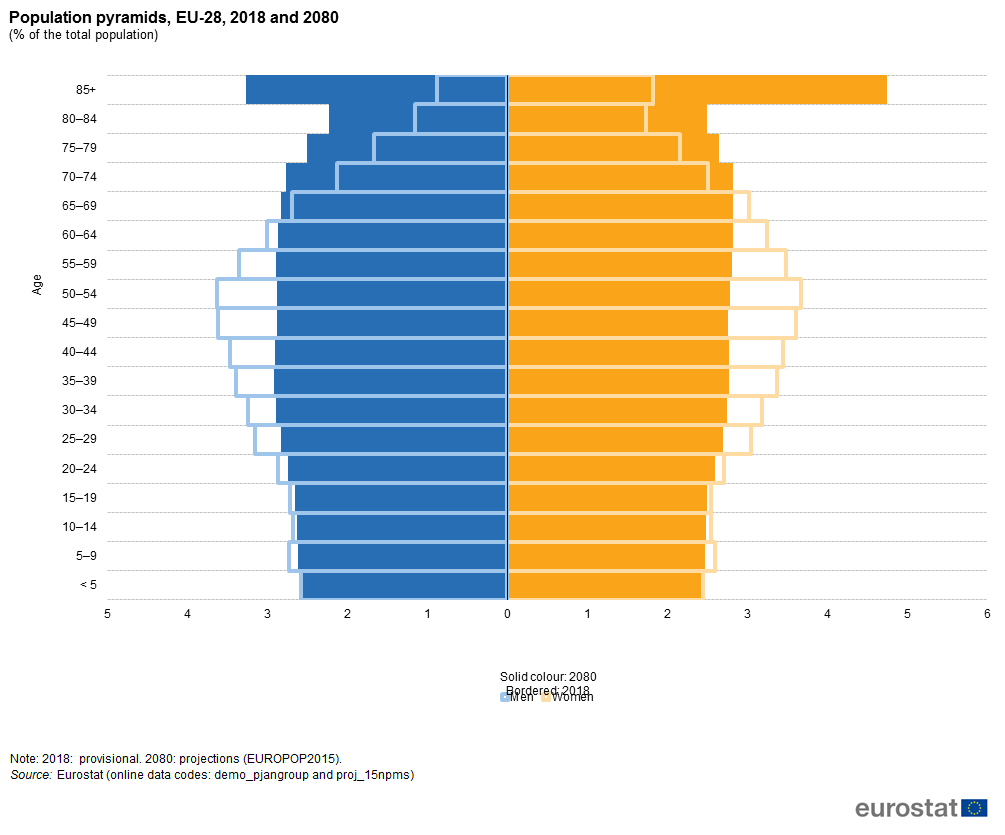
Population pyramids, EU-28, 2018 and 2080 (% of the total population).png
(
file
)
33 KB
1
16:23, 30 April 2019
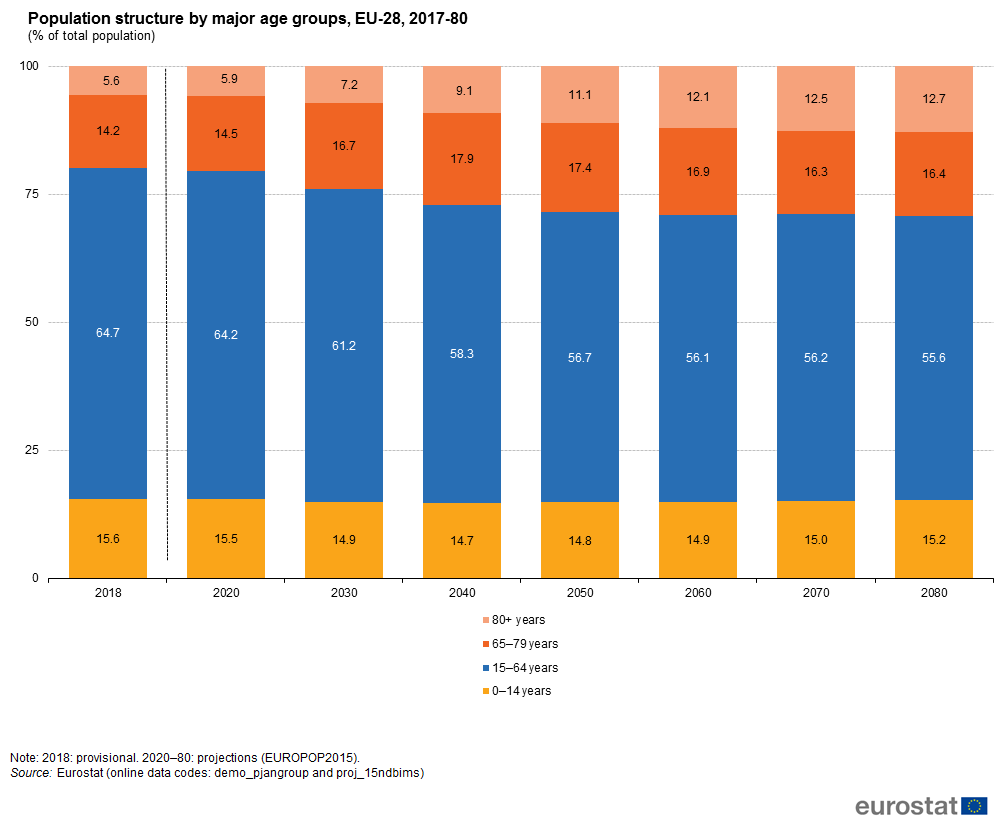
Population structure by major age groups, EU-28, 2017-80 (% of total population).png
(
file
)
41 KB
2
16:21, 30 April 2019
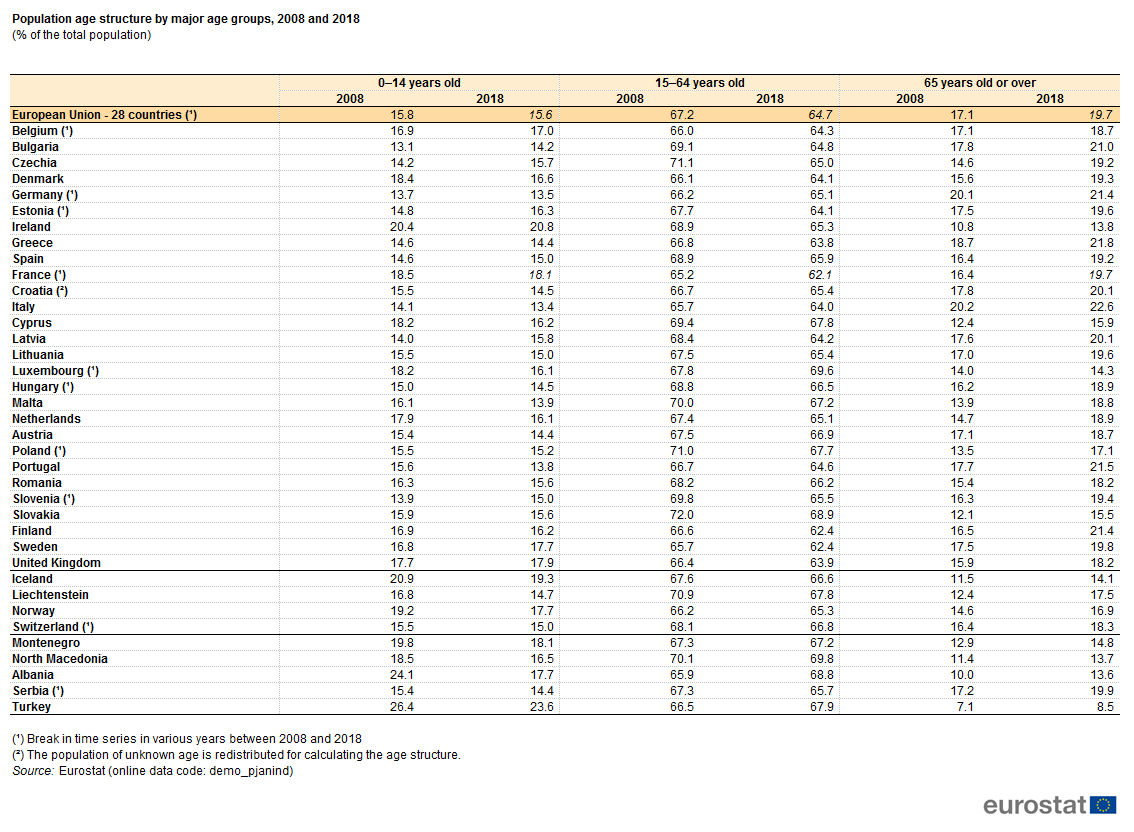
Population age structure by major age groups, 2008 and 2018 (% of the total population).png
(
file
)
61 KB
2
16:20, 30 April 2019
Projected old-age dependency ratio, EU-28, 2018-80 (%).png
(
file
)
19 KB
1
15:40, 30 April 2019
Population age structure indicators, 1 January 2018 (%).png
(
file
)
46 KB
1
14:26, 30 April 2019
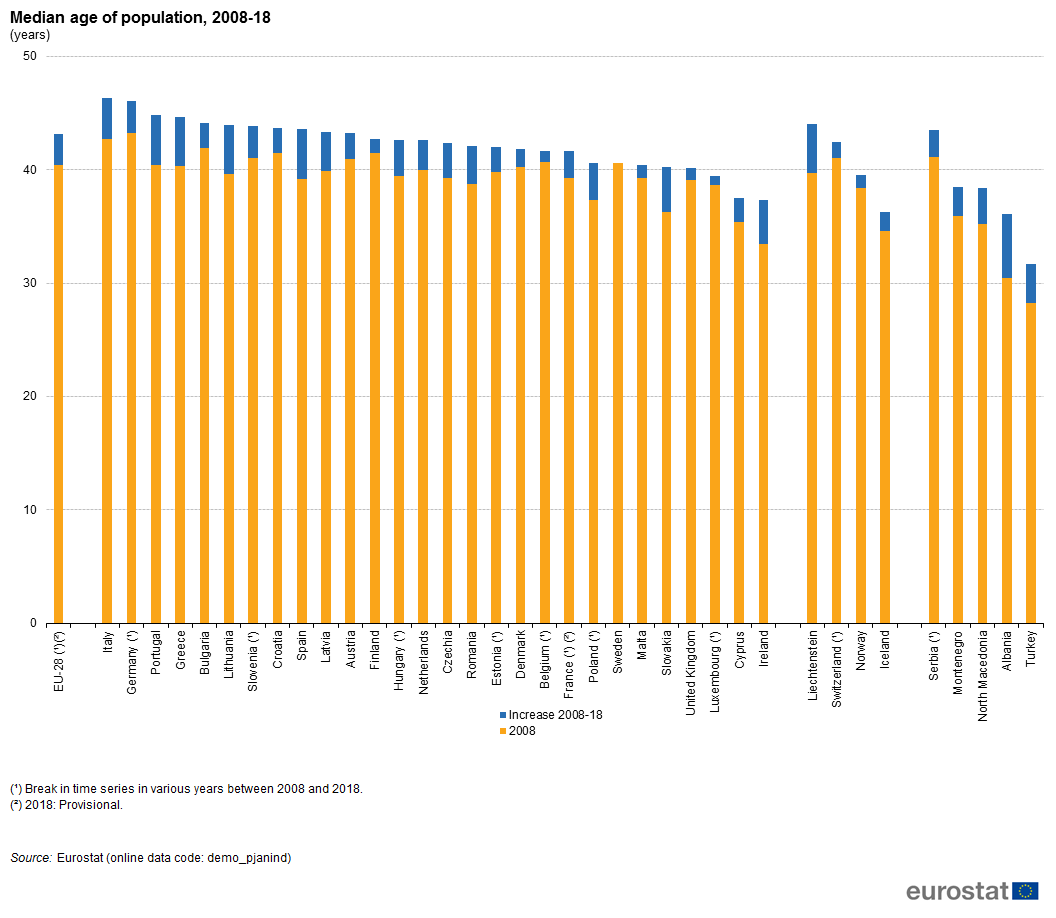
Median age of population, 2008-18 (years) .png
(
file
)
80 KB
1
17:38, 29 April 2019
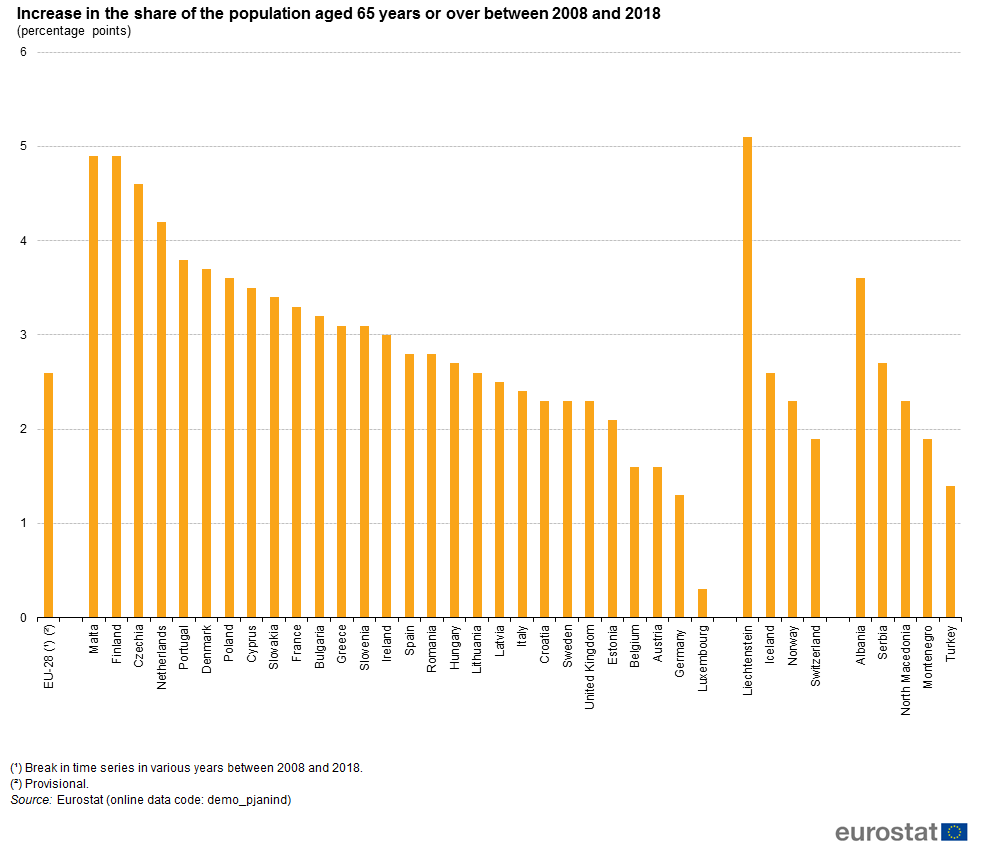
Increase in the share of the population aged 65 years or over between 2008 and 2018 (percentage points).png
(
file
)
57 KB
1
11:27, 9 August 2018
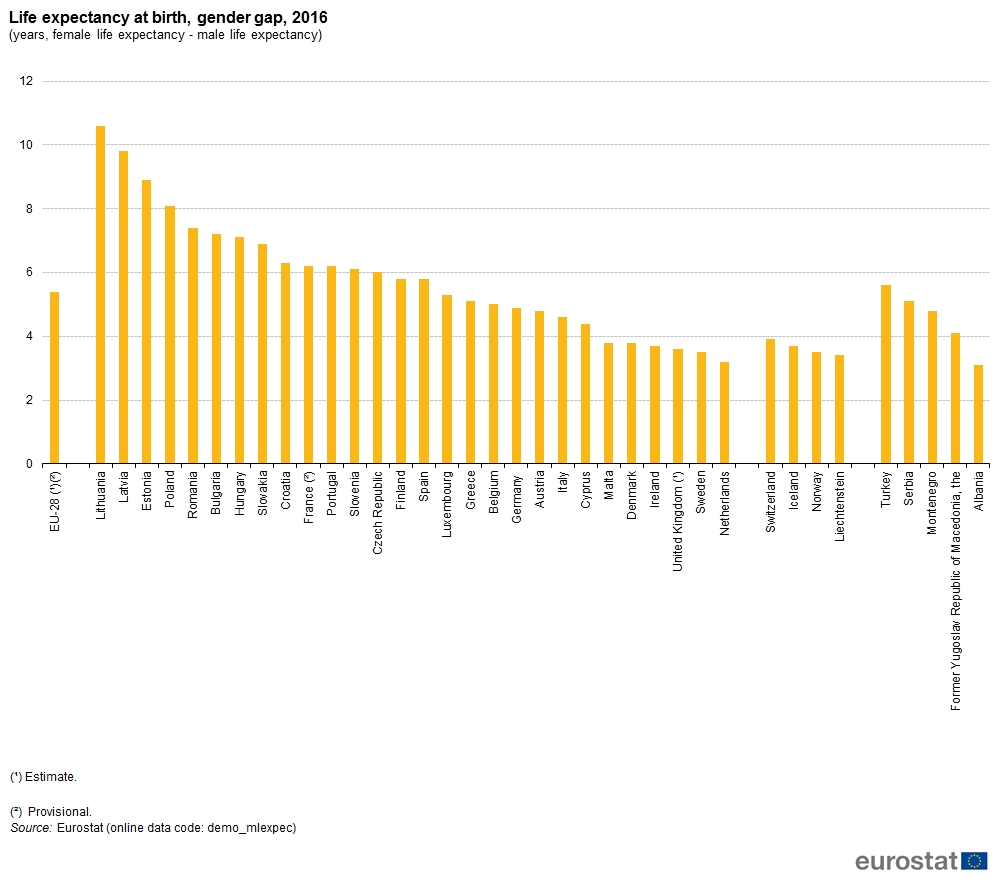
Life expectancy at birth, gender gap, 2016 (years, female life expectancy - male life expectancy).png
(
file
)
46 KB
2
11:19, 9 August 2018
Life expectancy at age 65, gender gap, 2016 (years, female life expectancy - male life expectancy).png
(
file
)
40 KB
1
11:14, 9 August 2018
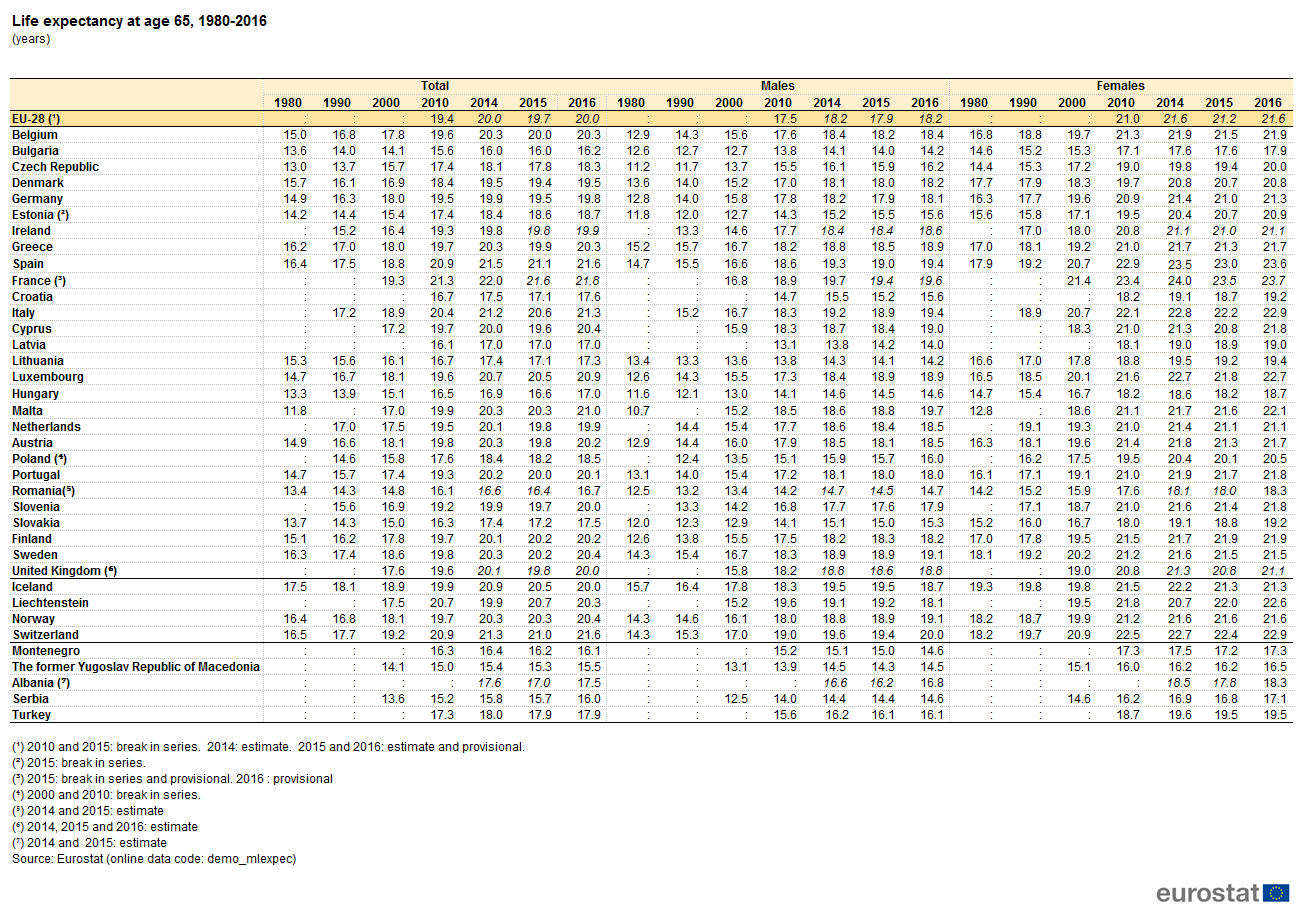
Life expectancy at age 65, 1980-2016 (years).png
(
file
)
94 KB
1
11:05, 9 August 2018
Mortality and life expectancy statistics YB2018.xlsx
(
file
)
106 KB
1
10:40, 9 August 2018
Life expectancy at birth, 1980-2016 (years).png
(
file
)
96 KB
1
10:31, 9 August 2018
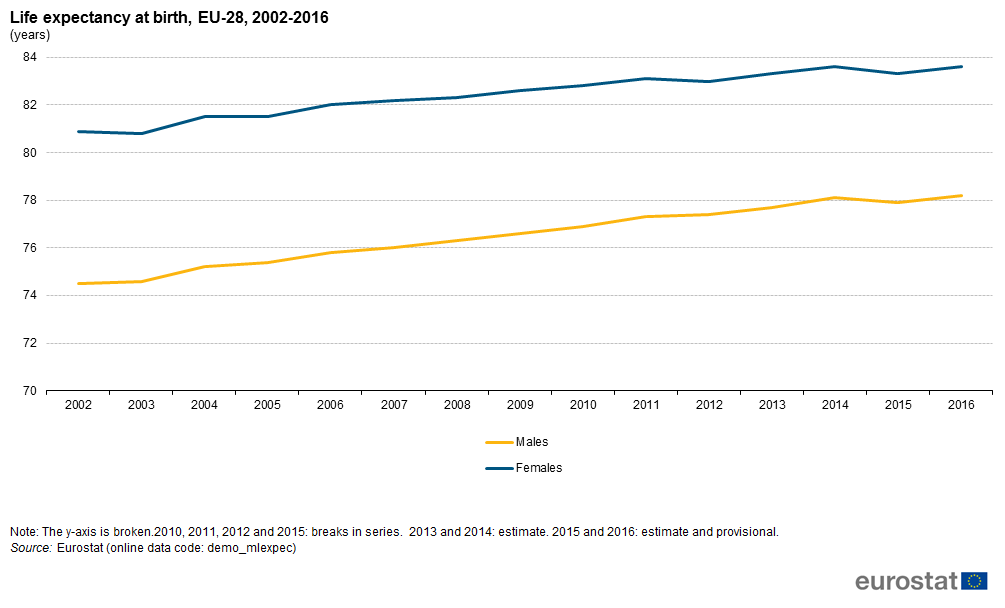
Life expectancy at birth, EU-28, 2002-2016 (years).png
(
file
)
21 KB
3
10:28, 9 August 2018
Life expectancy at birth, EU-28, 2002-16 (years).png
(
file
)
21 KB
1
10:13, 9 August 2018
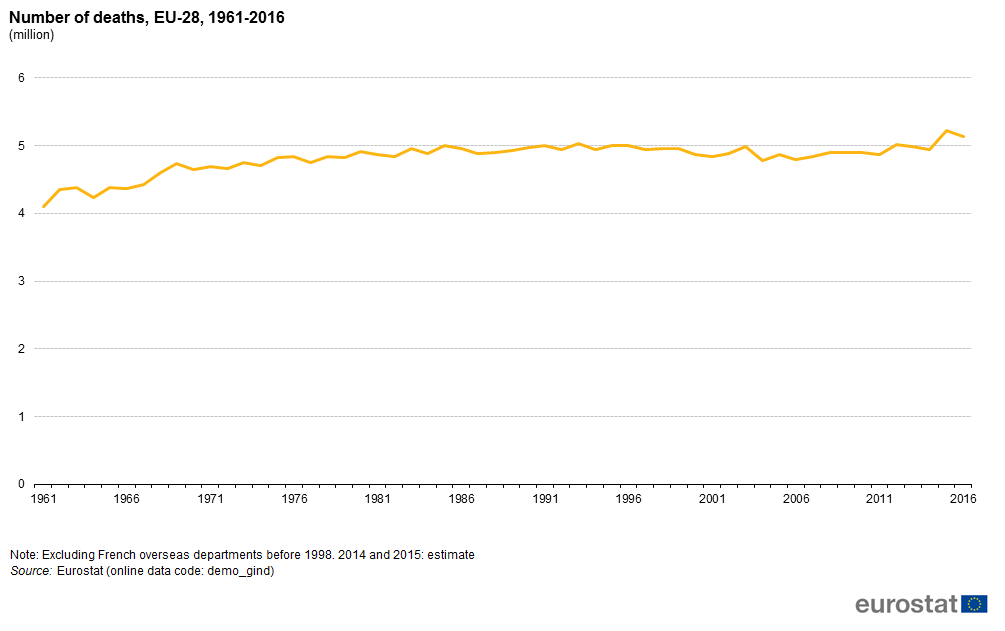
Number of deaths, EU-28, 1961-2016 (million).png
(
file
)
19 KB
1
14:50, 22 June 2018
Crude marriage and divorce rates-EU-28, 1965–2015 (¹) (per 1 000 inhabitants).png
(
file
)
23 KB
1
14:34, 22 June 2018
Crude marriage rate, selected years-1960-2016 (per 1 000 persons).png
(
file
)
64 KB
1
14:27, 22 June 2018
Crude marriage rate, selected years 1960-2016 (per 1 000 persons).png
(
file
)
64 KB
1
14:25, 22 June 2018
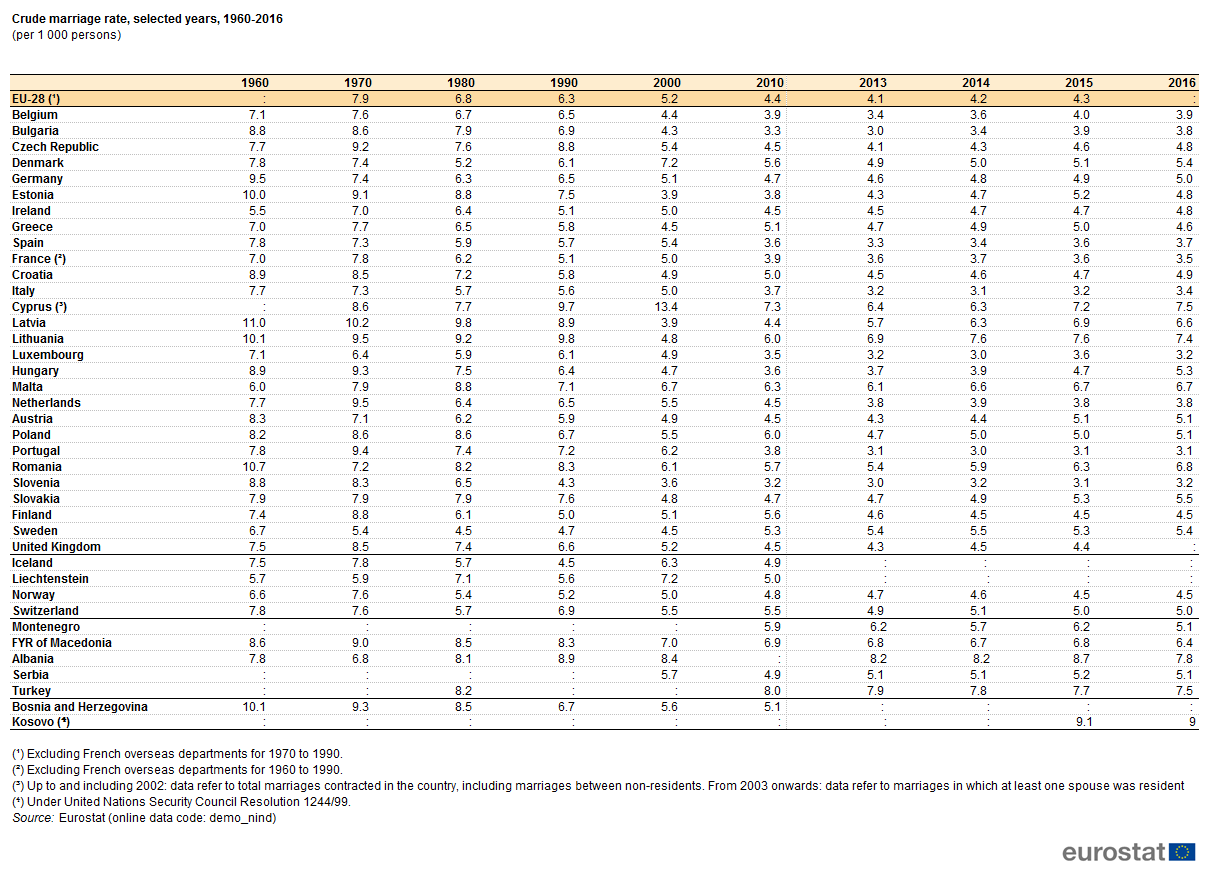
Crude marriage rate, selected years, 1960-2016 (per 1 000 persons).png
(
file
)
64 KB
22
14:11, 22 June 2018
Crude marriage and divorce rates, EU-28, 1965–2015 (¹) (per 1 000 inhabitants).png
(
file
)
23 KB
12
10:24, 22 June 2018
Crude divorce rate, selected years, 1960-2016 (per 1 000 persons).png
(
file
)
58 KB
5
14:26, 19 June 2018
Marriage and divorce statistics YB2018.xlsx
(
file
)
82 KB
3
12:00, 1 June 2018
Share of live births by birth order, 2016 (%).png
(
file
)
70 KB
1
11:50, 1 June 2018
Total fertility rate, 1960–2016 (live births per woman).png
(
file
)
54 KB
1
11:37, 1 June 2018
Fertility indicators, EU-28, 2001–2016.png
(
file
)
28 KB
1
11:20, 1 June 2018
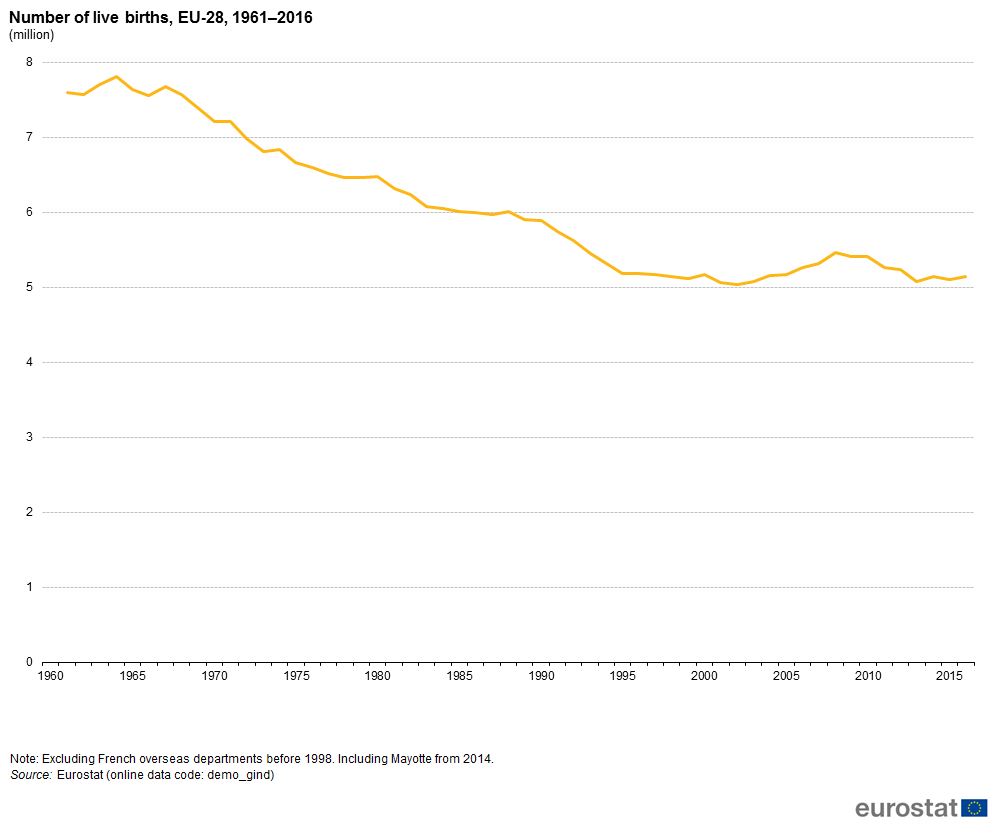
Number of live births, EU-28, 1961–2016 (million).png
(
file
)
21 KB
1
12:00, 30 May 2018
Projected old-age dependency ratio, EU-28, 2017-80 (%).png
(
file
)
19 KB
1
11:37, 30 May 2018
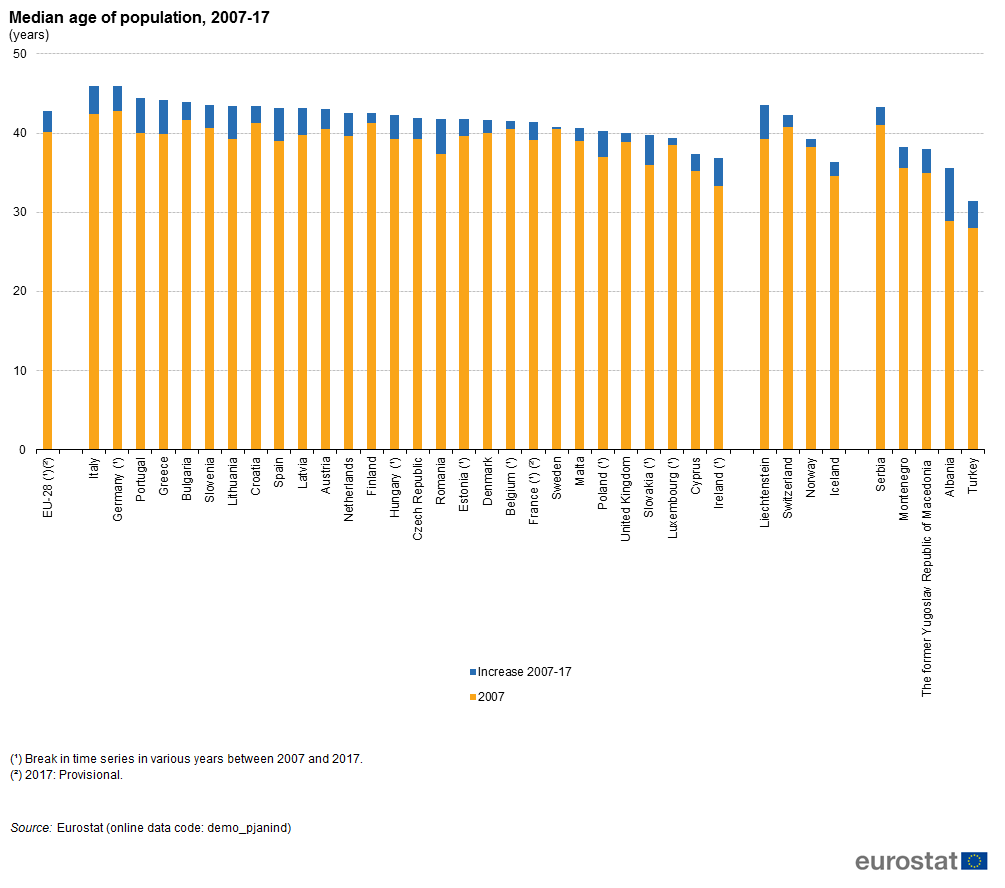
Median age of population, 2007-17 (years).png
(
file
)
65 KB
1
11:33, 30 May 2018
Increase in the share of the population aged 65 years or over between 2007 and 2017 (percentage points).png
(
file
)
58 KB
1
11:26, 30 May 2018
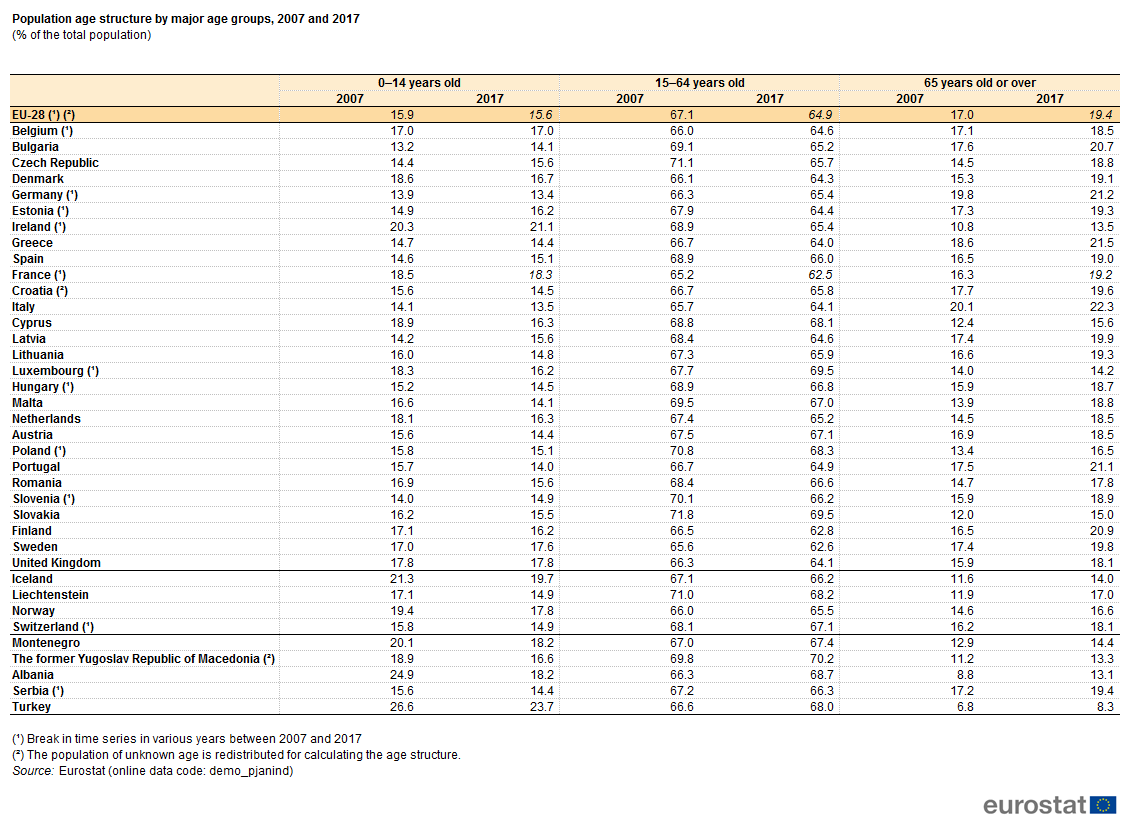
Population age structure by major age groups, 2007 and 2017 (% of the total population).png
(
file
)
61 KB
1
Special page
ISSN 2443-8219
.png)
.png)
.png)
.png)
.png)
.png)
.png)
.png)
.png)
.png)
.png)
_(per_1_000_inhabitants).png)
(per_1_000_inhabitants).png)
.png)
.png)
.png)
.png)
.png)
.png)
.png)
_.png)
.png)
.png)
.png)
.png)
.png)
.png)
.png)
.png)
_(per_1_000_inhabitants).png)
.png)
.png)
.png)
_(per_1_000_inhabitants).png)
.png)
.png)
.png)

.png)
.png)
.png)
.png)
.png)