Police, court and prison personnel statistics
Data extracted in April 2024.
Planned article update: April 2025.
Highlights
Professional judges (per hundred thousand inhabitants), average 2020-2022
This article presents personnel statistics for police, courts, and prisons in Europe, including the number of employees and the proportion of women. Data cover the period 2012 to 2022.
The results cover the European Union (EU), the EFTA countries, the candidate countries and the potential candidate countries. Official figures are provided by national administrations of police, courts and prisons. Countries' compliance with definitions and counting methodologies can be found in the crime metadata.
Full article
In 2022, the proportion of women as police officers, professional judges and personnel in adult prisons in the EU continued to increase
In 2022, there were 1 522 106 police officers, 81 567 professional judges and 260 611 employees in adult prisons per 100 000 inhabitants in the EU.[1]
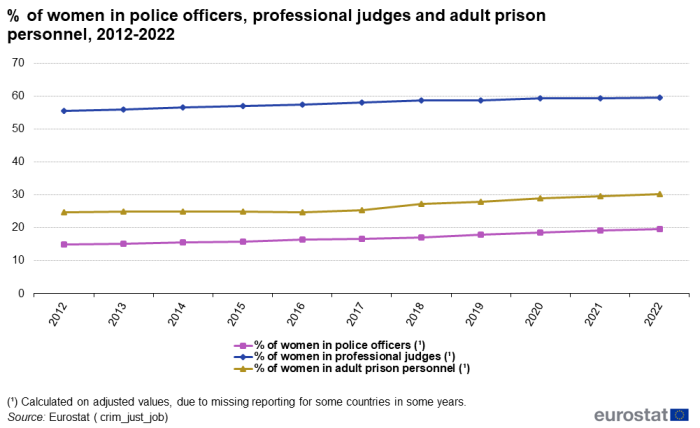
The proportion of women as police officers, judges and prison personnel in the EU has generally increased since 2012, as shown in Figure 1. In 2022, it reached the highest values for police officers (19.6 %), professional judges (59.7 %) and personnel in adult prisons (30.3 %).[2]
The number of police officers in the EU has been increasing since 2015 and it reached the highest value in 2022. The number of judges in the EU has been largely stable from 2012 to 2019, reached an high in 2020 and slightly decreased in 2021 (-0.4%) and 2022 (-0.5%). Mainly following the falling number of prisoners, the prison personnel in adult prisons decreased between 2013 and 2017, and increased again between 2018 and 2021, then remained almost steady in 2022 compared to 2021.

Source: Eurostat (crim_just_job)
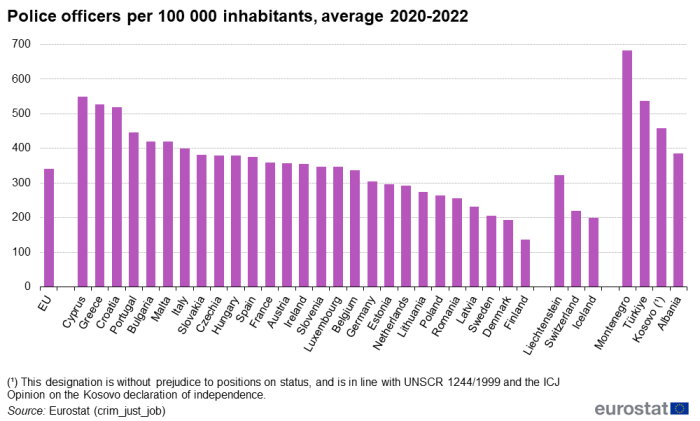
341 police officers per 100 000 inhabitants in the 2020-2022 period
Overall, there was one police officer per 293 inhabitants in the EU as three-year average (2020-2022)[3] or 341 police officers per 100 000 inhabitants. The value slightly increased compared with the previous three-year average (340 police officers per 100 000 inhabitants in 2019-2021). However, there are big differences between countries, as illustrated in Figure 2. The lowest number of police officers per 100 000 inhabitants was in Finland (137), followed by Denmark (194) and Sweden (206). In six EU Member States the figure was over 400. The highest values were recorded in Cyprus (550), Greece (526) and Croatia (519). However, there may be differences between countries on the jobs counted as police officer due to variations in how countries organize law enforcement.The percentage of women among police officers shows large differences between EU Member States. The highest percentage of women among police officers was in Latvia (43.4 %), followed by Lithuania (41.7)%) and Ireland (36.4 %), while the lowest percentage was in Portugal (9.1 %), followed by Bulgaria (12.3 %), and Spain (13.4%). In all 26 countries that provided data for both periods, the percentage of women among police officers in the period 2020-2022 increased compared with the average of the period 2019-2021, while Italy did not provide the breakdown by sex for the period 2020-2022.

Source: Eurostat (crim_just_job)
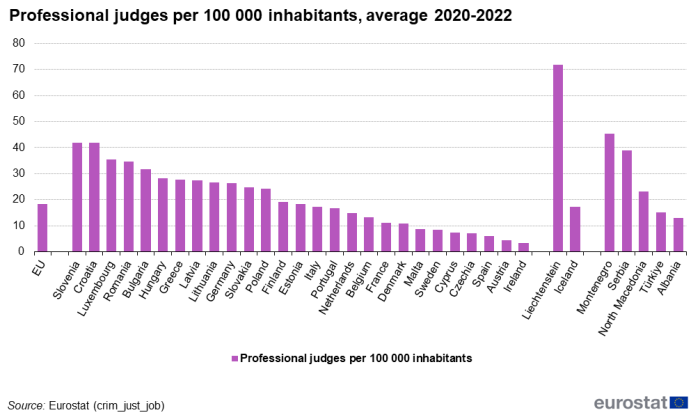
18 professional judges per 100 000 inhabitants in the 2020-2022 period
Overall, there was one professional judge per 5 454 inhabitants in the EU as three-year average (2020-2022), that means 18 professional judges per 100 000 inhabitants. However, there are big differences between countries, as illustrated in Figure 3. The highest number of professional judges per 100 000 inhabitants was in Slovenia and Croatia (42 both), followed by Luxembourg and Romania (35 both). There were less than 10 professional judges per 100 000 inhabitants in seven EU Member States (Malta, Sweden, Cyprus, Czechia, Spain, Austria and Ireland). In 23 EU Member States out of 26 that provided data, more than 50 % of professional judges were women. In the EU, only in Cyprus, Germany, and Ireland the percentage of women among professional judges was lower than 50 %, while Czechia did not provide the breakdown by sex for the period 2020-2022. However, the percentage of women in the same country may differ between type of judge, function and type of court.

Source: Eurostat (crim_just_job)
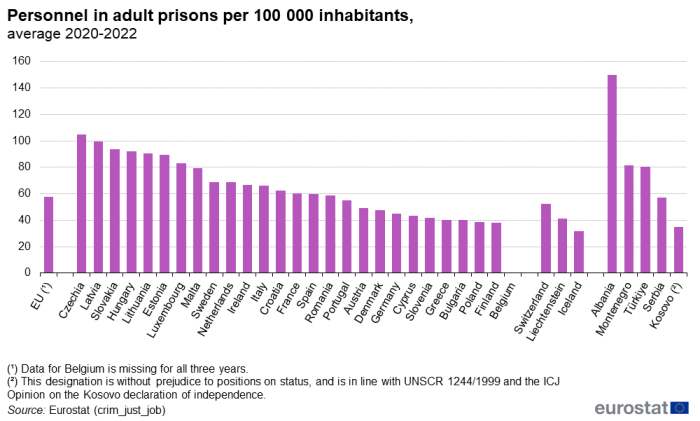
58 employees in adult prisons per 100 000 inhabitants in the EU in the 2020-2022 period
Overall, there was one employee in adult prisons per 1 731 inhabitants in the EU as three-year average (2020-2022), that means 58 prison employees per 100 000 inhabitants. As illustrated in Figure 4, the highest number of prison employees per 100 000 inhabitants was in Czechia (105), followed by Latvia (99) and Slovakia (94). There were less than 40 prison employees per 100 000 inhabitants in three EU Member States (Bulgaria, Poland and Finland). In the period 2020-2022, the highest percentages of women among prison personnel were in Estonia (54.8 %), Lithuania (48.0 %) and Sweden (46.2 %), while the lowest were recorded in Greece (13.3 %), Bulgaria (14.6 %) and Cyprus (15.0 %). Belgium did not provide data on prison personnel for the period 2020-2022.

Source: Eurostat (crim_just_job)
Government expenditure on police, courts, and prisons
Government expenditure for public order and safety in the EU was 1.7 % of the gross domestic product in 2022, of which 0.9 % was for police services, 0.3 % for law courts and 0.2 % for prisons. The remaining part of government expenditure for public order and safety was for fire-protection and other services. All values remained constant compared to the previous year.
For more information, see the Statistics Explained article Government expenditure on public order and safety and the table General government expenditure by function.
Source data for tables and graphs
Data sources
Data are official figures from national administrations of police, courts, and prisons. Each country provides official national figures to Eurostat as part of a yearly data collection on crime and criminal justice statistics. When EU totals are calculated to indicate an overall trend, missing figures for countries are estimated with the last available year (of the same country). However, the EU totals presented in this article are not disseminated in the Eurostat database.
Available data
- 1993-2007: number of police officers
- 2008-2022: number of police officers, professional judges, prison personnel; total, men and women
Context
Police, court, and prison personnel statistics relate to the work of law enforcement services and criminal justice administration. The basic data are made for administrative purposes and mainly used by governments and authorities such as police, prosecution, courts, and prisons.
Related statistics include police-reported crime, prison statistics, government expenditure and employment statistics. Related issues include occurrence of crime, society's reaction to crime, safety and security policy, rule of law, effectiveness of the justice system.
Direct access to
Publications
Notes
- ↑ Due to missing data, total contains some national figures from previous years.
- ↑ The percentages of women as police officers, professional judges and adult prison personnel in Fig. 1 are calculated as percentage on yearly total adjusted for missing countries. The percentage of women in the paragraphs on police officers, professional judges and adult prison personnel are computed as averages for the interval 2020-2022 for each country.
- ↑ Due to missing data, a three-year average is presented instead of yearly figures.