Data from February 2025.
Planned update of the article: February 2026.
Highlights
The total gross weight of goods transported as part of EU short sea shipping was estimated at more than 1.6 billion tonnes in 2023.
Italy was the main short sea shipping country in the EU in 2023, with a share of 16% of the total EU short sea shipping tonnage.
Short sea shipping of freight, 2013, 2022 and 2023
This article presents recent short sea shipping (SSS) statistics of the European Union (EU), covering the transport of goods between main ports in the EU Member States and ports situated in geographical Europe or in non-European countries on the Mediterranean Sea and the Black Sea. In addition to the EU Member States, short sea shipping statistics are also available for main ports in the EFTA country Norway and the candidate countries Montenegro and Türkiye. The results are broken down by country, sea region and type of cargo. It should be noted that the figures presented in this article are influenced by variations in the level of transport reported with unknown partner ports (see methodological notes).
EU short sea shipping decreased by 5.4% in 2023 compared with 2022
The overall increase in short sea shipping recorded by the main EU ports consolidated the gradual recovery seen in EU short sea shipping following the economic downturn in Europe in 2009 and reached a new high in 2019 (Figure 1). However, this positive trend was put to an end in 2020 most probably because of the COVID-19 pandemic and the subsequent restrictions put in place in the EU and worldwide.
In 2021, a partial recovery was observed. In 2022, the total gross weight of goods transported as part of EU short sea shipping was estimated at almost 1.7 billion tonnes, while in 2023 the total gross weight of goods was estimated at 1.6 billion tonnes, a decrease of 5.4% from the previous year.
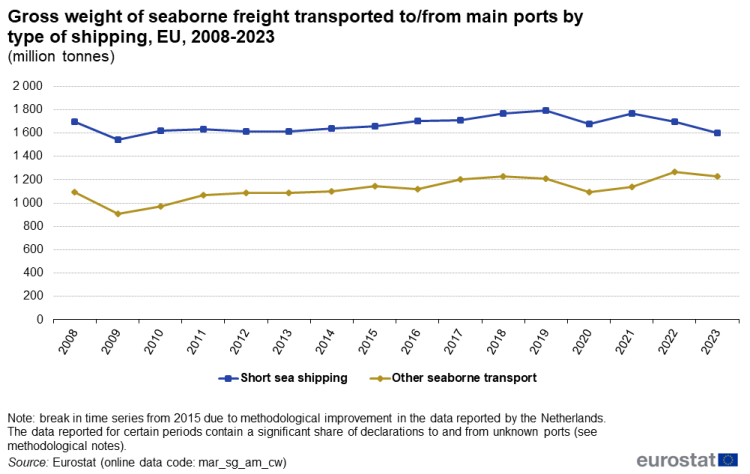
(million tonnes)
Source: Eurostat (mar_sg_am_cw)
Short sea shipping made up 56.6% of the total sea transport of goods to and from the main EU ports in 2023, 0.6 percentage points less compared with 2022. When looking at the reporting countries, the share of short sea shipping in total sea transport varies considerably. The predominance of short sea shipping of goods over deep sea shipping was particularly pronounced in Estonia, Cyprus, Sweden, Malta, Finland, Ireland, Denmark, Bulgaria, Lithuania, Italy, Greece, Latvia, Poland and Croatia, and as well as in the EFTA country Norway and in the candidate countries Montenegro and Türkiye, all with short sea shipping shares of two thirds or more in their main ports (Figure 2).
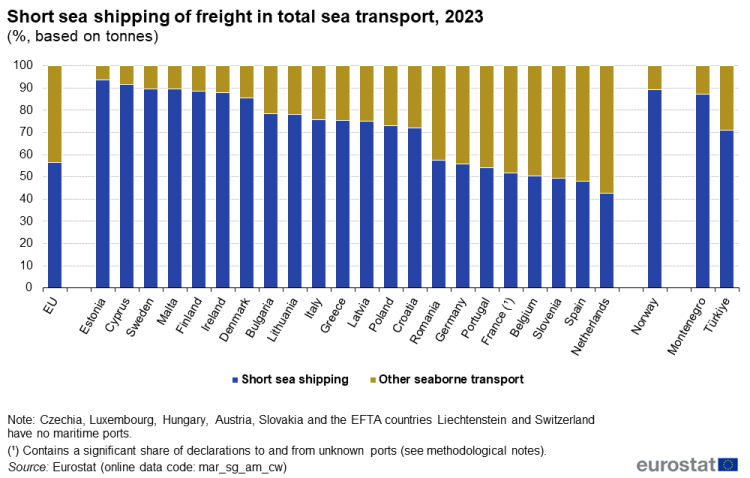
(%, based on tonnes)
Source: Eurostat (mar_sg_am_cw)
Geographical considerations, such as long coast lines or a large number of inhabited islands, play a part in explaining the high share of short sea shipping in most of these countries. A large volume of feeder services to or from hub ports also explains the high degree of short sea shipping transport in countries which function as regional trans-shipment points. By contrast, the share of short sea shipping is lower in countries with major ports focused on intercontinental trade. In 2023, it was lower than 58% in Romania, Germany, Portugal, France, Belgium, Slovenia, Spain and the Netherlands.
Italy, the Netherlands and Spain accounted for more than 38% of EU short sea shipping in 2023
Italy was the major short sea shipping country in the EU in 2023, with 302 million tonnes, representing a share of 15.8% of the total tonnages of EU short sea shipping in 2023. The Netherlands followed with 232 million tonnes and then Spain with 209 million tonnes of short shipped goods recorded in their main ports (Figure 3).
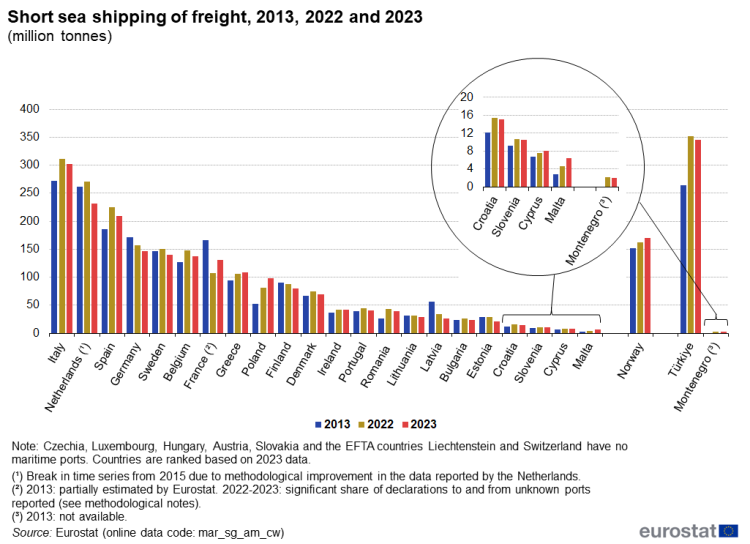
(million tonnes)
Source: Eurostat (mar_sg_am_cw)
Among the EU Member States, 5 out of 22 registered a growth in short sea shipping between 2022 and 2023. The largest relative increase was recorded by Malta (+40.4%), followed by France (+22.6%), Poland (+21.6%), Cyprus (+6.0%) and Greece (+1.4%). In addition, the EFTA country Norway also recorded a growth (+4.6%). By contrast, the largest relative decreases in short sea shipping among the EU Member States were recorded by Estonia (-28.5%), Latvia (-24.2%), the Netherlands (-14.4%) and Bulgaria (-9.9%). It should be noted that France reported a significant share of declarations to and from unknown ports in 2023, impacting the comparability between 2022 and 2023 (see methodological notes).
In 2023, inward movements accounted for 58% of the total tonnes of goods handled in the EU ports that were involved in short sea shipping transport (Figure 4). More seaborne goods were unloaded from than loaded onto vessels in most EU countries. Malta, Cyprus and Slovenia had the highest shares of unloaded goods in 2023, with respective shares of 87%, 80% and 70% of the total tonnes of short sea shipped goods recorded as inward movements to their ports. By contrast, Latvia, Estonia, Romania, the EFTA country Norway and the candidate country Montenegro had more outward movements of short sea shipped goods than inwards movements.
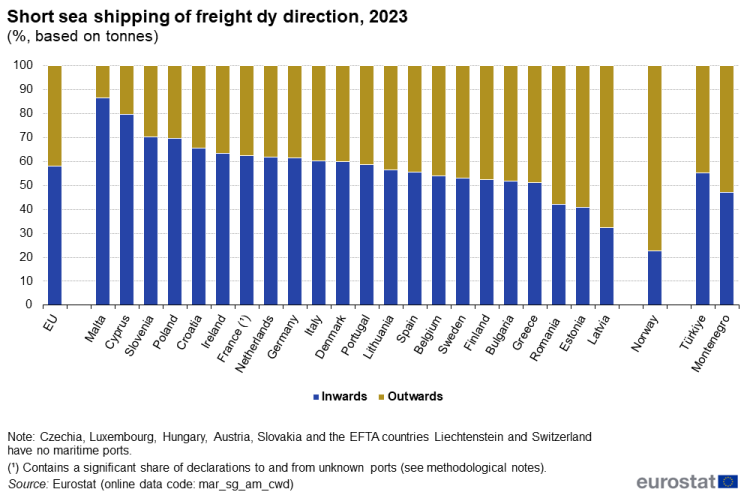
(%, based on tonnes)
Source: Eurostat (mar_sg_am_cwd)
The short sea shipping of goods between main EU ports and ports located in the Mediterranean Sea reached 628 million tonnes in 2023. This accounted to more than 35% of the total EU short sea shipping tonnages for all sea regions in 2023. The Mediterranean Sea was followed by the North Sea and the Baltic Sea, with shares of 27% and 16% of the total EU short shipping tonnages, respectively (Figure 5).

(%, based on tonnes)
Source: Eurostat (mar_sg_am_cws)
For most countries, the highest share of their short sea shipping of goods was with partner ports located in the same sea region or sea regions. There are some exceptions, like Poland and Romania. Poland is located on the Baltic Sea, but a majority (55%) of the short sea shipping of goods came from or was destined for ports located on the North Sea. Romania is located on the Black Sea, but a majority (51%) of the short sea shipping of goods came from or was destined for ports located on the Mediterranean Sea. By comparison, countries with large ports that act as hub ports or trans-shipment points will tend to have substantial short sea shipping with ports in several sea regions.
Liquid bulk remained the dominant type of cargo in EU short sea shipping
As in previous years, liquid bulk remained the dominant type of cargo in EU short sea shipping. At 646 million tonnes, liquid bulk accounted for 40% of the total short sea shipping of goods to and from main EU ports in 2023 (Figure 6). Liquid bulk was followed by dry bulk at 333 million tonnes (21%), roll on - roll off (Ro-Ro) units at 275 million tonnes (17%) and containers at 249 million tonnes (16%).
For liquid bulk, Italy had the largest volume of short sea shipping in 2023 (133 million tonnes), followed by the Netherlands (120 million tonnes). Netherlands led the EU rankings for short sea shipping of dry bulk goods (44 million tonnes). Italy was the main country in terms of short sea shipping of goods in containers (48 million tonnes) and also in terms of Ro-Ro units (69 million tonnes).
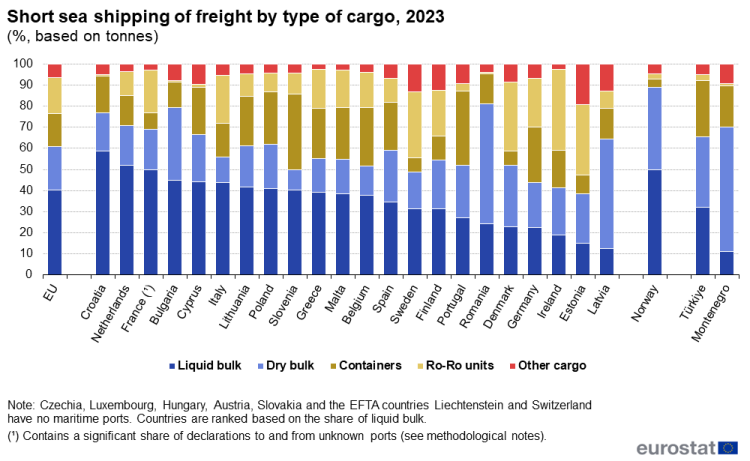
(%, based on tonnes)
Source: Eurostat (mar_sg_am_cwk)
Short sea shipping of liquid bulk goods was dominant in almost all sea regions in 2023, even though the composition of the short sea shipping cargo varies among the sea regions. The exception concerns the Baltic Sea for Ro-Ro units. While liquid bulk goods accounted for 50% of total short sea shipping of goods in the Black Sea, the comparable figure for the Atlantic Ocean was only 32% of the total. By contrast, the share of dry bulk goods in the short sea shipping of each sea region is more evenly distributed, with a range from 15% in the Mediterranean Sea to 40% in the Black Sea (Figure 7).
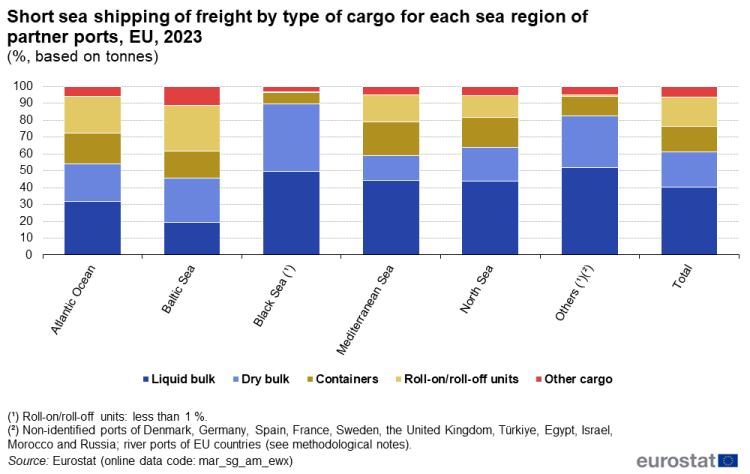
(%, based on tonnes)
Source: Eurostat (mar_sg_am_ewx)
Goods transported in containers accounted for 20% of the short sea cargo in the Mediterranean Sea in 2023, while it only made up 7% of short sea shipping in the Black Sea. Similarly, goods transported on Ro-Ro units accounted for 27% of short sea shipping in the Baltic Sea. By contrast, short sea shipping of goods on Ro-Ro units was barely registered in the Black Sea (less than 1%).
Short sea shipping of containers in the main EU ports decreased by 3.3% between 2022 and 2023
In terms of number of twenty-foot equivalent units (TEUs), short sea shipping of containers in the main EU ports decreased by 3.3% between 2022 and 2023, to 30.7 million TEUs).Loaded containers decreased by 3.1%, to 24.7 million TEUs, in 2023 compared with the previous year and transport of empty containers decreased by 4.3% to 6.1 million TEUs (Figure 8). Please note that the figures and growth rates may be influenced by changes in data quality for certain countries (see methodological notes).
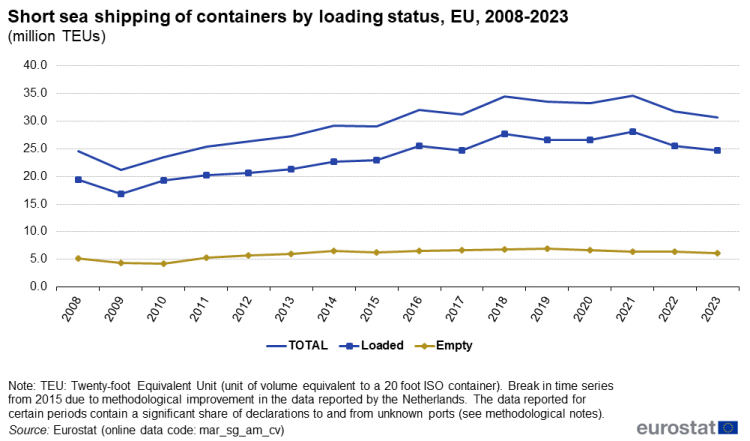
(million TEUs)
Source: Eurostat (mar_sg_am_cv)
In 2023, Italy was the major country for short sea shipped goods in containers in the EU, with 6.6 million TEUs, with an increase of 3.7% compared with the previous year. Spain followed with 5.4 million TEUs and then Germany with 4.4 million TEUs recorded in their main ports (Figure 9).
Decreases in 2023 compared with 2022 were observed in 11 out of the 22 maritime EU Member States. The most noticeable decrease was observed for Estonia (-21.5%), followed by Denmark (-15.2%), the Netherlands (-9.9%) and Spain (-8.7%). By contrast, Poland (+26.6%), Malta (+19.0%), Romania (+12.7%) and Bulgaria (+10.7%) recorded substantial growth in short sea shipping of containers (in TEUs) compared with 2022. It should be noted that France reported a significant share of declarations to and from unknown ports in 2023, impacting the comparability between 2022 and 2023 (see methodological notes).
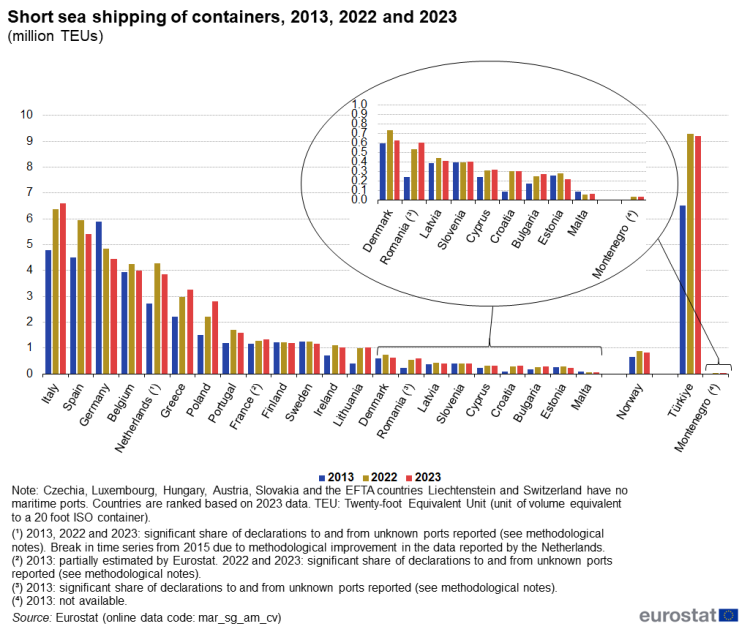
(million TEUs)
Source: Eurostat (mar_sg_am_cv)
At EU level, the loaded containers represented 80% of all containers short sea shipped (in TEUs) in 2023 (Figure 10). All reporting countries transported more loaded containers than empty ones. Italy had the highest share of loaded containers (99%) while Lithuania had the lowest (59%).
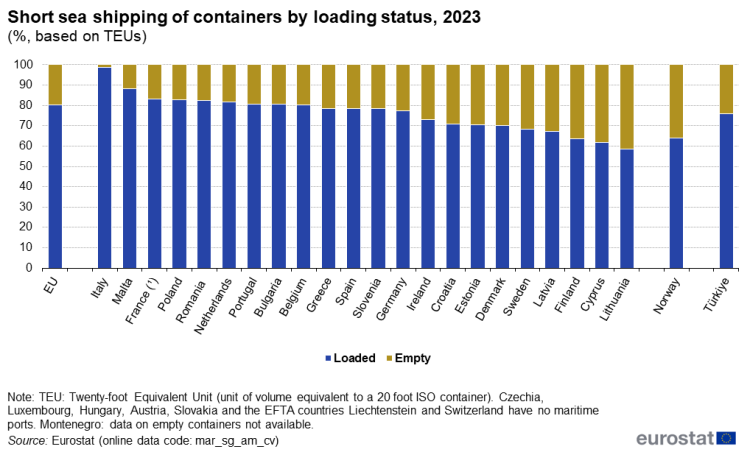
(%, based on TEUs)
Source: Eurostat (mar_sg_am_cv)
Source data for tables and graphs
Data sources
The statistics in this article are based on data collected under Directive 2009/42/EC of 6 May 2009 on statistical returns in respect of carriage of goods and passengers by sea. The relevant data on port of loading and unloading of the goods is mainly collected for main ports, passengers by sea. The relevant data on port of loading and unloading of the goods is mainly collected for main ports, which are defined as ports handling more than one million tonnes of goods annually. Data are collected at level of statistical ports.
The short sea shipping (SSS) statistics present seaborne transport of goods between
- main ports in the maritime EU Member States
- main ports in the maritime EU Member States and non-EU partner ports situated in geographical Europe or in non-European countries on the Mediterranean and on the Black Sea.
In consequence, the article covers short sea shipping of goods to and from main ports in the 22 maritime EU Member States (Czechia, Luxembourg, Hungary, Austria and Slovakia have no maritime ports). The partner ports are situated
- in the maritime EU Member States
- in the maritime EFTA countries Iceland and Norway
- in the maritime candidate countries Albania, Georgia, Moldova, Montenegro, Türkiye and Ukraine
- in the United Kingdom (European ports)
- on the Baltic Sea (Russia)
- on the Mediterranean (Algeria, Egypt, Israel, Lebanon, Libya, Morocco, Occupied Palestinian territories, Syria, and Tunisia)
- on the Black Sea (Georgia, Moldova, Russia and Ukraine).
In addition to the maritime EU Member States, similar short sea shipping statistics are also available for seaborne transport to and from main ports in Norway, Montenegro and Türkiye.
The definition of short sea shipping is derived from the Communication of the Commission COM (1999) 317 on the development of Short Sea Shipping in Europe. In consequence, the concept of short sea shipping includes both regular short sea shipping and feeder services (short sea shipping between ports in order for freight to be consolidated or redistributed to or from a deep sea service in one of the ports in a network [hub ports]). The category other seaborne transport in the tables and figures includes both deep sea shipping and transport with unidentified partner ports (unknown ports).
Sea regions
The following sea regions have been taken into account to group the short sea shipping partner ports: the Baltic, the North Sea, the Atlantic Ocean (including the English Channel and the Irish Sea), the Mediterranean and the Black Sea.
1. The Baltic:
- Danish ports below the Helsingborg–Korsør–Nyborg–Kolding line (including Helsingør).
- All ports of Finland, Estonia, Latvia, Lithuania and Poland as well as German and Russian ports on the Baltic.
- The Swedish ports on the Baltic from Helsingborg (included).
2. The North Sea:
- All ports of Norway, the Netherlands and Belgium as well as the ports of Germany on the North Sea.
- Swedish ports on the North Sea from Helsingborg (excluded).
- Danish ports on north of the Helsingborg–Korsor–Nyborg–Kolding line and North Denmark (excluding Helsingør). Faroe Islands.
- United Kingdom: ports on the east coast of Great Britain from Ramsgate (included) to Cape Wrath in Scotland, the Shetland Islands and Orkney Islands.
3. The Atlantic Ocean:
- All ports of Ireland, Portugal (including Açores and Madeira) and Iceland.
- French ports on the Atlantic Ocean and on the Channel, up to the Belgian border.
- Spanish ports on the Atlantic Ocean to Tarifa (included); Canary Islands are included.
- United Kingdom: ports of Great Britain on the Channel (from Ramsgate excluded) and the west coast to Cape Wrath in Scotland; ports in Northern Ireland.
4. The Mediterranean:
- Spanish ports on the Mediterranean from Tarifa (excluded).
- French ports on the Mediterranean.
- All ports of Malta, Italy, Slovenia, Croatia, Montenegro, Albania, Greece, Cyprus, Syria, Lebanon, Occupied Palestinian territory, Libya, Tunisia, Algeria and Gibraltar.
- Ports of Morocco, Egypt and Israel on the Mediterranean.
- Ports of Türkiye on the Mediterranean (including the ports on the Bosporus).
5. The Black Sea:
- All Black Sea ports excluding the ports on the Bosporus.
6. Others:
- Non-identified ports of Denmark, Germany, Spain, France, Sweden, the United Kingdom, Israel, Morocco, Russia, Türkiye and Egypt; river ports of EU countries.
Please note that ports located in Morocco–West Africa, Egypt–Red Sea, Israel–Red Sea and Russia–Barents and White Seas are not part of the European short sea shipping area.
Comparability over time and between countries
Exclusion of double counting
All the results shown in this publication are calculated on the basis of the statistics declared by main ports vis-à-vis their partner ports. In order to estimate the seaborne transport of goods between the ports, any double counting of the same cargo being declared by both the port of loading as outward movements of goods and the port of unloading as inwards movements of goods has to be excluded. In cases where data is collected for both the port of loading and the port of unloading, the double counting is excluded by only taking the inwards movements in ports into account when calculating the total transport on the maritime routes in question. The algorithm for this exclusion of double counting is applied at statistical port level.
The total SSS per country excludes the double counting in the national transport declarations. The total SSS for the EU excludes the double counting of national and international intra-EU transport declarations. The total aggregates per country may therefore differ from the sum of inwards and outwards declarations for the country. Similarly, the total aggregates for the EU may differ from the sum of inwards and outwards declarations and also from the sum of the country totals.
Specific remarks on figures
Figures 1 and 2: The category 'other seaborne transport' includes both deep sea shipping and transport with unidentified partner ports (unknown ports). It should be noted that the share of unknown partner ports in the total seaborne transport, at EU level, was 2% between 2008 and 2014, 2019 and 2023, 3% in 2015 and 2018, 1% between 2020 and 2021 and 4% in 2016, 2017 and 2022. At EU level, the share of unknown partner ports in the total seaborne transport of containers was 3% in 2009 and 2010, 4% in 2008, between 2015 and 2018, 2020 and 2021, 5% in 2011, 2019 and 2023, 6% in 2022,, 7% in 2012, 8% between 2013 and 2014.
Figures 6 and 7:
- Liquid bulk: liquefied gas, crude oil, oil products and other liquid bulk goods.
- Dry bulk: ores, coal, agricultural products (e.g. grain, soya, tapioca), other dry bulk goods.
- Large containers: 20 ft freight units, 40 ft freight units, freight units > 20 ft and < 40 ft, freight units > 40 ft.
- Ro-Ro mobile units:
a) Mobile self-propelled units: road goods vehicles and accompanying trailers, passenger cars, motorcycles and accompanying trailers/caravans, passenger buses, trade vehicles (including import/export motor vehicles), live animals on the hoof, other mobile self-propelled units.
b) Mobile non-self-propelled units: unaccompanied road goods trailers and semi-trailers, unaccompanied caravans and other road, agricultural and industrial vehicles, rail wagons, shipborne port-to-port trailers and shipborne barges engaged in goods transport, other mobile non-self-propelled units.
- Other cargo: forestry products, iron and steel products, other general cargo. The category 'other cargo' includes data for unknown type of cargo.
Country specific remarks
Explanatory notes for countries are available in the metadata on the Eurostat website. Additional information related to this article are mentioned hereafter.
Significant shares of declarations to and from unknown partner ports have several consequences: the volume of SSS and its share in total seaborne transport are probably underestimated and the change rates of SSS may not be reliable.
Spain (ES) For container statistics, the share of unknown partner ports was 7% in 2013, 2022 and 2023.
France (FR) Taking into account the definition of European short sea shipping, the figures do not include transport with the French overseas territories (Départements d'Outre Mer/Collectivités d'Outre Mer). The quarterly data for port activity in France have been partially estimated by Eurostat for the period 2009-2016. The data reported by France contain a significant share of declarations to and from unknown partner ports in 2013 (8%) and 2023 (11%). This share was 31% in 2022. For container statistics, the share of unknown partner ports was 3% in 2012, 31% in 2022 and 15% in 2023.
Cyprus (CY) For container statistics, the share of unknown partner ports was 7% in 2013. This share was less than 1% in 2022 and 2023.
Netherlands (NL) For container statistics, the share of unknown partner ports was significant in 2013 (36%). This share was less than 18% in 2022 and 2023.
Romania (RO) The data reported by Romania contain a significant share of declarations to and from unknown partner ports: 4% in 2012. This share was less than 1% in 2022 and 2023. For container statistics, the share of unknown partner ports was 39% in 2013. This share was less than 1% in 2022 and 2023.
Sweden (SE) For container statistics, the share of unknown partner ports was 9% in 2022 and 8% in 2023, while it was less than 1% in 2013.
Context
The content of this statistical article is based on data collected under the EU maritime transport statistics Directive (Directive 2009/42/EC of 6 May 2009 on statistical returns in respect of carriage of goods and passengers by sea), which is a recast of the original Council Directive 95/64/EC of 8 December 1995.
The basic legal act (Directive 2009/42/EC) was amended by:
- Commission Decision 2010/216/EC of 14 April 2010 OJ L 94 of 15.4.2010 pp. 33-40
- Regulation (EU) No 1090/2010 of 24 November 2010 OJ L 325 of 09.12.2010 pp. 1-3
- Commission Delegated Decision 2012/186/EU of 3 February 2012 OJ L 101 of 11.4.2012 pp. 5-14.
The following legal acts include respectively the last official version of the list of ports and several dissemination aspects:
- Commission Delegated Decision (EU) 2018/1007 of 25 April 2018 (Port list) OJ L 180 of 17.7.2018 pp. 29-71
- Commission Decision 2001/423/EC of 22 May 2001 (on dissemination) OJ L 151 of 07.06.2001 p. 41
Explore further
Other articles
Database
- Transport, see:
- Maritime transport (mar)
- Maritime transport - main annual results (mar_m)
- Maritime transport - short sea shipping - Main annual results (mar_s)
- Maritime transport - passengers (mar_pa)
- Maritime transport - goods (mar_go)
- Maritime transport - vessel traffic (mar_tf)
- Maritime transport - regional statistics (mar_rg)
Thematic section
Methodology
- Maritime transport (ESMS metadata file — mar_esms)
- Reference Manual on Maritime Transport Statistics
- Glossary for transport statistics - 5th edition - 2019
