Flash estimates of income inequalities
Data extracted in July 2023
Planned article update: July 2025
Highlights
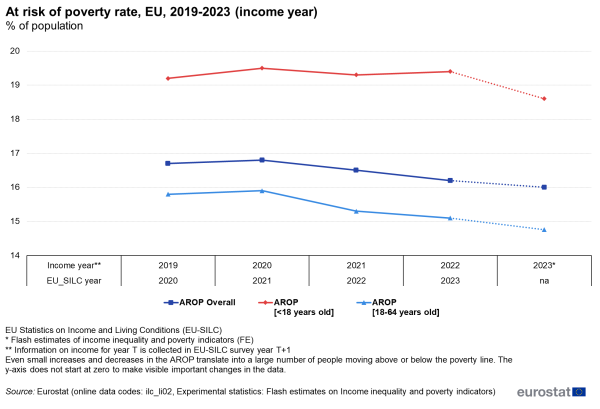
Eurostat’s income flash estimates show that the at risk of poverty rate in the EU is likely to have decreased slightly (-0.2 pp), with a stronger decrease for child poverty (-0.8 pp) from 2022 to 2023 (income year).
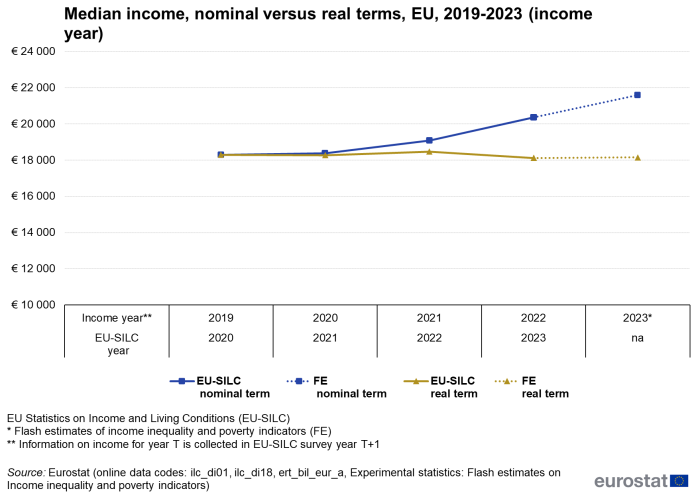
Flash estimates indicate that in 2023 (income year) the EU median disposable household income increased by 6.0 % in nominal terms while remaining stable in real terms.
This article presents experimental statistics (flash estimates) on income inequality and poverty indicators for 2023, produced by Eurostat using microsimulation and nowcasting techniques. Flash estimates refer to the year-on-year change from 2022 to 2023 for income-based indicators and complement the 2022 income data from the European Union Statistics on Income and Living Conditions (EU-SILC) collected in 2023. The flash estimates aim to give preliminary information on income trends until the corresponding data from the EU-SILC become available (2024). The methodology considers both the effect of the labour market trends on employment income and changes made to social protection schemes by national governments in 2023. For the latter, Eurostat uses the EUROMOD microsimulation model [1], which provides the effects of direct taxes, social security contributions and benefits on households income. Throughout the remainder of the article, income year is used as the reference period for the flash estimates.
Full article
Key findings
Flash estimates for 2023 show a significant overall increase of 6.0 % from the previous year in median equivalised disposable income at EU level, with positive changes estimated for all countries. Estimates of the at risk of poverty rate (AROP) suggest it remained stable at EU level, with a slight, not statistically significant decrease of 0.2 percentage points (pp). Most countries show a stable AROP, or not significant changes. Estimates show a significant decrease in 6 countries (the Netherlands, Germany, Estonia, Spain, Portugal and Finland), and an increase in 4 countries (Greece, France, Luxembourg, and Austria). At EU level, a similar trend is estimated in the AROP for individuals aged 18 to 64 years, while the AROP rate for children (<18 years old) is expected to have declined by 0.8 pp. It should be noted that these indicators are based on nominal disposable income and do not incorporate changes in the cost of living and purchasing power.
In real terms, the nowcasted median disposable income for 2023 is estimated to have increased in 16 countries, decreased in 5 and remained stable in 6. At the EU level, the median income in real terms shows a slight increase of 0.2 % in 2023 compared to 2022. This diversity reflects the heterogeneous impact of inflation across countries. At the EU level, 2023 still sees rising prices for food and non-alcoholic beverages (12.6 %), while prices for electricity, gas, and other fuels show a moderate annual average rate of change (1.4 %), following the significant increases in 2022 (42.4 %).
Produced by Eurostat as experimental statistics, flash estimates aim to provide preliminary information for the latest income year until the corresponding data from the EU-SILC becomes available. To reflect the inherent uncertainty of model-based estimates, flash estimates are released as Rounded Uncertainty Intervals (RUI) rather than point estimates. They indicate the direction and magnitude of change throughout the article. A number of caveats and assumptions [2] should be considered when interpreting the flash estimates. For more details, see the methodological note.
At risk of poverty rate
Eurostat produced flash estimates on income in 2023 to predict the change in the AROP (overall and breakdowns) for the upcoming 2024 EU-SILC. As shown in Figure 1, the flash estimates show a very slight, not statistically significant drop in AROP overall, based on 2023 income estimates at EU level. A similar trend is estimated in the AROP for individuals aged 18 to 64 years, which shows slightly lower levels. On the other hand, the AROP rate for children (<18 years old) exhibits the strongest estimated annual decrease from 2022 to 2023, declining by 0.8 pp.
Source: Eurostat (ilc_li02) and Experimental statistics: Flash estimates on Income inequality and poverty indicators
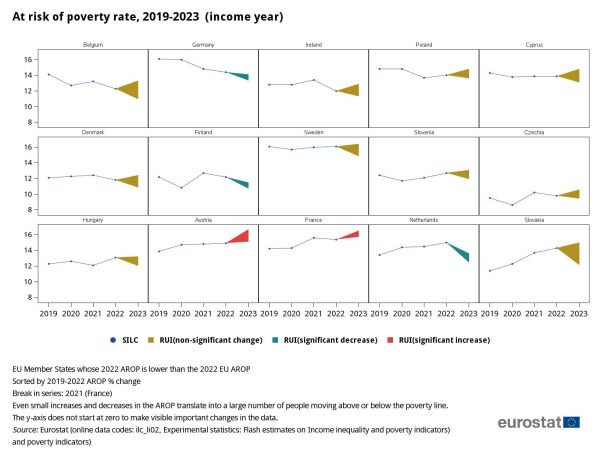
The two figures below (2a and 2b) depict the time series for AROP at country level between 2019 and 2023 (income years). They include EU-SILC values for 2019-2022 and 2023 income flash estimates as intervals. For visualisation purposes, EU countries have been clustered into two groups by AROP for 2022 income. Figure 2a includes 15 countries where the value for the 2022 AROP income year is below the EU average. Within this group:
- for 2019-2022 (income years), the largest decreases are in Belgium and Germany (-1.8 pp and -1.7 pp respectively) and the largest increases are in Slovakia and the Netherlands (2.9 pp and 1.6 pp respectively);
- for 2023 (income year), flash estimates show a significant decrease for Germany, Finland, and the Netherlands (highlighted in green), and a significant increase for Austria and France (highlighted in red).
Source: Eurostat (ilc_li02) and Experimental statistics: Flash estimates on Income inequality and poverty indicators
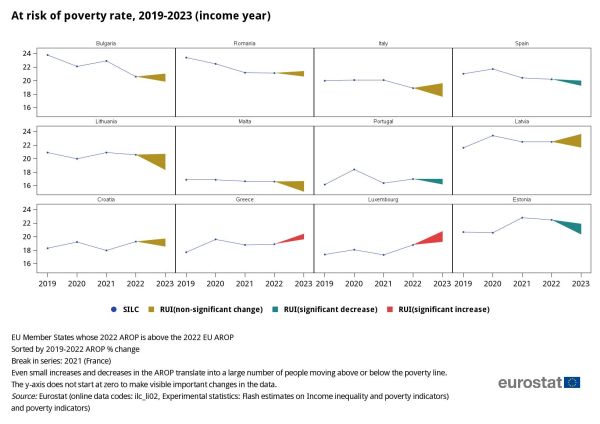
Figure 2b includes 12 countries where the value for the AROP in 2022 is above the EU average. Within this group:
- in the 2019-2022 period (income years), the largest falls are in Bulgaria (-3.2 pp) and Romania (-2.3 pp), while the largest increase is in Estonia (1.8 pp);
- for 2023, flash estimates show a significant decrease for Spain, Portugal, and Estonia (highlighted in green), and a significant increase for Greece, and Luxembourg (highlighted in red).
Source: Eurostat (ilc_li02) and Experimental statistics: Flash estimates on Income inequality and poverty indicators
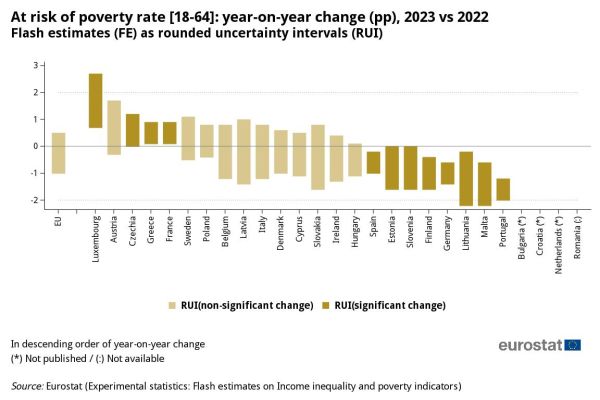
At the aggregate EU level, the AROP breakdown for the working-age population (18-64) is estimated to have decreased slightly by 0.3 pp in 2023. As shown in Figure 3, a statistically significant increase is estimated for Luxembourg, Czechia, Greece, and France (in descending order), while a statistically significant decrease is estimated for Spain, Estonia, Slovenia, Finland, Germany, Lithuania, Malta, and Portugal (in descending order).
Source: Eurostat: Experimental statistics: Flash estimates on Income inequality and poverty indicators
Improvements in employment income sustain the overall estimated growth in disposable income
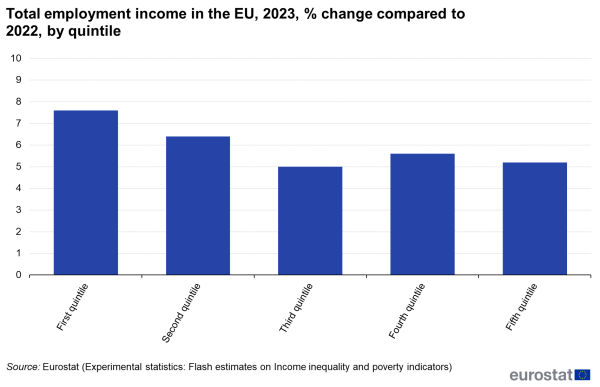
Total employment income (including wages and self-employment income) across income quintiles (based on the ranking of people in terms of their employment income) is estimated to have increased. Flash estimates show slightly higher increases for workers with lower earnings.
Source: Eurostat: Experimental statistics: Flash estimates on Income inequality and poverty indicators
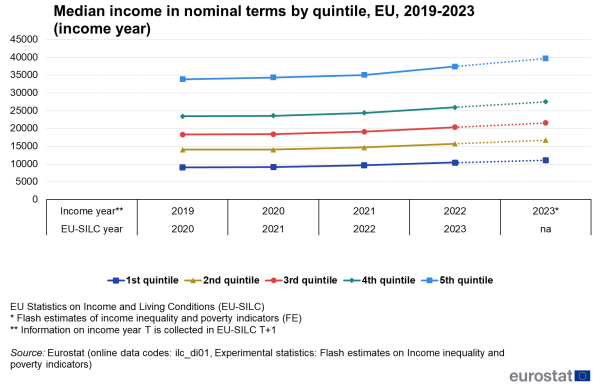
Figure 5 provides a comprehensive overview of nominal median income (equivalised disposable income) across different income quintiles in the EU from 2019 to 2023 (income year).
For 2023, the flash estimates indicate consistent and similar year-on-year growth for all the income quintiles: first and second quintiles are estimated to have grown by 6.3 % compared to the previous year, the third (median) and forth quintile by 6.0 %, and the fifth quintile by 6.1 %.
Source: Eurostat (ilc_di01) and Experimental statistics: Flash estimates on Income inequality and poverty indicators
Median income is estimated to have increased significantly at EU level and across all countries
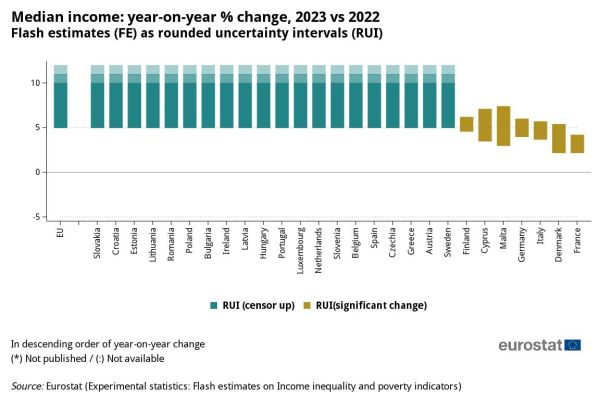
Figure 6 presents the expected change in median disposable income in nominal terms by country. In all countries, a statistically significant increase is estimated for 2023 compared with 2022 (income year). For the EU as a whole, median disposable income is estimated to have risen by 6.0 % in 2023, with 20 countries registering increases above 5 % (in green).
Source: Eurostat: Experimental statistics: Flash estimates on Income inequality and poverty indicators
EU median income in real terms nowcasted to remain stable in 2023
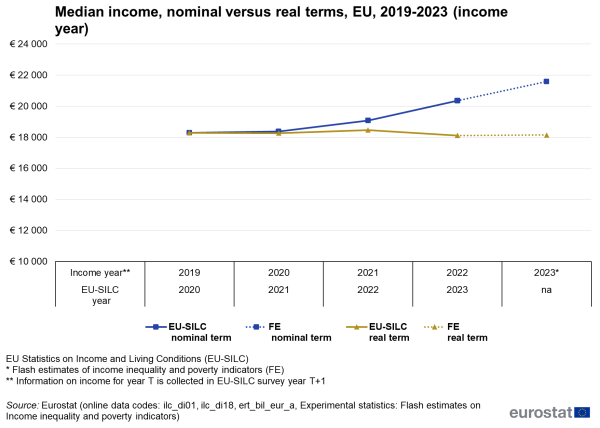
The estimated 6.0 % nominal rise in median income across the EU translates into stable median income in real terms, estimated to have risen by 0.2 % in 2023 (see Figure 7). At EU level in 2023, prices were still rising for food and non-alcoholic beverages (12.6 %), while prices for electricity, gas, and other fuels showed more moderate annual average rate of change (1.4 %) following the significant increases in 2022 (42.4 %).
Source: Eurostat (ilc_li01), (ilc_di18), (ert_bil_eur_a) and Experimental statistics: Flash estimates on Income inequality and poverty indicators
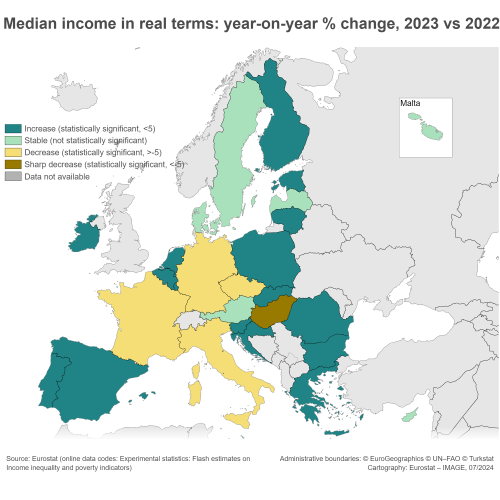
Map 1 compares the estimated values for median equivalised disposable income for 2023 in real terms at country level. As seen previously, though nominal estimates indicate positive changes for all countries, the real-term analysis reveals a more varied picture. Specifically, median disposable income is estimated to have increased in 16 countries and decreased in 5 (Czechia, Germany, France, Italy and Hungary). In 6 countries (Denmark, Cyprus, Latvia, Malta, Austria and Sweden), the real median income is thought to have remained stable. This diversity underscores the variable impact of inflation across the EU.
Source: Eurostat: Experimental statistics: Flash estimates on Income inequality and poverty indicators
Support measures to cope with rising inflation and the cost of living
In the standard methodology for flash estimates produced by Eurostat, policies and income support measures for households are simulated via EUROMOD. A comprehensive tax-benefit microsimulation model for the EU, EUROMOD simulates direct taxes and social insurance contributions, as well as most cash social benefits. An assessment of the impact of tax-benefit systems on income distribution and labour incentives within the EU can be found in the EUROMOD baseline report 2023, a Joint Research Centre report that provides baseline results from EUROMOD version I6.0+, focusing on income poverty, inequality and work incentive indicators.
For 2023, EUROMOD simulates the income support measures implemented at national level to shield consumers from rising and volatile energy prices. Anti-inflationary measures include indexation, lump sum benefits/transfers, social assistance benefits, housing benefits, child/family allowances, tax credits for electricity and adjustments to income tax brackets. These measures often target minimum living standards. This is the case for increases in unemployment benefits and minimum income levels, which support vulnerable sub-groups and low-income households. In particular, EUROMOD indicates a general positive impact for simulated family and child allowances in most EU countries in 2023. More information on these measures and on the policies simulated in EUROMOD in different countries can be found in the EUROMOD Country Reports.
Note that standard income and poverty indicators in nominal terms do not account for changes in the cost of living. By contrast, inflation-adjusted indicators, such as median income in real terms at least partly reflect the impact of rising prices and related compensation measures (e.g. VAT cuts, social tariffs and price caps).
Inflation continues to increase in 2023
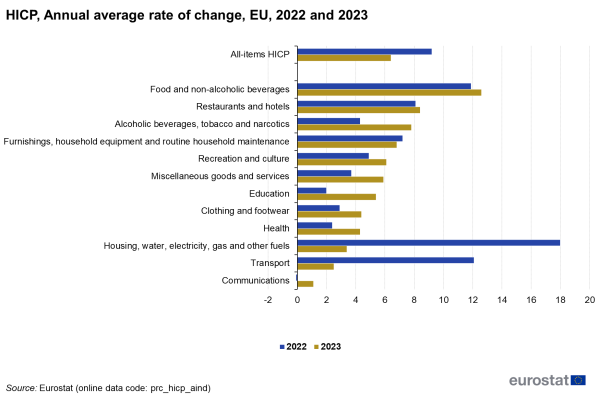
Figure 8 illustrates the Harmonised Index of Consumer Prices (HICP) annual average rate of change for its main components in the EU in 2022 and 2023. The data highlights significant inflationary trends, with notable increases across several categories.
In 2023, the overall HICP saw a substantial rise, reflecting broader inflationary pressures across the EU. Among the 12 main headings, the biggest rise in consumer prices in 2023 was for food and non-alcoholic beverages – up 12.6 % on average and continuing the upward trend in 2022. Restaurants and hotels followed, with an average increase of 8.4 %, while alcoholic beverages and tobacco rose by an average of 7.8 %. Housing, water, electricity, gas and other fuels also saw a substantial but more moderate rises (3.4 % on average), following the dramatic price hikes in 2022 (18 %).
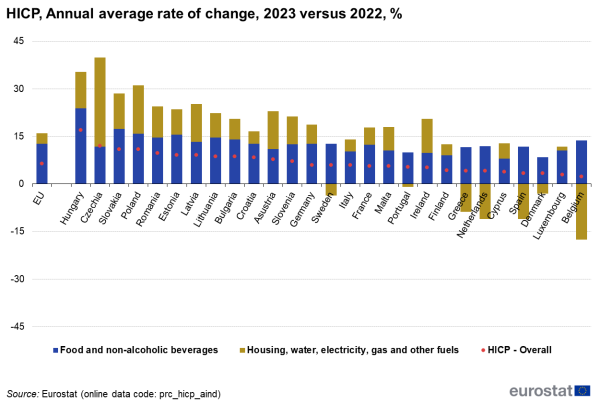
Figure 9 illustrates the annual average rate of change in 2023 compared to 2022 for the overall HICP (red dots), and the two main contributing headings for the last 2 years: ’Food and non-alcoholic beverages’ (blue bars), and ’Housing, water, electricity, gas, and other fuels’ (gold bars). The chart reveals a very heterogeneous situation across the EU, with the overall HICP ranging from 17 % in Hungary down to 2.3 % in Belgium.
Among the HICP main headings, the EU annual average rate of change is particularly high (12.6 %) for ‘food and non-alcoholic beverages’, with all countries experiencing significant increases. This rise was especially pronounced in Hungary (23.8 %), Slovakia (17.3 %), Poland (15.9 %), and Estonia (15.6 %). Housing and utility costs also increased considerably in 20 countries, but went down in 7 countries (Belgium, Denmark, Greece, Spain, the Netherlands, Portugal and Sweden) despite the overall inflationary trend.
The impact of these headings on the HICP overall varies across countries due to their different weights, which means the contribution of each component to the overall HICP can differ from one country to another.
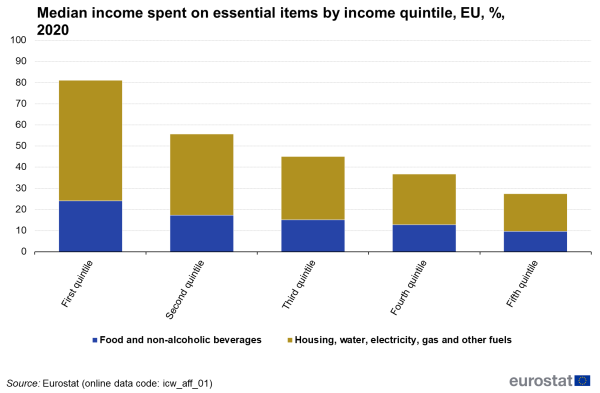
Figure 10 illustrates the median share of disposable income spent on specific essential items by households within the EU across different income quintiles, based on the latest Eurostat figures from the 2020 wave of the joint income, consumption and wealth experimental dataset [3].
Households in the lowest income quintile spent more than the 80 % of their disposable income on ‘Food and non-alcoholic beverages’ (blue bars) and ‘Housing, water, electricity, gas, and other fuels’ (gold bars). There is a clear inverse relationship between income level and the share of income spent on essential services. As income increases, the percentage of income spent on essential items decreases. This trend highlights the greater financial burden faced by lower-income households in meeting basic needs, compared to their higher-income counterparts.
Recent price rises are thus more likely to affect the material wellbeing of low-income households, as they spend a larger portion of their income on these essential items.
Source: Eurostat (icw_aff_01)
Feedback
To help Eurostat improve these experimental statistics, users and researchers are kindly invited to give us their feedback by email.
Source data for tables and graphs
Data sources
The EU-SILC indicators provide insights into the economic wellbeing and other living conditions on EU residents based on data collected during a specific year, denoted as N. This data encompasses both the characteristics of households for that year (N) and the income from the preceding year, N 1. The income for year N-1 is an estimate for income of year N within the EU-SILC. To consider differences in household size and composition and thus enable comparisons of income levels, the concept of equivalised disposable income is used. It is based on the total net (also referred to as disposable) household income divided by the number of 'equivalent adults', using a standard (equivalence) scale.
Eurostat flash estimates complement structural and detailed indicators from the EU-SILC to capture the latest income changes. They offer early indicative results for income year N, supporting the EU's policy agenda until the EU-SILC data become available. Flash estimates are based on modelling and microsimulation techniques [4] that consider the complex interaction between labour market developments, economic and monetary policies, and the implementation of social reforms. In terms of data sources, Eurostat uses the latest information on labour from the 2023 Employment and unemployment (Labour Force Survey) together with the EUROMOD microsimulation model, which provides the effects of direct taxes, social security contributions and benefits on household income.
The section of the article on inflation is based on the HICP, which is an index for measuring the change in prices of consumer goods and services acquired by households in monetary transactions. See Consumer prices - inflation for more information on this topic.
Context
Indicators on poverty and income inequality are based on EU statistics on income and living conditions (EU-SILC). The AROP is part of the at risk of poverty or social-exclusion rate defined in connection with the EU 2030 target on poverty and social exclusion (AROPE).
Providing timelier social statistics – especially indicators on income poverty and inequality – is a priority for the Commission and the European Statistical System. To better monitor the effectiveness of social policies at EU level, flash estimates offer early indicative results for income year N, until EU SILC data become available. These estimates, which are part of the experimental statistics produced by Eurostat, have a release date appreciably earlier than the survey data: i.e. flash estimates for the 2023 income year are published in June 2024, complementing the EU SILC 2023 data which refers to the 2022 income year. These estimates can be used in preliminary discussions and analysis until the final EU-SILC 2024 data for 2023 income are available in 2025.
While the standard nowcasting methodology focuses on nominal data, additional analysis in the article reflects the estimated impact of inflation in 2023. For 2023, EUROMOD includes the simulation of income measures to shield consumers from rising energy prices in several countries. These measures encompass indexation, lump sum benefits/transfers, social assistance benefits, housing benefits, children/family allowances, tax credits for electricity, and increased income tax brackets often related to minimum living standards (increase in unemployment benefits, minimum income, etc.). However, flash estimates based on EUROMOD do not account for changes in indirect taxes or household expenditures and do not capture the effects of a complete range of price-related measures, such as VAT changes, social tariffs and price caps. It should be noted that most of the policies implemented to counter inflation in 2022 were not continued in 2023 in countries such as Belgium, Bulgaria, Denmark, Estonia, Spain, Hungary, Ireland, Lithuania, Latvia, the Netherlands and Slovakia. More information on the specific policy measures simulated in EUROMOD in different countries can be found in the EUROMOD country reports.
Direct access to
Methodology
Notes
- ↑ Social benefits and taxes are simulated via the EUROMOD tax benefit model. This is maintained, developed and managed by the Joint Research Centre of the European Commission, in collaboration with Eurostat and national authorities from the EU countries.
- ↑ Incomplete information and model errors for the estimation of employment income; over-simulation and assumptions of full take-up of benefits; lack of information on the informal economy and workers who fell outside the safety net of the tax-benefit system.
- ↑ Available for 22 countries.
- ↑ The flash estimates for Romania are based on current income information collected through the Household Budget Survey (HBS – Romania) and for Sweden on the national microsimulation model.
