Farmers and the agricultural labour force - statistics
Data extracted in November 2022.
Planned article update: 28 November 2025.
Highlights

(% of all farm managers,EU. 2020)
Source: Eurostat (ef_m_farmang)
Knowing how many people are employed in agriculture is not as straightforward as it might seem and certainly not as easy as other sectors of the economy. This is explained by the fact that many farmers and farm workers pursue agriculture as a part-time activity, that many farms are family-run with family members providing help on the farm at different times of the year, and that there are seasonal peaks in labour (particularly when it comes to harvesting).
In this analysis, four distinctions are made: (i) agricultural employment (ii) the regular agricultural labour force (iii) the volume of agricultural work carried out and (iv) farm managers. Each of these sheds a light on a different aspect of those working in agriculture which can be important for policy purposes. Employment data covers employees and self-employed persons but excludes many part-time farmers and help from family members; it is a measure that allows comparisons to be made across different sectors of the economy.
The regular agricultural labour force is the broadest category that includes even those that work part-time and provide free labour, which is common for many family members of the farmer. The amount of labour actually provided can be converted into full-time labour equivalents (called Annual Work Units) to get an idea of the volume of work carried out in agricultural activities. Farm managers can be thought of as decision-making farmers.
Full article
Agriculture remains a big employer in the EU; about 8.7 million people work in agriculture
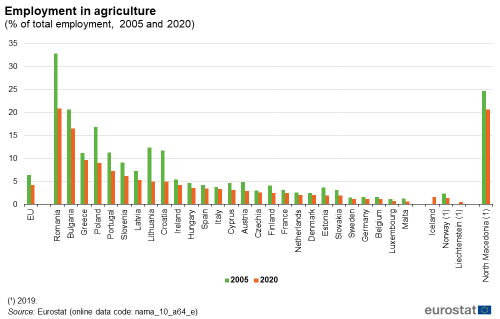
People working in agriculture (crop and animal production, hunting and related service activities) accounted for about 4.2 % of total employment in the EU in 2020 (see Figure 1), corresponding to an estimated 8.7 million persons. Agriculture is a particularly big employer in Romania, accounting for a little more than one in every five persons (20.9 %) employed in the country in 2020, as well as in Bulgaria (16.6 % of total employment), Greece (9.7 %) and Poland (9.0 %).

(% of total employment, 2005 and 2020)
Source: Eurostat (nama_10_a64_e)
Nevertheless, many more people help out on farms without being employed by them. This helps explain why the EU's regular agricultural labour force is much higher, at 17.0 million people in 2020; for many of these people, farm work only represented a minor activity. Only a relatively small proportion of this regular workforce (18.7 %) worked full-time. Indeed, when converted into Annual Work Units (AWUs) that measure the volume of work carried out in terms of full-time labour equivalents, the agricultural labour force provided work that was equivalent to 8.2 million full-time workers, similar to the total number of people employed in agriculture. It is this measure of the volume of work that is used as the labour factor in partial labour productivity measures.
Farming remains a predominantly family activity
Almost nine in every ten (86.1 %) people who worked regularly in agriculture in the EU were the sole holder (farmer) or members of his/her family in 2020. Nevertheless, there were some Member States in which a majority of regular workforce were non-family members; this was the case in Czechia (60.9 %), Slovakia (57.7 %) and France (53.6 %) [1].
Farm managers are typically male and relatively old
Farm managers are those responsible for the normal daily financial and production routines of running a farm. As such, they can be thought of as farmers; they make the decisions on what to plant or how many livestock to rear, just as much as when to buy materials and sell stock. Only one person per farm can be identified as a farm manager. Often the farm manager is also the owner of the farm but this need not be the case especially when the farm has a legal form.
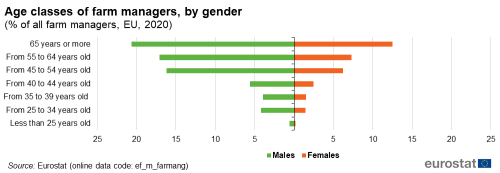
Slightly more than two thirds (68.4 %) of farm managers on the EU's 9.1 million holdings were male in 2020. A majority (57.6 %) of farm managers (both sexes combined) were at least 55 years of age. Only 11.9 % of farm managers (both sexes combined) were young farmers (see Figure 2) - defined here as those under the age of 40 years.

(% of all farm managers, EU, 2020)
Source: Eurostat (ef_m_farmang)
Young farmers were particularly scarce in Cyprus (5.1 % of all farm managers), Portugal (6.4 %), Greece (7.2 %) and Spain (7.7 %). They were more common in Austria (23.4 %) and Poland (21.0 %). By contrast, there was a relatively high proportion of farmers of 65 years of age or more in many Member States; in Portugal they represented one half (50.3 %) of all farmers and represented two-fifths or more of farmers in Cyprus (46.4 %), Spain (41.3 %) and Romania (39.6 %). These top heavy age structures underline the policy interest in farm succession and the need to encourage a new generation of farmers.
The gender imbalance among farmers is particularly strong in the Netherlands; only one in every twenty farmers (5.6 %) was female in 2020. Female farmers were also relatively uncommon in Malta (10.8 % of all farmers), Germany (10.8 %), Denmark (10.9 %) and Ireland (11.4 %). There was a closer gender balance in Latvia and Lithuania (with 44.8 % and 44.9 % shares respectively of farmers that were female).
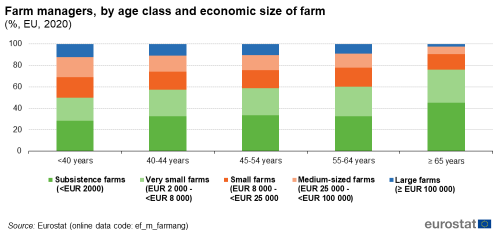
Older farm managers tend to work on the smallest farms (when measured in economic terms or in relation to their agricultural area), which are characterised by subsistence households and low levels of agricultural income. Three-quarters (76.0 %) of the EU's farm managers that were 65 years of age or older worked on either subsistence farms or very small farms in 2020 (see Figure 3).

(%, EU, 2020)
Source: Eurostat (ef_m_farmang)
A higher share of young farmers managed medium and large-sized farms (31.1 %) than was the case in other age classes. Indeed, the share was progressively lower through each older class of farm manager, with only 9.6 % of farmers aged 65 years and older managing medium and large-sized farms. In part, this distinction might be explained by the fact that young farmers had higher levels of educational attainment in terms of full agricultural training (21.4 % vs 3.6 % for over 65 year olds) and had followed up-to-date professional training courses including those on new and innovative farming practices.
Very few farm managers in the EU have full agricultural training
Most farm managers in the EU only have practical experience; this was the case for seven in every ten (72.3 %) of them in 2020. Only one in ten (10.2 %) of farm managers had full agricultural training, and the rest (17.5 %) had basic agricultural training. In some Member States, the level of agricultural training among farm managers was particularly low; in Romania and Greece only 0.7 % of farm managers respectively had full agricultural training, the overwhelming majority (94.5 % and 94.1 % respectively) having only practical experience. Only a few Member States had relatively high proportions of farm managers with full agricultural training; these were the Netherlands (62.6 %), Luxembourg (53.1 %), France (38.4 %) and Czechia (35.8 %).
Fewer farms, fewer farmers
As the number of farms in the EU has declined, so has the number of farmers and those employed in agriculture; the share of people employed in agriculture fell from 6.4 % of total EU employment in 2005 to 4.2 % in 2020
Between 2005 and 2020, the volume of work carried out by the EU's labour force in agricultural activities declined by 4.5 million AWUs, a decline of a little more than one third (about -36 %). Almost three quarters (about 72 %) of these full-time equivalent job losses occurred in the Member States that joined the EU after May 2004. The biggest losses were in Romania (about 1.5 million AWUs), Poland (about 0.9 million AWUs) and Bulgaria (about 0.4 million AWUs, which represented a 70 % decline).
The impact of this decline in labour on agricultural output is reviewed within the article on agricultural productivity in the article on the performance of the agricultural sector.
Young farmers remain scarce in the EU; in 2005, 7.3 % of farm managers in the EU were under the age of 35 years old (a ceiling taken in order to enable comparisons) but this share had fallen to 6.5 % in 2020. Nevertheless, this was higher than in 2016 (a 5.1 % share), with numbers increasing between 2016 and 2020 for female farm managers in all age groups below 55 years, whereas for male farm managers increases were observed for the two age classes below 35 years.
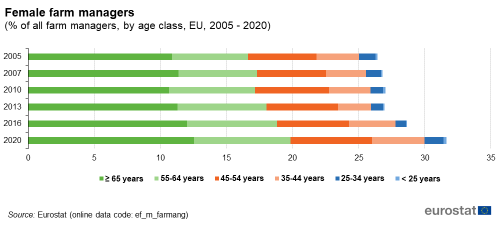
Against the backdrop of a sharp decline in the overall number of farmers, the share of farm managers that are women increased from 26.4 % in 2005 to 31.6 % in 2020 (see Figure 4).

(% of all farm managers, by age class, EU, 2005 - 2020 )
Source: Eurostat (ef_m_farmang)
Source data for tables and graphs
Data sources
Farm Structure Survey (FSS) data, including detailed data on farm labour characteristics, are collected from agricultural censuses every ten years and from sample surveys twice in between. The main tables from the Agricultural Census for 2020 are gradually being published and are used in this analysis. Additional information comes from National Accounts employment data by industry and agricultural labour input statistics gathered for the Economic Accounts for Agriculture.
Context
Farming is an activity that is about growing crops and raising livestock. It is the business of providing key primary ingredients for the food that we eat and much of what we drink. Farming draws on a set of resources to produce these agricultural goods, as well as agricultural services. These resources or 'factors of production' can be broadly categorised as land, labour, knowledge, capital and entrepreneurship.
Within the EU, the farming sector operates under the Common Agricultural Policy (CAP). Just as agriculture needs to keep pace with scientific and technological advances, so the CAP needs to respond to developing challenges. The CAP has been reformed a number of times over the years. On 2 December 2021, the European Commission proposals for further changes beyond 2020 were adopted and will enter into force on 1st January 2023. The nine objectives of this new CAP highlight the central role of farms and farmers in meeting challenges to do with climate change, with creating vibrant rural areas, with preserving rural landscapes, with environmental care and with protecting food and health quality. These economic, environmental and climate-related and socio-economic challenges require that farmers be at the heart of Europe's rural communities. This helps explain why support for the generational succession of farms and encouragement of a new generation of farmers is also a key part of the new CAP proposal.
Direct access to
- Agriculture (agri), see:
- Farm structure (ef)
- Dedicated section agriculture [1]
- Farm structure (ESMS metadata file — ef_esms)
- Farm structure — Methodology of Community surveys
- National methodological reports
Main legislation
- Regulation 1166/2008 of the European Parliament and of the Council on farm structure surveys and the survey on agricultural production methods (farm structure survey from 2010 to 2016)
- Summaries of EU Legislation: EU integrated farm statistics
- Regulation No 378/2014 of the European Parliament and of the Council of 3 April 2014 amending Regulation (EC) No 1166/2008 as regards the financial framework for the period 2014-2018
- Commission Regulation No 715/2014 of 26 June 2014 amending Annex III to Regulation (EC) No 1166/2008 of the European Parliament and of the Council on farm structure surveys and the survey on agricultural production methods, as regards the list of characteristics to be collected in the farm structure survey 2016
Implementing legislation
- Commission Regulation 1200/2009 implementing Regulation 1166/2008 on farm structure surveys and the survey on agricultural production methods (farm structure survey from 2010 to 2016)
- Commission Regulation 2015/1391 amending Regulation (EC) No 1200/2009
Related and older legislation
- Council Regulation 1217/2009 setting up a network for the collection of accountancy data on the incomes and business operation of agricultural holdings in the European Community
- Summaries of EU Legislation: Farm incomes and operations - EU statistics
- Commission Delegated Regulation 1198/2014 of 1 August 2014 supplementing Council Regulation (EC) No 1217/2009 setting up a network for the collection of accountancy data on the incomes and business operation of agricultural holdings in the European Union
- Commission Implementing Regulation 220/2015 of 3 February 2015 laying down rules for the application of Council Regulation (EC) No 1217/2009 setting up a network for the collection of accountancy data on the incomes and business operation of agricultural holdings in the European Union
- The common agricultural policy: 2023-27
- Challenges for agriculture and rural areas: Economic dimensions - European Commission
- Challenges for agriculture and rural areas: Environment and climate dimensions - European Commission
- Challenges for agriculture and rural areas: Socio-Economic dimensions - European Commission
- CAP specific objective explained - Brief No 7
Notes
- ↑ For more details on similar analyses, see the Statistics Explained article on family farming in the EU.