European Neighbourhood Policy - East - population statistics
Data extracted in February 2023.
Planned article update: April 2024.
Highlights
Among the European Neighbourhood Policy-East (ENP-East) countries in 2021, people aged 65 years and over made up between 7.5 % in Azerbaijan and 17.4 % in Ukraine of the total population. In the EU, people in this age group accounted for 20.8 % of the total population.
Among the ENP-East countries for which 2021 data is available, Azerbaijan recorded higher crude birth rates than death rates, while the opposite was true in Georgia and Ukraine. In the EU in the same year, crude birth rates were lower than death rates.
In the EU in 2020, the total fertility rate was provisionally estimated at 1.5 children per woman. Total fertility rates were higher in Georgia (2.0) and in Azerbaijan (1.8 - 2019 data), similar to the EU in Armenia (1.6 - 2019 data), but lower in Ukraine (1.1 - 2019 data).
This article is part of an online publication and it presents information on five European Neighbourhood Policy-East (ENP-East) countries, namely, Armenia, Azerbaijan, Georgia, Moldova and Ukraine, compared with the European Union (EU). Georgia, Moldova and Ukraine also all became enlargement countries in 2022. The European Council gave the three a European perspective and granted Moldova and Ukraine candidate status on 23 June 2022. This article does not contain any data on Belarus, as statistical cooperation with Belarus has been suspended as of March 2022.
Data shown for Georgia exclude the regions of Abkhazia and South Ossetia over which Georgia does not exercise control. The data managed by the National Bureau of Statistics of the Republic of Moldova does not include data from Transnistria over which the government of the Republic of Moldova does not exercise control. Since 2014, data for Ukraine generally exclude the illegally annexed Autonomous Republic of Crimea and the City of Sevastopol and the territories which are not under control of the Ukrainian government. The latest statistics in this Statistics Explained article cover the calendar year 2021, before Russia's invasion of Ukraine. Data on Ukraine for the year 2021 is limited due to exemption under the martial law from mandatory data submission to the State Statistics Service of Ukraine, effective as of 3 March 2022.
Statistics on population change and the structure of the population are increasingly used to support policy making and provide an opportunity to monitor demographic behaviour within an economic, social and cultural context. Aside from basic data on population levels and the structure of the population, this article also provides information on crude rate of net migration plus statistical adjustment; crude birth rates and crude death rates; the total fertility rate; life expectancy at birth; and the infant mortality rate.
Full article
Number of inhabitants
Data on the total population of the ENP-East countries and the EU is shown in Table 1 for the years 2011-2022. Data for 2022 are available only for Ukraine and the EU. Ukraine was the most populous of the ENP-East countries with 41.0 million inhabitants in 2022, while Azerbaijan, at 10.1 million had the second largest population in 2021. Georgia had a population of 3.7 million, Armenia 3.0 million and Moldova 2.6 million inhabitants (provisional data). In 2021, the population of the ENP-East countries taken together was 60.8 million persons, which was equivalent to 13.6 % of the total number of inhabitants in the EU.
With the exception of Azerbaijan, the populations of the ENP-East countries declined over the period 2011-2021. Moldova's population (2021 provisional data) fell by 27.1 %, equivalent to an average annual change rate of -3.1 %. Georgia's population declined by 16.6 % over 2011-2021 or 1.8 % per year[1]. Armenia's population fell by 9.2 % in total or 1.0 % per year. Ukraine's population data had a series break in 2015. Over the comparable period 2015 to 2021, its population declined by 3.1 % or 0.5 % per year. By contrast, the population of Azerbaijan increased by 11.1 % between 2011 and 2021, equivalent to an average growth rate of 1.1 % per year. The EU's population increased by 1.7 % over 2011-2021 or 0.2 % per year.
More details on some of the reasons behind the population reductions are provided below under the headings Crude birth and death rates and Crude rate of net migration.
Population age and by sex structure
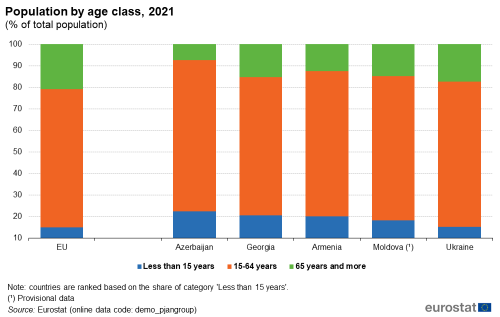
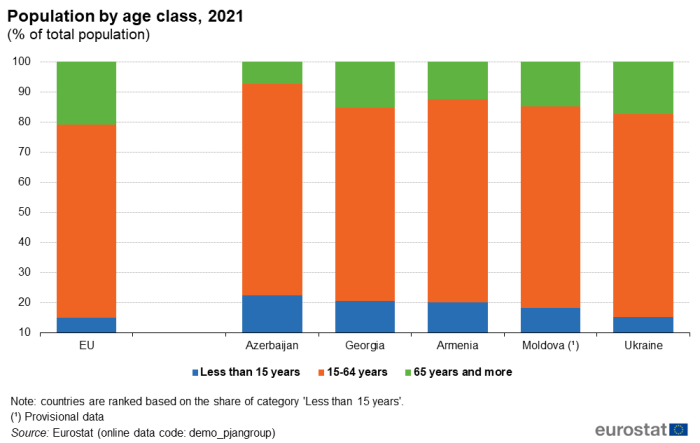
Figure 1 shows the age structure of the population of the ENP-East countries and the EU in 2021. The share of the elderly, defined here as those aged 65 years and over, accounted for 7.5 % of the population in Azerbaijan, 15.2 % in Georgia, 12.6 % in Armenia, 14.9 % in Moldova (provisional data) and 17.4 % in Ukraine.
People aged 65 years and over made up 20.8 % of the total population of the EU in 2021, a higher proportion than in any of the ENP-East countries. This reflects, among other factors, greater longevity among the EU population.
At the other end of the age spectrum, the shares of young people in the total populations of the ENP-East countries were mostly higher than the EU average. The highest proportion was recorded in 2021 for Azerbaijan, where those aged less than 15 years made up 22.3 % of the population. In Georgia, people aged less than 15 years accounted for 20.5 %. In Armenia, 20.2 % of the total number of inhabitants were aged under 15 years. In Moldova, the share (provisional data) was 18.3 % and in Ukraine 15.2 %.
Young people accounted for 15.1 % of the EU's population in 2021. This share reflects, to some degree, relatively low fertility rates.
The EU's population is ageing, as consistently low birth rates and higher life expectancy transform the shape of its age pyramid. As a result, the proportion of people of working age in the EU is shrinking, while the relative number of those retired is expanding. This will, in turn, lead to an increased burden on those of working age to provide for the social expenditure required by the ageing population for a range of services. These issues also apply to an extent in those ENP-East countries that have a high proportion of persons aged over 65 years in their populations.
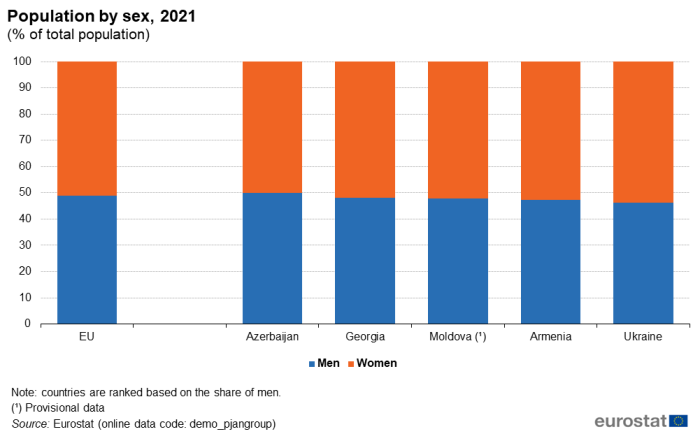
Figure 2 presents the balance of the population by sex of the EU and the ENP-East countries in 2021. The share of women in the total population of the EU and ENP-East countries is slightly higher than the share of men. The share of men in the ENP-East countries varied from 49.9 % in Azerbaijan, to 46.3 % in Ukraine. The share of males in the EU population in 2020 was 48.9 %.
Crude birth and death rates
The rate of population change is linked on the one hand to natural rates of population change (the balance between the number of births and the number of deaths) and on the other hand to migratory flows (people coming into a country or leaving it). When crude birth and death rates (the numbers of births and deaths per 1 000 inhabitants) are relatively balanced, then migratory flows may exhibit a larger influence on the overall change in population numbers, since the natural change from births and deaths is close to zero (because they cancel each other out). Global trends over time are for falling crude birth rates.
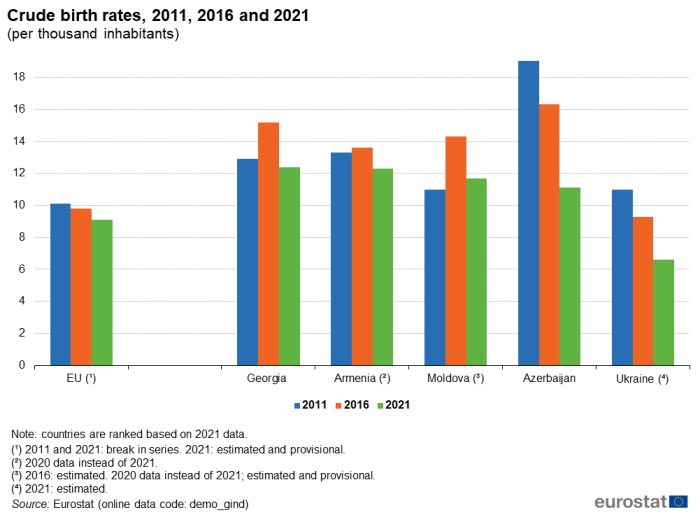
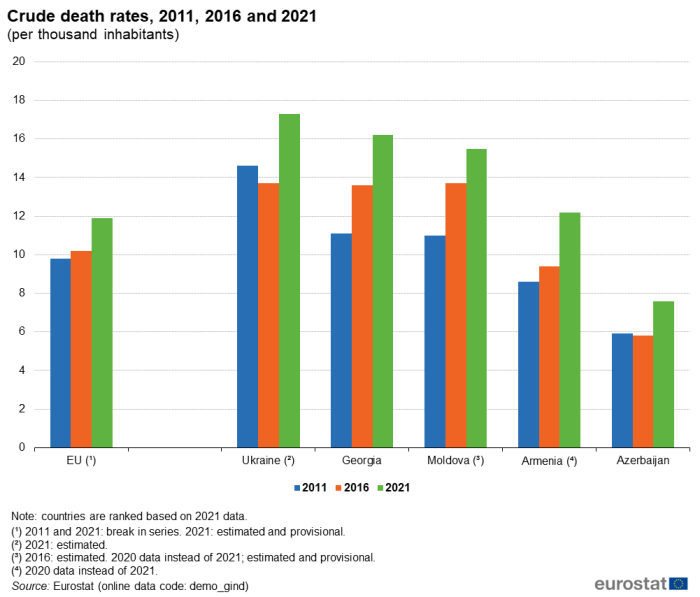
Data on crude birth rates for the ENP-East countries per thousand inhabitants is illustrated in Figure 3 and that for crude death rates in Figure 4 for the years 2011, 2016 and 2021.
Among the ENP-East countries, Azerbaijan had the highest crude birth rate in 2011 and 2016: 19.2 per 1 000 inhabitants in 2011; and 16.3 in 2016. By 2021, the crude birth rate had slowed to 11.1 per 1 000 inhabitants. This trend compares with Azerbaijan's crude death rates of 5.9 per 1 000 inhabitants in 2011, 5.8 in 2016 and 7.6 in 2021. The result is a natural rate of population change that rapidly declined from an initial high value but remained positive over 2011-2021. In 2011, it was 13.3 per 1 000 inhabitants; in 2016, 10.5; and in 2021, 3.5 per 1 000 inhabitants.
(per thousand inhabitants)
Source: Eurostat (demo_gind)
In Armenia, the natural rate of population change was positive, as the crude birth rate exceeded the crude death rate by 4.7 per 1 000 inhabitants in 2011, by 4.2 in 2016, but only by 0.1 in 2020 (no data available for 2021).
In Moldova, the natural rate of population change was approximately in balance in 2011 and 2016, as the difference between crude birth and crude death rates was 0.0 in 2011 and 0.6 per 1 000 inhabitants in 2016. However, in 2020 (no data available for 2021), the natural rate of population change was negative at -3.8 per 1 000 inhabitants.
In Georgia, the difference between crude birth and crude death rates was 1.8 per 1 000 inhabitants in 2011, 1.6 in 2016 and -3.8 in 2021. While the crude birth rate declined slightly from 2011 to 2021 (it was higher in 2016), the crude death rate increased.
Crude birth rates were lower than crude death rates in Ukraine in all three years shown: the crude birth rate in Ukraine was lower than the crude death rate by -3.6 persons per 1 000 inhabitants in 2011, -4.4 in 2016 and an estimated -10.7 persons per 1 000 inhabitants in 2021. The natural rate of population change was therefore increasingly negative.
The natural rate of population change in the EU was 0.3 persons per 1 000 inhabitants in 2011, -0.4 in 2016 and -2.8 persons per 1 000 inhabitants in 2021. 2021 data are estimated and provisional.
While 2021 was the second year of the Covid-19 pandemic, this may not be the only factor influencing the crude death rate. Conclusions about the impact of Covid-19 on the death rate should not be drawn on the basis of this data alone.
(per thousand inhabitants)
Source: Eurostat (demo_gind)
Crude rate of net migration
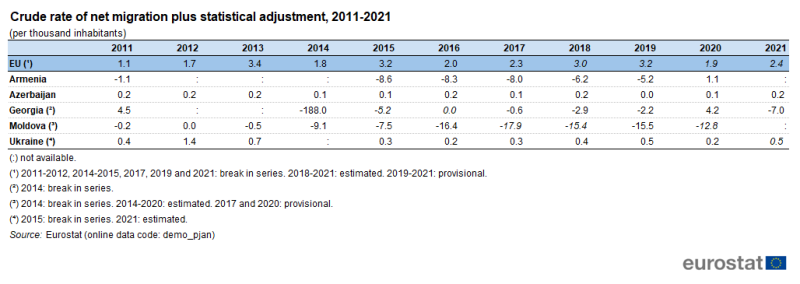
The net migration plus statistical adjustment represents the difference between total population change and natural change. 'Net migration plus statistical adjustment' may cover, apart from the difference between inward and outward migration, other changes observed in the population figures as recorded for 1 January on two consecutive years which cannot be attributed to recorded births, deaths, immigration and emigration. Data is shown in Table 2 for the period 2011-2021 or as available.
Values for the most recent data on the crude rate of net migration plus statistical adjustment in the ENP-East countries varied from +1.1 persons per 1 000 inhabitants in Armenia in 2020 to -12.8 in Moldova in 2020 (provisional data). However, data for one year is not necessarily representative of longer term trends.
(per thousand inhabitants)
Source: Eurostat (demo_pjan)
Trends in the crude rate of net migration plus statistical adjustment for the ENP-East countries can be examined by looking at average statistics over the period 2011 to 2021. The highest value observed in the ENP-East countries was in Ukraine (no data for 2014) at +0.5 persons per 1 000 inhabitants per year. The only other country with positive (inward) net migration plus statistical adjustment was Azerbaijan, with +0.1 persons per 1 000 inhabitants per year over 2011-2021. In Georgia in 2011 and from 2015 to 2021 (there was a break in the series in 2014), there was negative (outward) net migration plus statistical adjustment of -1.2 persons per 1 000 inhabitants per year. In Armenia, using the available data for 2011 and 2015-2020, the equivalent figure was -5.2 persons per 1 000 inhabitants per year. Moldova statistics for 2011-2020 show that annual average net migration plus statistical adjustment was -9.5 persons per 1 000 inhabitants per year.
The statistics on age structure in Figure 1 above should be viewed in conjunction with this migration data, as migrants generally tend to be concentrated in the population aged 15-64 years.
For the EU in 2021, provisional data on net migration plus statistical adjustment was +2.4 persons per 1 000 inhabitants. This figure was the same as the average for the period 2011-2021.
Fertility rates
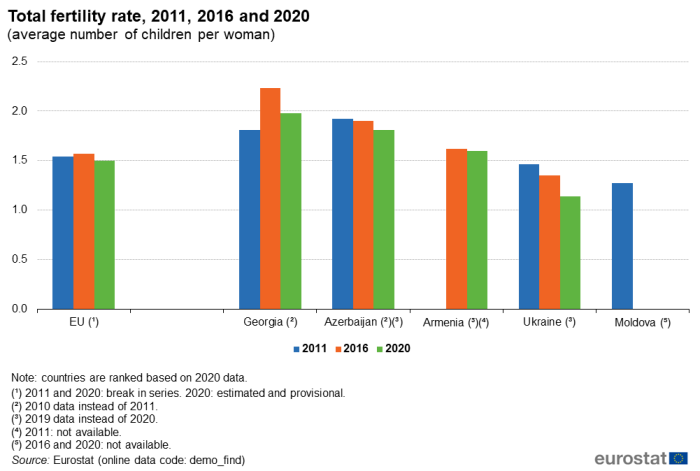
Fertility rates measure the number of children per woman. An average of around 2.1 children per woman is thought to be required to maintain a constant population level, excluding any consideration of migration. Data for the ENP-East countries and the EU is shown in Figure 5 for 2011, 2016 and 2019.
Except for Georgia in 2016, the data shows consistent fertility rates below replacement level for the ENP-East countries and the EU. Fertility rates for 2020 in Georgia, Azerbaijan (2019 data) and Armenia (2019 data) were, at 2.0, 1.8 and 1.6 children per woman, respectively. These figures were higher than in the EU but still below the replacement rate. In Ukraine in 2019 (no 2020 data available), the fertility rate was 1.1, below both replacement rate and the EU figure.
Comparing fertility rates over the period 2011-2020 (or for the period for which data is available) as shown in Figure 5, there were falls in fertility rates in Ukraine and Azerbaijan, an increase in Georgia and stable data in Armenia.
At 1.5 children per woman in 2020, the total fertility rate of the EU was considerably lower than the theoretical replacement rate.
(average number of children per woman)
Source: Eurostat (demo_find)
Life expectancy at birth
Life expectancy at birth rose rapidly over the last century due to factors including reductions in infant mortality, rising living standards, improved lifestyles and better education, as well as advances in healthcare and medicine.
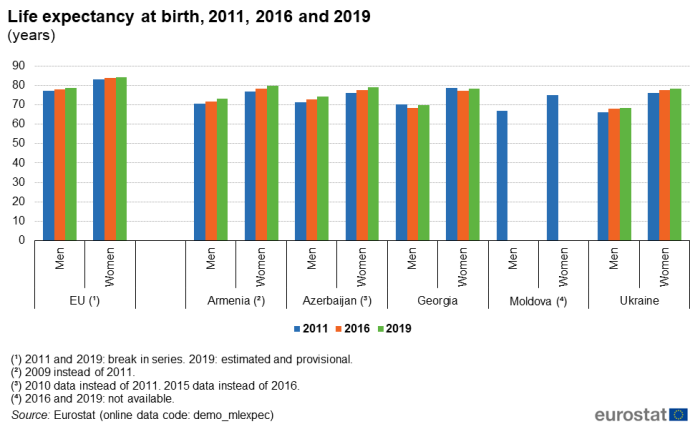
In 2019, life expectancy at birth continued to be higher for women than for men, both within the EU and across all of the ENP-East countries, as shown in Figure 6.
Male life expectancy in 2019 in the ENP-East countries ranged from 68.4 years in Ukraine to 74.3 years in Azerbaijan. Female life expectancy in 2019 was between 78.3 years in Ukraine and 79.7 years in Armenia.
Among ENP-East countries, the greatest improvement in male life expectancy over the period occurred in Azerbaijan (2010-2019) at 3.1 years, while Georgia recorded a decrease of 0.3 years over the period 2011-2019. Female life expectancy increased by 3.0 years in Armenia (2009-2019), the greatest improvement in the region. Female life expectancy declined by 0.2 years over 2011-2019 in Georgia.
EU life expectancy in 2019 (estimated, provisional data) was 78.5 years for males and 84.0 years for females. EU life expectancy was higher than any of the ENP-East countries for both male and female during the period analysed. A break in the EU's data series means that later data is not strictly comparable with 2011. Noting this break, EU male life expectancy increased by 1.5 years between 2011 and 2019. EU female life expectancy increased by 0.9 years between 2011 and 2019.
Infant mortality rates
Data on infant mortality rates per thousand live births for the ENP-East countries and the EU are shown for 2011, 2016 and 2020 in Figure 7.
In 2020, data ranged from 9.8 infant deaths per 1 000 live births in Azerbaijan to 6.8 in Ukraine. In the EU, there were 3.3 deaths per 1 000 live births in 2020.
Infant mortality rates fell over the period 2011-2020 in all ENP-East countries, in particular in Armenia, where there were 4.4 fewer deaths per 1 000 live births in 2020 than in 2011. At 7.3 deaths per 1 000 live births, this was the second lowest among the ENP-East countries in 2020. The figure declined by 1.0 deaths per 1 000 live births in Azerbaijan over 2011-2020, the least among the ENP-East countries. The decline in the EU was 0.5 deaths per 1 000 live births over the same period.
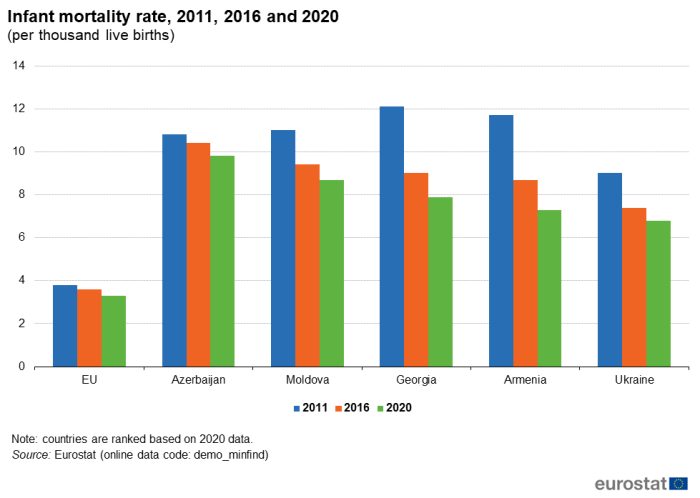
(per thousand live births)
Source: Eurostat (demo_minfind)
Source data for tables and graphs
Data sources
Eurostat provides a wide range of demographic data, including statistics on populations at national and regional level, as well as for various demographic events influencing the size, the structure and the specific characteristics of these populations. Eurostat collects data from EU Member States and other countries participating in its demography data collection exercise (including the ENP-East countries) concerning the population as of 1 January each year. The recommended definition is the 'usual resident population' and represents the number of inhabitants of a given area on 1 January of the year in question (or, in some cases, on 31 December of the previous year).
Fertility is the ability to conceive (become pregnant) and give birth to children. The total fertility rate is defined as the mean number of children who would be born to a woman during her lifetime, if she were to spend her childbearing years conforming to the age-specific fertility rates that have been measured in a given year.
Life expectancy at a certain age is the mean additional number of years that a person of that age can expect to live, if subjected throughout the rest of his or her life to the current mortality conditions. The information shown in this article relates to life expectancy at birth.
The infant mortality rate is defined as the ratio of the number of deaths of children under one year of age to the number of live births in the reference year; the value is expressed per 1 000 live births.
Tables in this article use the following notation:
| Value in italics | data value is forecast, provisional or estimated and is therefore likely to change; |
| : | not available, confidential or unreliable value. |
Context
On 2 July 2021, the European Commission and the EU High Representative for Foreign Affairs and Security Policy presented the Eastern Partnership: a Renewed Agenda for cooperation with the EU's Eastern partners. This agenda is based on the five long-term objectives, with resilience at its core, as defined for the future of the Eastern Partnership in the Joint Communication Eastern Partnership policy beyond 2020: Reinforcing Resilience – an Eastern Partnership that delivers for all in March 2020. It is further elaborated in the Joint Staff Working Document Recovery, resilience and reform: post 2020 Eastern Partnership priorities. It will be underpinned by an Economic and Investment plan. The Joint Declaration of the Eastern Partnership Summit 'Recovery, Resilience and Reform' of 15 December 2021 reaffirms strong commitment to a strategic, ambitious and forward-looking Eastern Partnership.
In cooperation with its ENP partners, Eurostat has the responsibility 'to promote and implement the use of European and internationally recognised standards and methodology for the production of statistics, necessary for developing and monitoring policy achievements in all policy areas'. Eurostat undertakes the task of coordinating EU efforts to increase the statistical capacity of the ENP countries. Additional information on the policy context of the ENP is provided here.
Direct access to
Books
Factsheets
- Basic figures on the European Neighbourhood Policy-East countries — 2023 edition
- Basic figures on the European Neighbourhood Policy-East countries — 2021 edition
Leaflets
- Basic figures on the European Neighbourhood Policy — East countries — 2020 edition
- Economic statistics for the European Neighbourhood Policy-East countries — 2020 edition
- Basic figures on the European Neighbourhood Policy — East countries — 2020 edition
- Basic figures on the European Neighbourhood Policy — East countries — 2019 edition
- Basic figures on the European Neighbourhood Policy — East countries — 2018 edition
- Basic figures on the European Neighbourhood Policy — East countries — 2016 edition
- Basic figures on the European Neighbourhood Policy — East countries — 2015 edition
- Basic figures on the European Neighbourhood Policy — East countries — 2014 edition
- Demographic statistics for the European Neighbourhood Policy — East countries — 2019 edition
- International trade for the European Neighbourhood Policy — East countries — 2016 edition
- European Neighbourhood Policy-East countries — Statistics on living conditions — 2015 edition
- European Neighbourhood Policy — East countries — Key economic statistics — 2014 edition
- European Neighbourhood Policy — East countries — Labour market statistics — 2014 edition
- European Neighbourhood Policy — East countries — Youth statistics — 2014 edition
- Population and social conditions (enpe_pop)
- Eastern European Neighbourhood Policy countries (ENP-East) (ESMS metadata file — enpe_esms)
- European External Action Service — European Neighbourhood Policy
- Joint Communication JOIN(2020) 7 final: Eastern Partnership policy beyond 2020: Reinforcing Resilience - an Eastern Partnership that delivers for all (18 March 2020)
- Joint Staff Working Document SWD(2021) 186 final: Recovery, resilience and reform: post 2020 Eastern Partnership priorities (2 July 2021)
- Joint Declaration of the Eastern Partnership Summit: 'Recovery, Resilience and Reform' (15 December 2021)
Notes
- ↑ The population data for the year 2015 and after take into account the results of the latest population census (held in 2014).
