Enlargement countries - recent economic developments
Data extracted in May 2024.
Planned article update: June 2025.
Highlights
Türkiye's economy is by far the largest among the candidate countries and potential candidate; its GDP at current market prices in 2023 was equivalent to 6% of that of the EU (28.6% when calculated per capita for 2022).
Between both the candidate countries and potential candidate, the sharpest decrease of real GDP in 2020 (consequence of the Covid-19 pandemic) year-on-year was observed in Montenegro (-15.3%).
Serbia had the highest activity rate (76.8%) among the candidate countries and potential candidate in 2023, not far from the EU level (80.0%).
In 2022, the percentage of gross value added produced by the 'Agriculture, forestry and fisheries' sector in Albania (21.3%) was over ten times the share recorded in the EU (1.9%).
Between 2013 and 2022 the highest growth of gross fixed capital formation among the candidate countries and potential candidate was recorded in Serbia: 37.6% compared to 12.1% in the EU.
This article is part of an online publication and provides information on a range of economic statistics for the candidate countries and potential candidate, compared with the corresponding data for the European Union (EU).
The new candidate countries, Georgia, Republic of Moldova and Ukraine, are usually included in the set of articles covering the enlargement countries. However, for these articles, only data which are submitted to and validated by Eurostat's subject matter units following the same process as data from Member States, are used. For Georgia, Moldova and Ukraine, data on economic developments are not yet transmitted in this way and are therefore not available yet. However, these countries are presented in the Statistics Explained articles for ENP-East countries, which are based on data supplied by and under the responsibility of the national statistical authorities of each country, on a voluntary basis.
The article provides macroeconomic information from national accounts, including the principal measure of economic activity, gross domestic product (GDP), labour force, as well as an analysis of gross value added (GVA) by economic sector.
Full article
Gross domestic product at current market prices
Gross domestic product (GDP) is an aggregate measure of the size of an economy, based on its total final output. GDP can be calculated using different approaches: the output approach; the expenditure approach; and the income approach.
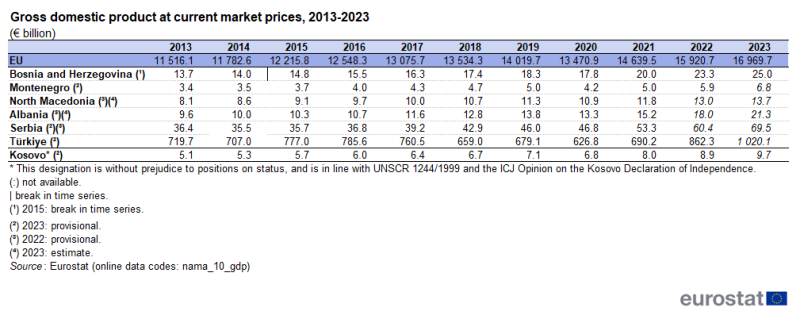
Table 1 shows nominal GDP (at current market prices) in the candidate countries and potential candidate, for the period 2013-2023 (or the most recent year for which data are available).
Türkiye has by far the largest GDP among the candidate countries and potential candidate. In 2023, measured at current market prices, the figure was €1 020.1 billion (provisional data), equivalent to 6 % of that in the EU. The next largest economies among this group were Serbia, with GDP at current market prices of €69.5 billion in 2023 (provisional data); Bosnia and Herzegovina with €25.0 billion; Albania with €21.3 billion (provisional estimate); North Macedonia with €13.7 billion (provisional estimate); Kosovo* [1] with €9.7 billion (provisional); and Montenegro with €6.8 billion (provisional).
(€ billion)
Source: Eurostat (nama_10_gdp)
Gross domestic product per capita at current market prices
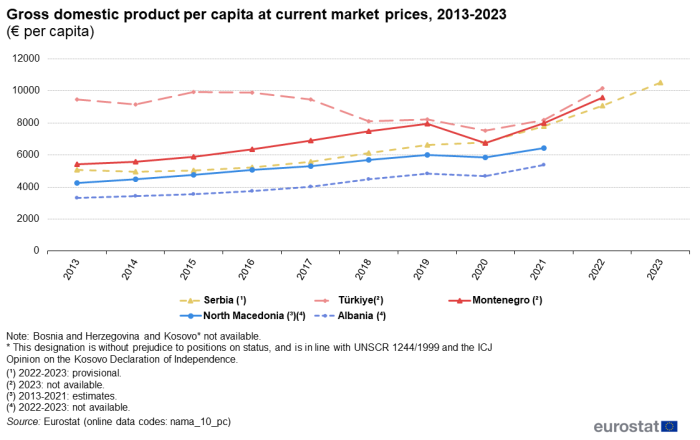
Analysis of GDP per capita (per inhabitant) removes the influence of the size of the population, making comparisons between different countries of different sizes easier. GDP per capita is often used as a measure of living standards within an economy. Figure 1 shows GDP per capita at current market prices (i.e. in nominal terms) in the candidate countries and potential candidate and in the EU from 2013 to 2023, where available (data for Bosnia and Herzegovina, Moldova, Georgia, Ukraine and Kosovo were not available).
Among the economies of the candidate countries and potential candidate for which data were available, Türkiye recorded the highest GDP per capita in nominal terms throughout the period 2013-2022 (2023 not available). In 2022, GDP per capita in Türkiye was €10 150 (an increase of 7.4 % over the period 2013-2022 from €9 450 in 2013), equivalent to 28.6 % of that in the EU.
The GDP per capita in nominal terms grew faster for all the other candidate countries and potential candidate for which the information was available than in Türkiye over the period 2013-2023, as shown in Figure 1. In 2013, the GDP per capita in Türkiye (€9 450) 75 % higher than the second highest (Montenegro; €5 410) and 86 % higher than in the third highest (Serbia; €5 080). By 2022 (2023 data not available), the GDP per capita in Türkiye (€10 150) was only 6 % higher than the second highest (Montenegro; €9 600) and 12 % higher than in the third highest (Serbia; €9 070). The gap between the GDP per capita between Türkiye and that of the other available candidate countries and potential candidate narrowed in particular in 2018, reflecting the fall in GDP in current prices in Türkiye in 2018 shown in Table 1 above.
Montenegro recorded the second highest value of GDP per capita at current market prices in both 2013 and 2022 (2023 data not available). It grew from €5 410 in 2013 to €9 600 in 2022, or 27.1 % of that in the EU. Over the period, this country saw a significant increase of 77.4 % in GDP per capita in current market prices, i.e. roughly ten times the increase recorded for Türkiye.
During 2013-2023, GDP per capita at current market prices in Serbia increased from €5 080 in 2013 to €10 500 in 2023 (provisional data), or 27.9 % of that in the EU. Over the period, this country saw an increase of 106.7 %, the highest increase among the candidate countries and potential candidate for which the information was available.
North Macedonia saw an increase of 51.9 % in its estimated GDP per capita in nominal terms over 2013-2021 (2022 and 2023 data not available) to a value of €6 440, which represented 19.7 % of that of the EU.
Growth in GDP per capita in nominal terms in Albania was 62.3 %, as a result of a nominal GDP per capita of €3 320 in 2013 and of €5 390 in 2021 (2022 and 2023 data not available), equivalent to 16.5 % of that in the EU.
In the EU, between 2013 and 2023, GDP per capita in nominal terms rose by 44.6 % from €26 010 to €37 620.
(€ per capita)
Source: Eurostat (nama_10_pc)
Growth in real gross domestic product
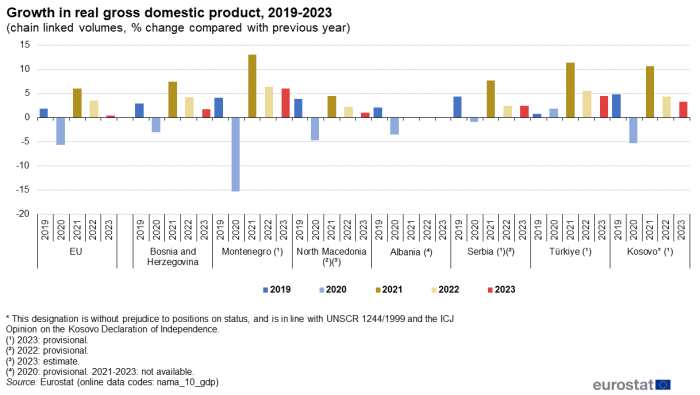
Real or constant price GDP focuses on the volume of output, excluding the effect of price changes. The calculation of the annual growth rate of GDP at constant prices, i.e. the real change in GDP, allows comparison of the dynamics of economic development, both over time and between economies of different sizes, regardless of price developments. Figure 2 shows the real annual growth rates of GDP year-on-year, in other words the changes in constant price GDP compared with the year before, in the candidate countries and potential candidate and in the EU for the years from 2019 to 2023 (data for Bosnia and Herzegovina, Moldova, Georgia and Ukraine were not available).
In 2019, in all the candidate countries and potential candidate for which data were available, the real GDP grew in a range between 0.8 % in Türkiye and 4.8 % in Kosovo, against a growth of 1.8 % in the EU.
In 2020, candidate countries and potential candidate, as well as the EU, recorded a real decrease in GDP due to the impact of the COVID-19 crisis. The decrease was particularly severe in Montenegro (-15.3 %), while it ranged between -0.9 % in Serbia and -5.3 % in Kosovo. The only exception was Türkiye, which recorded a growth of 1.9 %. The decrease in the EU was measured at -5.6 %.
The rebound in activity in 2021 led to important increases ranging between 4.5 % in North Macedonia (provisional) and 13 % in Montenegro, which recovered from the dramatic decrease of the previous year, while the average increase in the EU was 6.0 %.
There was further growth in 2022, as well as in 2023. The growth in 2022 went from 2.2 % in North Macedonia (provisional) up to 6.4 % in Montenegro, against 3.5 % in the EU. The growth in 2023 was lower, ranging from an estimated 1.0 % in North Macedonia to 6.0 % (provisional) in Montenegro. In comparison, the EU reported a growth of 0.4 % in 2023.
(chain linked volumes, % change compared with previous year)
Source: Eurostat (nama_10_gdp)
Labour force
The economically active population, also known as the labour force, is comprised of employed and unemployed persons. The labour force also includes people who are not actively working but have a job or business from which they are temporarily absent, for example due to illness, annual leave, industrial disputes, education or training leave. The activity rate is the proportion of the population who are economically active.
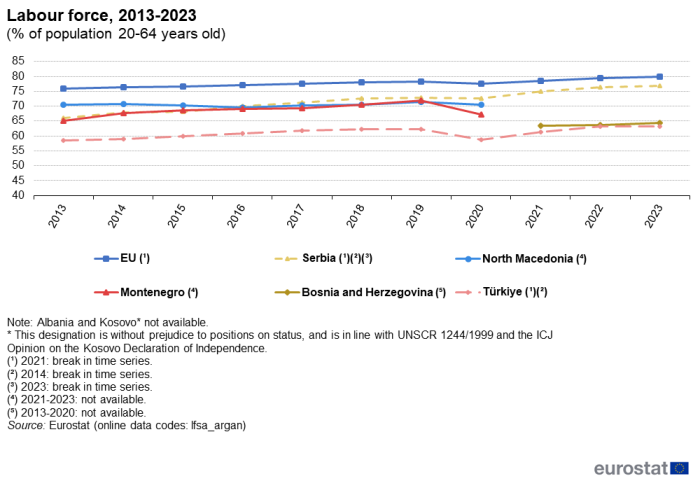
Figure 3 presents the proportion of the economically active population aged 20-64 years, between 2013 and 2023, for the candidate countries and potential candidate as well as for the EU
In 2023, among the candidate countries and potential candidate which data were available, Serbia had an activity rate closest to the EU average (80.0 %), with its share of labour force corresponding to 76.8 % of the population aged 20 to 64. Between 2013 and 2023 the activity rate in Serbia increased by 10.7 percentage points (pp), against 4.0 pp in the EU.
In the same period, the activity rate increased by 4.7 pp in Türkiye, which achieved a rate of 63.1 %, though still significantly lower than in the EU (-16.9 pp).
Data were only available till 2020 for North Macedonia and Montenegro.
In North Macedonia there were minor fluctuations of the activity rate over the period 2013-2020 and there was little change in the rate between 2013 (70.4 %) and 2020 (70.5 %)
In Montenegro, the rate of economically active population aged 20 to 64 years, increased by 2.1 pp from 2013 to 2020, with quite a constant year-on-year increase till 2019. In 2020, the activity rate decreased not only in Montenegro but in all the candidate countries and potential candidate for which data were available, as well as in the EU. The rate in 2020 was 67.2 % for Montenegro.
Data were only available for the years 2021-2023 in the case of Bosnia and Herzegovina. The trend of the activity rate was towards an increase (+0.9 pp comparing 2023 to 2021). The level of the rate in 2023 (63.1 %) was low compared to the EU and just slightly over the rate of Türkiye.
Employment and gross value added by economic activity
Analysis of the gross value added (GVA) by economic activity is useful to illustrate the structure of an economy. The analysis is limited by the fact that the 'services' category itself contains a wide variety of activities, such as government, transport, tourism and business services. The proportion of construction in an economy typically varies over the economic cycle, with the sector doing well in periods of high growth and often contracting during a recession.
The GVA is compared with the employment by activity sector (part of population over 15 years old and not in the range 20-64 years as in the previous chapter).
The data are shown in Figure 4 for 2022. Employment in Montenegro, North Macedonia and Serbia, refers to 2020, while data are not available for Albania and Kosovo. The 2022 GVA is provisional for North Macedonia, Albania and Serbia. For Georgia, Moldova and Ukraine neither data on employment nor GVA are available.
In all candidate countries and potential candidate for which data are available both for employment and for GVA, the percentages were higher than in the EU for employment in the 'Agriculture, forestry and fisheries' sector, ranging from 7.3 % in Bosnia and Herzegovina to 15.7 % in Türkiye. In general, the share of GVA was lower, ranging from 5.7 % in Bosnia and Herzegovina to 8.6 % in North Macedonia. In Montenegro, the percentages of employment and GVA were at the same level (7.5 %). No employment data were available for Albania and Kosovo. The percentage of GVA in Albania (21.3 %) was extremely high: over ten times the share recorded in the EU, where the average rates for the 'Agriculture, forestry and fisheries' sector was 3.7 % of employment and 1.9 % of GVA in 2022.
Türkiye had the highest share of GVA in the 'Industry' sector within all the candidate countries and potential candidate for which data were available, at 29.5 %, while the lowest share of GVA was recorded in Montenegro (11.3 %). Concerning employment, it ranged from 10.1% in Montenegro to 25.4% in Bosnia and Herzegovina. In comparison, the EU average rates for the 'Industry' sector were 17.7 % of employment and 20. 5 % of GVA in 2022.
In the 'Construction' sector, percentages of employment varied between 5.9 % in Serbia to 9.2 % in Bosnia and Herzegovina. The share of GVA was lower, ranging from 4.8 % in Montenegro to 6.7 % in North Macedonia, the only exception was Serbia. However, the most recent available data on employment in Serbia (5.9 %) was for reference year 2020, while the GVA provisional data (6.6 %) was for year 2022. The percentage of GVA in Albania and Kosovo, where no employment data were available, was higher: respectively 11.1 % and 10.7 %. In comparison, the EU average rates for the 'Construction' sector were 6.7 % of employment and 5.5 % of GVA in 2022.
In the EU, the main sector was 'Services', accounting for almost three quarters of the whole GVA and employment: more accurately, 72.0 % of GVA against 71.5 % of employment. In all candidate countries and potential candidate, 'Services' was the main sector but, in most cases, with lower shares than in the EU. Excluding Montenegro (73.5 % employment and 76.3 % GVA), the percentages ranged between 55.3% in Serbia and 58.2% in Bosnia and Herzegovina for employment and between 54.2% in Albania and 65.7% in North Macedonia for GVA. In all cases for which data were available the percentage of GVA was higher than the percentage of employment. Since the overall services sector is made up of a disparate range of sub-sectors, it is difficult to draw many conclusions.
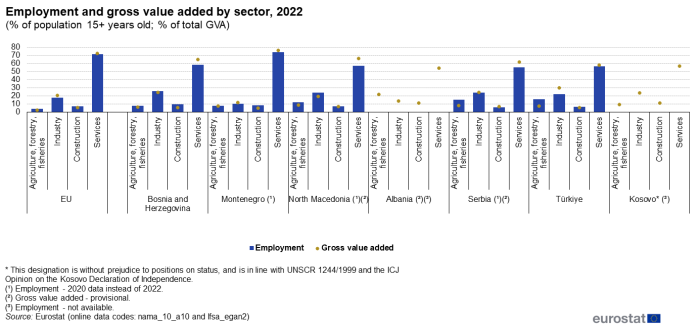
(% of population 15+ years old; % of total GVA)
Source: Eurostat (nama_10_a10) and (lfsa_egan2)
Gross fixed capital formation
Gross fixed capital formation (GFCF) indicates how much of the value added in an economy is invested rather than consumed. It is considered an indicator of future business activity. In general, GFCF tends to increase in times of economic growth and business confidence. Conversely, it tends to decrease in case of economic uncertainty or recession.
GFCF as a percentage of GDP at current market prices in the period 2013 to 2023 is presented in Figure 5 for the candidate countries and potential candidate for which data are available, compared to the EU.
Some fluctuations were observed within the period in all countries. In most cases the share of GFCF in the GDP increased over the period 2013-2023.
On average, the EU member states increased their GFCF share slowly and constantly, rising from 19.8 % in 2013 to 22.2 % in 2023, with a minor break in 2020 and 2021, i.e. the period of the Covid-19 crisis. Similar breaks were also observed in most of the candidate countries and potential candidate for which data are available.
Between these latter countries, the most important increase was observed in Serbia, which had a share of 16.5 % in 2013 and reached a share of 24.2 % in 2022 only to come back to a provisional share of 22.7% in 2023.
The highest GCFC share were recorded in Türkiye and Kosovo. Türkiye started at 28.3 % in 2013 to reach 32.4 % (provisional) in 2023, after a break between 2019 and 2021. Kosovo started at 29.2 % in 2013, had a minor break in 2019 and 2020 to reach 32.9 % in 2021. It experienced a minor decrease in 2022-2023, so that the final provisional share in 2023 was estimated at 31.8 %.
For Albania, North Macedonia and Montenegro, the ratio between GFCF and GDP was slightly lower in 2023 than in 2013. Albania had 26.1 % in 2013 and an estimated 24.4 % in 2023 (-6.5 %); North Macedonia scored 23.7 % in 2013 and an estimated 23.1 % in 2023 (-2.5 %), while the ratio for Montenegro rose from 20.2 % to 29.2 % in 2018, before starting a decline until a provisional 19.3 % in 2023 (-4.5 % compared to 2013).
The share of GFCF for Bosnia Herzegovina fluctuated between 21.0% in 2013 and 23.9% in 2023.
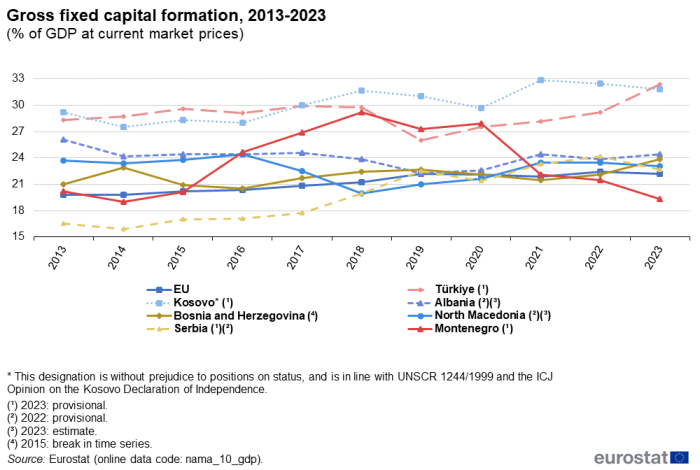
(% of GDP at current market prices)
Source: Eurostat (nama_10_gdp)
Source data for tables and graphs
Data sources
Data for the EU and the candidate countries and potential candidate were compiled under ESA 2010, which is consistent with worldwide guidelines for national accounts, namely, the United Nations' system of national accounts (the 2008 SNA).
All statistics presented in this article as monetary values are based on current price series, unless otherwise stated.
The main aggregates of national accounts are compiled from institutional units, namely non-financial or financial corporations, general government, households and non-profit institutions serving households (NPISH). Within the expenditure approach, only households and NPISH and government have final consumption (corporations are considered to have intermediate consumption). Private final consumption expenditure is defined as expenditure on goods and services for the direct satisfaction of individual needs, whereas government consumption expenditure includes goods and services produced by government, as well as purchases of goods and services by government, that are supplied to households as social transfers in kind. Gross capital formation is the sum of gross fixed capital formation, the change in inventories (stocks) and the net acquisition of valuables. The external balance is the difference between exports and imports of goods and services. Depending on the size of exports and imports, it can be positive (a surplus) or negative (a deficit).
While basic principles and institutional frameworks for producing statistics are already in place, the candidate countries and potential candidate are expected to increase progressively the volume and quality of their data and to transmit these data to Eurostat in the context of the EU enlargement process. EU standards in the field of statistics require the existence of a statistical infrastructure based on principles such as professional independence, impartiality, relevance, confidentiality of individual data and easy access to official statistics; they cover methodology, classifications and standards for production.
Eurostat has the responsibility to ensure that statistical production of the candidate countries and potential candidate complies with the EU acquis in the field of statistics. To do so, Eurostat supports the national statistical offices and other producers of official statistics through a range of initiatives, such as pilot surveys, training courses, traineeships, study visits, workshops and seminars, and participation in meetings within the European Statistical System (ESS). The ultimate goal is the provision of harmonised, high-quality data that conforms to European and international standards.
Context
National accounts provide an internationally agreed standard for compiling measures of economic activity through a coherent, consistent and integrated set of macroeconomic accounts. These accounts record how economic activity is distributed among businesses, consumers, government and foreign countries, detailing key items such as production, consumption, savings and investment. The use of internationally accepted concepts and definitions permits an analysis of different economies, such as the interdependencies between the economies of the EU Member States, or a comparison between the EU and non-EU countries.
Within the EU, multilateral economic surveillance was introduced through the stability and growth pact, which provides for the coordination of fiscal policies. The future of the Stability and Growth pact is currently under discussion.
Economic statistics have become one of the cornerstones of global, regional and national governance, for example, to analyse national economies during the global financial and economic crisis or to put in place EU initiatives such as the European semester or macroeconomic imbalance procedures (MIP).
Additional information on statistical cooperation with the candidate countries and potential candidate is provided in the Statistics explained background article Enlargement policy and statistical cooperation.
Direct access to
Other articles
- Candidate countries and potential candidates — statistical overview — online publication
- Statistical cooperation — online publication
- National accounts and GDP — online publication
Publications
- Statistical books/pocketbooks
- Key figures on enlargement countries — 2019 edition
- Key figures on enlargement countries — 2017 edition
- Key figures on the enlargement countries — 2014 edition
- Factsheets
- Basic figures on the candidate countries and potential candidates — Factsheets — 2023 edition
- Basic figures on Western Balkans and Türkiye — Factsheets — 2022 edition
- Basic figures on enlargement countries — Factsheets — 2021 edition
- Leaflets
- Basic figures on enlargement countries — 2020 edition
- Basic figures on enlargement countries — 2019 edition
- Basic figures on enlargement countries — 2018 edition
- Basic figures on enlargement countries — 2016 edition
Database
- Main GDP aggregates (nama_10_ma)
- GDP and main components (output, expenditure and income) (nama_10_gdp)
- Main GDP aggregates per capita (nama_10_pc)
- Gross value added and income by A*10 industry breakdowns (nama_10_a10)
- Main GDP aggregates (nama_10_ma)
- Labour market (labour), see:
- Employment by sex, age and economic activity (from 2008 onwards, NACE Rev. 2) - 1 000 (lfsa_egan2)
Dedicated section
Methodology
- National accounts (ESA 2010) (na10) (ESMS metadata file — na10_esms)
External links
Notes
- ↑ * This designation is without prejudice to positions on status and is in line with UNSCR 1244/1999 and the ICJ Opinion on the Kosovo Declaration of Independence.
