Culture statistics - cultural participation
Data extracted in November 2017 and January 2021
Planned update: June 2024
Highlights
In 2015, almost two thirds (63 %) of the EU population aged 16 years or more reported taking part in at least one cultural activity.
In 2015, more than one third (34 %) of EU citizens reported practising an artistic activity.
In 2015, older people (aged 65 to 74 years) in the EU were more likely to visit cultural sites than attend live performances or go to the cinema.
Cultural participation during the previous 12 months, by cultural activity, 2015
Culture and creativity play an important role within the European Union (EU). Audio-visual content, music, literature, live performances and other forms of cultural expression connect people and society. Europe’s rich cultural heritage is recognised across the world: it enhances lives, promotes European values and strengthens mutual understanding. Participating in creative and cultural activities may have a considerable impact on an individual’s quality of life, contributing towards overall well-being and enhancing the sense of belonging within society.
This article forms part of an online publication Culture statistics — 2019 edition. It is based on the results of a 2015 ad-hoc module on social and cultural participation that formed part of EU statistics on income and living conditions (EU-SILC). It presents some interesting findings about people’s involvement in cultural activities analysed according to a broad range of socioeconomic characteristics (for example, by sex, by age, or by level of educational attainment). The cultural activities covered include going to the cinema, attending live performances, visiting cultural sites and practising artistic activities (for example playing a musical instrument, singing, dancing or painting).
Full article
Cultural participation
In 2015, almost two thirds of the EU population aged 16 years or more reported that they took part in at least one cultural activity during the previous 12 months
In 2015, some 62.6 % of the EU adult population (aged 16 years or more) reported that they went to the cinema, attended a live performance (theatre, concert, organised cultural event outdoors and so on) or visited a cultural site (museum, historical monument, art gallery or archaeological site) during the previous 12 months (see Map 1).The highest levels of cultural participation were recorded in the Nordic Member States — Denmark (85.3 %), Sweden (85.0 %) and Finland (83.7 %) — and the Netherlands (also 83.7 %). At the other end of the range, less than half of the adult populations of Greece, Italy (both 46.9 %), Croatia (36.6 %), Bulgaria (28.6 %) and Romania (27.4 %) reported that they took part in any cultural activity.

(%, share of population aged ≥16 years)
Source: Eurostat (ilc_scp03)
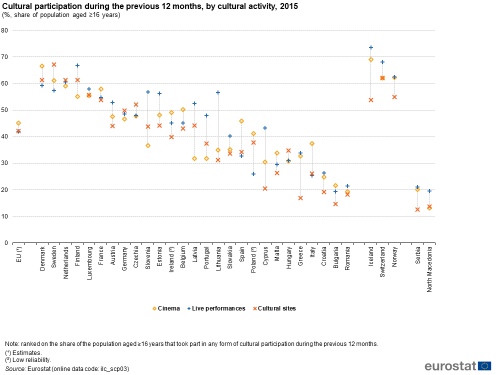
More detailed patterns of cultural participation are shown in Figure 1: it provides information on the share of the population taking part in three individual cultural activities. In 2015, some 45.2 % of the EU adult population (aged 16 years or more) reported that they went to the cinema during the 12 months prior to the survey, while a slightly lower share of the population visited a cultural site (42.1 %) or attended a live performance (42.0 %). Although EU participation rates for these three cultural activities were similar, a range of different patterns existed at a national level:
- more than half of the adult populations in Denmark, France, Luxembourg, the Netherlands, Finland, and Sweden participated in each of these three cultural activities;
- in Cyprus, Greece and Lithuania, participation rates for live performances were approximately double those recorded for visits to cultural sites;
- in the Netherlands, Luxembourg, Germany and Romania, there was almost no difference between participation rates for the three cultural activities (although there were considerable differences in rates across these Member States);
- in 13 of the 27 EU Member States, the highest participation rate was recorded for people attending live performances, peaking at 66.7 % in Finland;
- in nine of the Member States, the highest participation rate was recorded for people going to the cinema, peaking at 66.5 % in Denmark;
- in five of the Member States, the highest participation rate was recorded for people visiting cultural sites, peaking at 67.2 % in Sweden.
(%, share of population aged ≥16 years)
Source: Eurostat (ilc_scp03)
More than one sixth of the population aged 16 years or more went to the cinema at least four times during the 12 months prior to the survey
Figure 2 details the frequency with which adults (aged 16 years or more) participated in the three cultural activities analysed here (attending live performances, going to the cinema, visiting cultural sites). In 2015, some 17.6 % of the adult population in the European Union reported that they went to the cinema at least four times (during the 12 months prior to the survey), which was slightly higher than the share of the population that made at least four visits to cultural sites (14.6 %) or the share of the population that attended at least four live performances (13.3 %). At the other end of the scale, the share of the EU population that did not go to the cinema during the 12 months prior to the survey stood at 54.8 %, with slightly higher rates for those who did not visit a cultural site (57.9 %) or those who did not attend a live performance (58.0 %).
Among those who did participate in these three cultural activities, it was generally the case that they were more likely to take part no more than three times (in any one of them). In 2015, this pattern was repeated in nearly all of the EU Member States for all three cultural activities, although cinema-goers in France and people visiting cultural sites in Slovenia were more likely to make at least four visits.
In 2015, the highest proportion of adults reporting that they visited the cinema at least four times was recorded in France (29.3 %), followed by Luxembourg (26.4 %). A similar analysis for attending live performances reveals the highest shares were recorded in Slovenia (28.2 % attended at least four performances) and Luxembourg (26.9 %), while more than a quarter of all adults in Luxembourg, the Netherlands, Slovenia and Sweden made at least four visits to cultural sites.

(%, share of population aged ≥16 years)
Source: Eurostat (ilc_scp03)
Cultural participation by age
More than 80 % of younger Europeans participated in culture
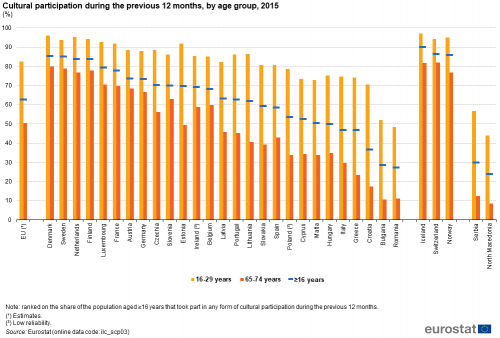
In 2015, more than four fifths (82.5 %) of all younger people (aged 16 to 29 years) across the European Union reported that they participated in at least one of three cultural activities analysed here (during the 12 months prior to the survey), compared with a rate of 50.5 % for older people (aged 65 to 74 years) — see Figure 3. Cultural participation was higher among younger (rather than older) people within each of the EU Member States. In 2015, there were only two Member States where fewer than 70.0 % of younger adults reported that they took part in a cultural activity: Bulgaria (52.1 %) and Romania (48.5 %). By contrast, there were five Member States where more than 70.0 % of older people took part in a cultural activity: Luxembourg (70.5 %), the Netherlands (76.9 %), Finland (77.8 %), Sweden (78.8 %) and Denmark (80.0 %).
There was a relatively wide ’generation gap’ in terms of cultural participation in several EU Member States, in particular in the countries with lower cultural participation rates. In the Nordic countries and the Netherlands, the differences between participation rates of younger and older people were less than 20 percentage points. On the other hand, the proportion of younger adults taking part in a cultural activity was at least twice as high as the corresponding share for older people in Slovakia, Lithuania, Cyprus, Malta, Hungary, Poland and Italy, rising to more than three times as high in Greece, more than four times as high in Croatia and Romania, and almost five times as high in Bulgaria.
(%)
Source: Eurostat (ilc_scp03)
Cinema was less attractive for older generations
The most popular of the cultural activities among older people was visiting cultural sites (40.4 %), which had higher participation rates than recorded for older people attending live performances (36.5 %) or going to the cinema (24.9 %) — see Figure 4.

(%, share of population aged 65-74 years)
Source: Eurostat (ilc_scp03)
Cultural participation by sex
There was a small difference in cultural participation rates between women and men
In 2015, almost two thirds of men and women (both 62.6 %) in the European Union reported that they took part in at least one cultural activity (during the 12 months prior to the survey) — see Figure 5. Women were slightly more inclined than men to take part in each of the three cultural activities presented in Figure 5. For visits to cultural site, the female participation rate was 1.0 percentage point higher than the rate for men, while for going to the cinema this gap was equal to 0.7 percentage points. For attending live performances, the gender gap was even somewhat larger, topping 4.0 percentage points.

(%, share of population aged ≥16 years)
Source: Eurostat (ilcscp_03)
Table 1 shows that in 2015 cultural participation rates were higher for women than for men in 18 of the EU Member States. The biggest gender gaps were recorded in Latvia, Estonia, Ireland and particularly Slovakia, where the female rate was 6.0 percentage points higher than the male rate. By contrast, there was no difference in cultural participation rates between the sexes in Spain, while men were more likely (than women) to have taken part in a cultural activity in eight of the Member States: Bulgaria, Poland, Belgium, the Netherlands, Luxembourg, Italy, Portugal and Romania.
In 2015, a higher proportion of women (compared with men) generally attended live performances, with a double-digit gender gap (in favour of women) in Finland (11.5 percentage points), Czechia (12.9 percentage points) and most notably Slovakia (13.8 percentage points). The only EU Member States where a higher share of men attended live performances were Romania and Portugal. The picture was less clear both for visiting cultural sites and going to the cinema: there were 12 Member States where men recorded a higher participation rate (than women) for going to the cinema and there were six Member States where men recorded a higher participation rate for visiting cultural sites.

(%, share of population aged ≥16 years)
Source: Eurostat (ilc_scp03)
Cultural participation by educational attainment
People with a tertiary level of educational attainment were more than twice as likely to take part in cultural activities as people with a low educational attainment
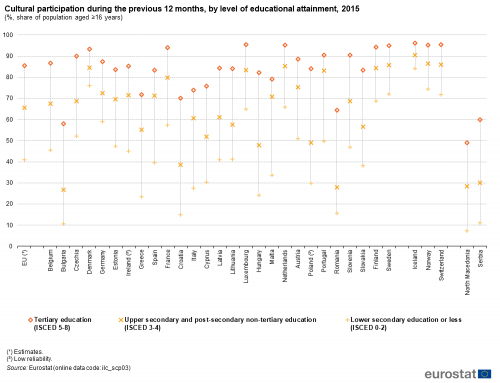
People with a tertiary level of educational attainment were much more likely to take part in cultural activities than people with lower levels of educational attainment (see Figure 6). In 2015, some 85.6 % of the EU adult population (aged 16 years or more) with a tertiary level of educational attainment reported that they took part in a cultural activity (during the 12 months prior to the survey); much lower shares were recorded for people with an upper secondary and post-secondary non-tertiary level of educational attainment (65.7 %) and people with no more than a lower secondary level of education attainment (41.0 %).
This pattern — a higher propensity to take part in cultural activities among people with higher levels of educational attainment — was repeated in each of the EU Member States (see Figure 6). In 2015, the adult populations of Greece and Hungary that possessed a tertiary level of educational attainment were more than three times as likely to take part in cultural activities as their fellow citizens with no more than a lower secondary level of educational attainment; in Romania and Croatia those with a tertiary level of educational attainment were more than four times as likely to take part in cultural activities and this ratio peaked in Bulgaria (5.5 times as likely).
(%, share of population aged ≥16 years)
Source: Eurostat (ilc_scp03)
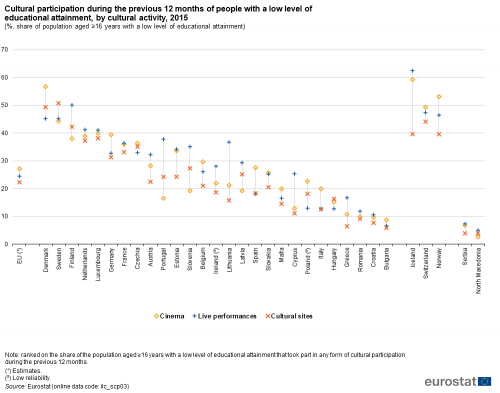
Figure 7 shows cultural participation rates for people with a low level of educational attainment (no more than a lower secondary level). Across the European Union, some 27.2 % of this group reported in 2015 that they had been to the cinema, slightly higher than the share that attended a live performance (24.5 %) or the share that visited a cultural site (22.4 %).
Among the three cultural activities shown, attending live performances was the most popular attraction for people with no more than a lower secondary level of educational attainment in 15 of the EU Member States (especially Finland (50.1 %)), while going to the cinema was the most popular activity in 10 of the Member States (especially Denmark (56.7 %)), and visiting a cultural site was the most popular activity in two of the Member States - Sweden (50.8 %) and Hungary. Denmark and Sweden were the only Member States where the proportion of the adult population with no more than a lower secondary level of educational attainment taking part in each of the three cultural activities exceeded 40 %.
(%, share of population aged ≥16 years with a low level of educational attainment)
Source: Eurostat (ilc_scp03)
Cultural participation by income
There was a clear link between income and cultural participation: in 2015, some 80.3 % of EU adults (aged 16 years or more) in the fifth income quintile (those with the highest income) reported that they took part in cultural activities (during the 12 months prior to the survey). The corresponding share for people in the first income quintile (those with the lowest income) who participated in cultural activities was 40.1 % (see Figure 8).
This pattern — of the highest cultural participation rates being recorded for people in the fifth income quintile and the lowest cultural participation rates being recorded for people in the first income quintile — was repeated in each of the EU Member States in 2015. In Croatia and Romania, people in the fifth income quintile were more than three times as likely as those in the first income quintile to take part in a cultural activity, with a peak for this ratio in Bulgaria (7.7 times as likely).
Cultural participation rates for people in the fifth income quintile ranged from highs of more than 95.0 % in the Netherlands and Sweden down to 55.2 % in Bulgaria and 50.3 % in Romania. There was a greater range in participation rates for people in the first income quintile, as 76.4 % of this group in Denmark took part in a cultural activity (and upwards of 70.0 % in the Netherlands, Finland and Sweden), while the corresponding figure for Bulgaria was 7.2 %.

(%, share of population aged ≥16 years)
Source: Eurostat (ilc_scp04)
People with low levels of income were more inclined to go to the cinema, while people with higher incomes were more likely to visit a cultural site
Figure 9 contrasts cultural participation rates for people in the first and the fifth income quintiles for three different cultural activities. In 2015, around a quarter of people in the first income quintile (24.5 %) of the EU population (aged 16 years or more) reported that they went to the cinema (during the 12 months prior to the survey); a similar share of this group visited a cultural site (24.3 %) or attended a live performance (23.9 %). By contrast, almost two thirds (63.0 %) of the population in the fifth income quintile visited a cultural site, with somewhat lower shares of this group attending a live performance (60.4 %) or going to the cinema (59.5 %).
Differences in cultural participation rates between people in the uppermost and lowermost income quintiles were relatively small in the Nordic Member States and the Netherlands, in contrast to the situation in Bulgaria where people in the fifth income quintile were eight or nine times more likely to take part in these three cultural activities as their fellow citizens in the first income quintile. There were also relatively large differences in cultural participation rates between people in the fifth and the first income quintiles of Malta, Croatia and Cyprus as regards visiting cultural sites and Croatia regarding going to the cinema.

(%, share of population aged ≥16 years)
Source: Eurostat (ilc_scp04)
Cultural participation by degree of urbanisation
Cultural participation tended to be higher among people living in cities
Figure 10 shows an analysis of cultural participation rates by degree of urbanisation. Almost two thirds (65.8 %) of the EU population (aged 16 years or more) living in cities reported in 2015 that they took part in cultural activities. This was higher than the rates for people living in towns and suburbs (60.0 %) or rural areas (52.3 %), likely reflecting the relatively high proportion of cultural venues that are located in or around cities.
In a majority of the EU Member States, the highest cultural participation rates observed in 2015 were reported among people living in cities and the lowest rates were recorded for people living in rural areas. This pattern was repeated in 21 of the Member States and was common in Member States that had relatively low cultural participation rates. The only exceptions were:
- Belgium, Lithuania and Portugal, where participation rates for people living in towns and suburbs were higher than those for people living in cities;
- Luxembourg, where the participation rate for people living in rural areas was higher than that for people living in cities, while the rate for people living in towns and suburbs was lowest;
- Latvia and the Netherlands, where the participation rates for people living in rural areas were marginally higher than those for people living in towns and suburbs.

(%, share of population aged ≥16 years)
Source: Eurostat (ilc_scp04)
People living in rural areas who took part in cultural activities were more likely to attend a live performance
In 2015, the share of the EU rural population that reported that they took part in any cultural activity was 52.3 %. There was only a small difference in terms of participation rates among the three cultural activities presented in Figure 11: 33.1 % of the population living in rural areas went (at least once) to the cinema, 35.9 % attended (at least once) a live performance, and 34.9 % visited (at least once) a cultural site. Live performances were the most common cultural activity for people living in rural areas in 16 of the EU Member States, while going to the cinema was the most popular activity in six of the Member States and visiting a cultural site in three; in France and Ireland, the share of the rural population attending live performances or going to the cinema was identical.
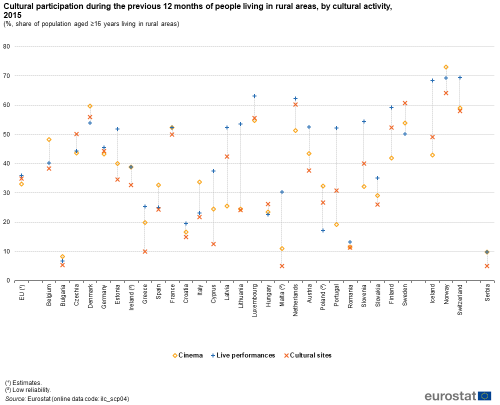
(%, share of population aged ≥16 years living in rural areas)
Source: Eurostat (ilc_scp04)
Cultural participation by country of birth
Figure 12 shows information on cultural participation by country of birth, with statistics presented for the following categories: the native-born population (those people born in the reporting country); the population born in an EU Member State (other than the reporting country); the population born outside the EU (in a non-member country).
Native-born and EU-born populations recorded almost identical cultural participation rates
In 2015, there was a slight difference between EU-Member States in cultural participation rates for the native-born population (63.2 % took part in a cultural activity during the 12 months prior to the survey) and the EU-born population (62.7 %). By contrast, the rate for people born outside the EU was somewhat lower, at 53.2 %.
The highest levels of cultural participation for people born in the EU (other than in the reporting Member State) were recorded in the Netherlands, Portugal, Sweden and most notably Finland (82.9 %), while the highest participation rates for people born outside the EU were recorded in Ireland, Finland, Sweden and most notably Denmark (76.5 %); these figures may reflect, at least to some degree, the integration of foreign-born populations.
It is interesting that in Ireland, Hungary, Malta and Portugal both foreign-born populations — those born in the EU and those born outside the EU — recorded higher cultural participation rates than the native-born population, while the EU-born population had a higher rate than the native-born population in Greece, Croatia and Lithuania, and the population born outside the EU had a higher rate than the native-born population in Bulgaria.
In 2015, some 44.1 % of the European Union population that was born in an EU Member State (other than the one in which they were living) reported that they made a visit to a cultural site. This share was somewhat higher than the corresponding participation rates for the same group of people going to the cinema (40.0 %) or attending a live performance (38.0 %). A similar analysis for people born outside the EU reveals that they were more likely to go to the cinema (36.5 %), rather than visit a cultural site (33.7 %) or attend a live performance (29.0 %).
In 13 out of 25 EU Member States (data not available for Romania and Slovakia), going to the cinema was the most popular cultural activity among people born outside the EU, with participation rates for this group rising to more than 50.0 % in Denmark, Ireland and Luxembourg. Also in Denmark, Hungary, Finland and Sweden more than half of the population born outside the EU took part in visits to cultural sites, while only in one of the EU - Member States (in Hungary) more than half of the population born outside the EU attended a live performances.
Practice of artistic activities
As part of the EU-SILC ad-hoc module on social and cultural participation in 2015, EU residents were also asked about their active cultural pursuits, specifically whether or not they took part in any of the following artistic activities: playing a musical instrument, composing music, singing, dancing, acting, photography/film-making, drawing, painting, sculpture, other visual arts/handcrafts, writing poems/short stories/fiction, and so on.
More than one third of the adult population practised one or more artistic activities
In 2015, the share of the EU adult population (aged 16 years or more) that reported that they pursued at least one artistic activity (during the 12 months prior to the survey) stood at just over one third (34.4 %). A more detailed analysis reveals that more than one sixth (17.4 %) of the EU population practised at least one artistic activity every week (see Figure 13); note these figures include the 5.2 % share of the population that practised every day. By contrast, a majority (65.7 %) of adults in the European Union did not practise any artistic activity.

(%, share of population aged ≥16 years)
Source: Eurostat (ilc_scp07)
Figure 14 focuses on adults who practised an artistic activity at least once every month. Finland (60.8 %) and Germany (56.1 %) were the only EU Member States where, in 2015, a majority of the adult population said that they practised an artistic activity at least once every month; they were followed by Austria (47.0 %) and Denmark (42.4 %). At the other end of the range, less than 15.0 % of the adult population in France, Croatia and Portugal practised an artistic activity at least once every month, with the lowest share recorded in Romania (6.4 %). The highest proportion of adults practising an artistic activity at least every week was also recorded in Finland (38.1 %) in 2015, followed by Germany (29.7 %), while Malta, Austria, the Netherlands, Sweden and Denmark each recorded shares over 25 %.
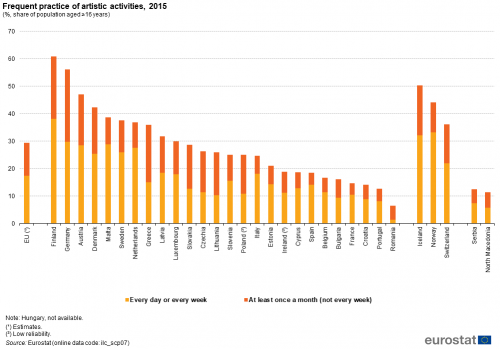
(%, share of population aged ≥16 years)
Source: Eurostat (ilc_scp07)
Table 3 provides a detailed analysis of the frequency with which people (aged 16 years or more) undertook artistic activities. There were 16 Member States across the EU (no data available for Hungary) where the most common frequency for practising an artistic activity was at least once a week but not every day, while there were nine Member States where the most common frequency for practising an artistic activity was at least once a month (but not every week).
The highest shares of adults practising an artistic activity at least once a week but not every day were recorded in Finland (24.1 %), Germany (21.6 %), Austria (20.4 %) and the Netherlands (20.2 %). The highest shares of adults declaring they practised an artistic activity every day were recorded in Finland (14.0 %) and Malta (13.7 %).
There were seven Member States — Cyprus, Belgium, Bulgaria, France, Croatia, Portugal and Romania — where more than four out of every five members of the population (aged 16 years or more) did not practise any artistic activity during 2015; the highest share was recorded in Romania (87.0 %).

(%, share of population aged ≥16 years)
Source: Eurostat (ilc_scp07)
Main reasons for not participating in cultural activities
This final section also draws on information from the EU-SILC ad-hoc module on social and cultural participation in 2015 and focuses on reasons for not participating in specific cultural activities.
Reasons for not participating in cultural activities
Respondents to the EU-SILC ad-hoc module in 2015 were given four choices to explain their lack of participation in cultural activities:
- financial reasons (they could not afford to take part);
- a lack of interest (they were not interested in taking part);
- a lack of proximity (there were no venues, for example, a cinema, theatre or museum nearby; note this reason concerns issues linked to both physical distance and to accessibility); and
- other reasons.
Note: data (percentages) are presented as shares of the population not participating in the three specified cultural activities (not of the total target population of the survey).
More than one third of the adult population who did not participate in cultural activities cited a lack of interest as their main reason
Figure 15 shows the main reasons why the population of the European Union (aged 16 years or more) did not participate in the three analysed cultural activities — going to the cinema, attending a live performance, visiting a cultural site. In 2015, the primary reason for not participating was a lack of interest, as cited by 39.1 % of respondents in the European Union who did not visit a cultural site, 37.5 % of respondents who did not go to the cinema and 36.6 % of respondents who did not attend a live performance. Financial reasons were the second most often declared reason for not participating in cultural activities, as cited by: 18.4 % of respondents in the EU who did not attend a live performance; 17.1 % of respondents who did not go to the cinema; 15.0 % of respondents who did not visit a cultural site. The share of the EU adult population that cited a lack of proximity as the main reason why they did not participate in cultural activities was consistently in single-digits: 8.6 % of those who did not go to the cinema, 7.6 % of those who did not attend a live performance and 6.7 % of those who did not visit a cultural site. Note that a relatively high share — more than one third of adults not participating in cultural activities — of respondents cited other reasons as the principal explanation as to why they did not participate in cultural activities. This group may include people who did not have enough time to participate, people whose family responsibilities prevented them from participating and those who consumed cultural content through alternative means (for example, watching films/concerts on television, DVD or Blu-rays, or through streaming services).

(%, share of non-participants)
Source: Eurostat (ilc_scp05)
As noted above, the primary reason for not participating in cultural activities was a lack of interest. In 2015, there were 15 EU Member States where the greatest lack of interest among non-participants was recorded for those people who did not visit a cultural site, while there were six Member States where the greatest lack of interest concerned going to the cinema and six where it was for attending a live performance.
In Ireland, Greece, Malta, the Netherlands, Austria and Sweden, more than half of all adults (aged 16 years or more) who did not participate in one or more of the three cultural activities in 2015 gave a lack of interest as the main reason for their non- participation; this was also the case in Belgium (for attending live performances and visiting cultural sites) and in Portugal and Slovenia (for going to the cinema).
In 2015, the Netherlands consistently recorded the highest proportion of non-participants citing a lack of interest as the primary reason for not taking part in each of the three activities: 67.7 % of non-participants were not interested in visiting cultural sites, 66.6 % were not interested in going to the cinema and 61.8 % were not interested in attending live performances. By contrast, a relatively low share of non-participants in Lithuania cited a lack of interest as their main reason for not taking part in cultural activities (a higher share cited financial reasons): 21.6 % of non-participants were not interested in visiting cultural sites, 15.0 % were not interested in going to the cinema and 12.9 % were not interested in attending live performances.

(%, share of non-participants)
Source: Eurostat (ilc_scp05)
A relatively high share of people who did not attend live performances cited finance as the main reason for not participating
Figure 17 concerns those non-participants in cultural activities who cited financial reasons as the principal explanation as to why they did not take part. In 2015, the highest share of non-participants for financial reasons was recorded among people (aged 16 years or more) who did not attend a live performance — this was the case in 19 of the EU Member States. There were seven Member States where the highest proportion of people citing finance as the principal reason for not participating in a cultural activity was recorded among those who did not go to the cinema, while Slovenia was the only Member State where the highest share of non-participants citing financial reasons was recorded among those who did not visit a cultural site.
In Greece and Spain, more than a quarter of all non-participants (aged 16 years or more) in 2015 cited financial reasons as the primary explanation as to why they did not go to the cinema (27.7 % and 26.7 % respectively). For people who did not attend live performances, financial reasons was the primary explanation in Lithuania (38.1 %), Greece (33.6 %), Latvia (28.1 %) and Spain (25.8 %). Less than 10.0 % of non-participants in Finland, Malta, Luxembourg, Sweden and Croatia cited financial reasons as the principal explanation as to why they did not take part in each of the three cultural activities shown in Figure 17.
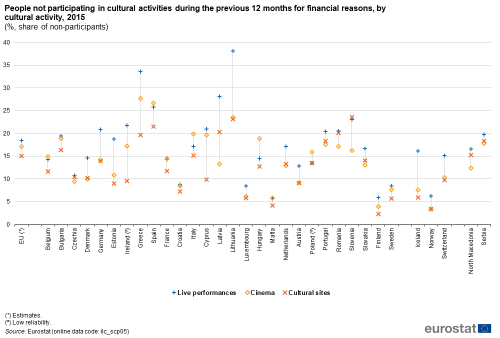
(%, share of non-participants)
Source: Eurostat (ilc_scp05)
Proximity was rarely cited as the main reason for not participating in a cultural activity'
Figure 18 completes this section by providing information on non-participants (aged 16 years or more) who cited proximity reasons as the principal explanation for their non-participation. In 2015, the highest share of people not participating for proximity reasons was recorded among those who did not go to the cinema: this pattern was observed in 16 EU Member States. There were seven Member States where the highest share of non-participants citing proximity reasons was recorded among people who did not visit a cultural site and there were three Member States where the highest proportion was recorded among people who did not attend a live performance; note that in France an equal share of non-participants at live performances or cultural sites cited proximity as the main reason for their non-participation.
Although proximity had a relatively small influence in explaining non-participation, it was cited by more than one fifth of people not participating in each of the three cultural activities in Romania: for proximity reasons, 29.3 % did not go to the cinema, 24.3 % did not attend a live performance, and 22.3 % did not visit a cultural site. Equally, around a quarter of people in Latvia (26.8 %) and Lithuania (23.2 %) who did not go to the cinema cited proximity as the main reason. Proximity was cited by a very low proportion — less than 5.0 % — of non-participants in Malta, Belgium, Cyprus, the Netherlands, Luxembourg and Czechia.

(%, share of non-participants)
Source: Eurostat (ilc_scp05)
Source data for tables and graphs
Data sources
The data presented in this article are largely based on information from an ad-hoc module on social and cultural participation that formed part of EU statistics on income and living conditions (EU-SILC) in 2015. The data were collected in all 27 EU Member States, in three of the EFTA countries (Iceland, Norway and Switzerland), as well as in North Macedonia and Serbia. The target population was people aged 16 years or more, while the reference period was the 12 months prior to the survey.
The questionnaire of the 2015 ad-hoc module covered the following cultural activities:
- going to the cinema (in other words, film screenings at motion-picture theatres);
- attending live performances by professionals or amateurs (for example theatre, dance, music);
- visiting cultural sites (trips to historical monuments, museums, art galleries or archaeological sites); and
- practising of artistic activities (for example, playing an instrument, composing music, singing, dancing, acting, photography/film-making, drawing, painting, sculpting, other visual arts/handcrafts, writing poems/short stories/fiction, and so on).
The 2015 EU-SILC ad-hoc module was extended (compared with the 2006 exercise) to explore reasons for non- participation in cultural activities.
Note: an aggregate was created for the indicator on cultural participation which covers the first three of these cultural activities: for people who went to the cinema and/or attended live performances and/or visited cultural sites (in other words those who participated in at least one of the three activities).
Context
Culture is one of Europe’s greatest assets: it is a source of values, identity and a sense of belonging; it also contributes towards well-being, social cohesion and inclusion. The cultural and creative sectors may also provide a stimulus for economic growth, job creation and international trade.
That is why culture is becoming increasingly important within the EU. In accordance with Article 167 of the Lisbon Treaty, the EU shall contribute to the flowering of the cultures of the Member States, while respecting their national and regional diversity and at the same time bringing the common heritage to the fore.
The EU supports these objectives through the Creative Europe programme, as well as a number of policy actions set out in the Work Plan for Culture (2015-2018) and the Work Plan for Culture (2019-2022). The latter, adopted by EU culture ministers in November 2018, sets out the main priorities for European cooperation in cultural policymaking: sustainability in cultural heritage; cohesion and well-being; an ecosystem supporting artists, cultural and creative professionals and European content; gender equality; and international cultural relations.
The production of reliable, comparable and up-to-date cultural statistics, which provide a basis for sound cultural policymaking, is a cross-sectorial priority in the latest work plan. Eurostat compiles culture statistics from several different data collections to provide policymakers and other users with information on the main developments in the field of culture, covering issues such as education, employment, business, international trade, participation and consumption patterns.
Direct access to
- Culture (all Statistics Explained articles on culture)
- Culture (cult), see:
- Cultural participation (cult_pcs)
- Participation in cultural activities - EU-SILC survey (cult_pcs_ilc)
- Frequency of participation in cultural or sport activities in the last 12 months by sex, age, educational attainment level and activity type (ilc_scp03)
- Frequency of participation in cultural or sport activities in the last 12 months by income quintile, household type, degree of urbanisation and activity type (ilc_scp04)
- Reasons of non-participation in cultural or sport activities in the last 12 months by sex, age, educational attainment level and activity type (ilc_scp05)
- Reasons of non-participation in cultural or sport activities in the last 12 months by income quintile, household type, degree of urbanisation and activity type (ilc_scp06)
- Frequency of practicing of artistic activities by sex, age and educational attainment level (ilc_scp07)
- Frequency of practicing of artistic activities by income quintile, household type and degree of urbanisation (ilc_scp08)
- Participation in cultural activities - EU-SILC survey (cult_pcs_ilc)
- Guide to Eurostat culture statistics — 2018 edition
- European statistical system network on culture (ESSnet-Culture final report (2012))
- Cultural participation (ESMS metadata file — cult_pcs_esms)
- Income and living conditions (ESMS metadata file — ilc_esms)
- Ad-hoc modules for EU statistics on income and living conditions
- European Council Work Plan for Culture (2019-2022)
- European Council Work Plan for Culture (2015-2018)
- Regulation (EU) No 1295/2013 of the European Parliament and of the Council of 11 December 2013 establishing the Creative Europe programme (2014-2020)
- Communication from the Commission to the European Parliament, the Council, the European Economic and Social Committee and the Committee of the Regions on a European agenda for culture in a globalising world (COM(2007) 242)

