Archive:Small and large farms in the EU - statistics from the farm structure survey
Data from October 2016. Most recent data: Further Eurostat information, Main tables and Database. Planned article update: September 2018.
This article analyses differences between small and large farms, classified in terms of either their physical or economic size. It is based on data that are drawn from the farm structure survey (FSS) and focuses mainly on information relating to 2013. The statistics presented describe the structure of agricultural holdings (hereafter referred to as farms) within the European Union (EU), with data presented for the individual EU Member States and Norway. Note that in some cases the changes shown are amplified by changes in survey thresholds and the differences between countries are to some degree explained by the different survey thresholds.
Small farms have always been a cornerstone of agricultural activity in the EU. There is no fixed definition as to what constitutes a ‘small’ or a ‘large’ farm. In addition, there is no fixed definition as to when a small farm is rather a subsistence household producing food for its own consumption and is thus not an economic unit. For the purpose of the analyses presented in this article no cut-off thresholds for identifying subsistence households have been introduced. There are two main criteria that have been used to delineate farm size: the majority of the article is based on a classification of farms in economic terms based on their standard output, while the final part of the analysis provides an alternative measure, based on the utilised agricultural area (UAA).
Small farms support rural employment and can make a considerable contribution to territorial development, providing specialist local produce/products as well as supporting social, cultural and environmental services. Although the EU’s agricultural sector remains characterised by a high number of very small farms, there is a tendency towards consolidation, with large farms accounting for a growing proportion of the land farmed in the EU.
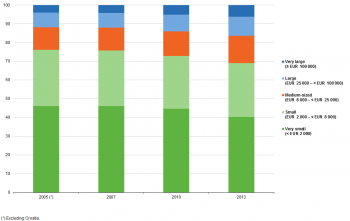
(% of total)
Source: Eurostat (ef_kvecsleg)
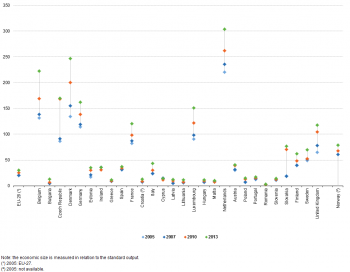
(thousand EUR)
Source: Eurostat (ef_kvftaa)
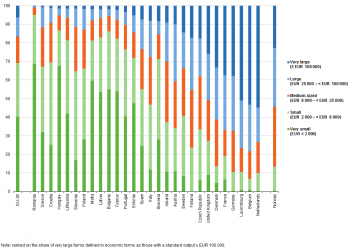
(% of total)
Source: Eurostat (ef_kvecsleg)
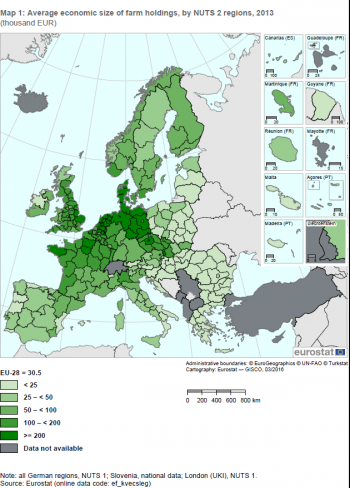
(thousand EUR)
Source: Eurostat (ef_kvecsleg)
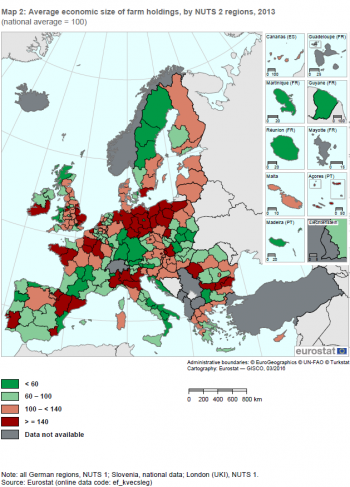
(national average = 100)
Source: Eurostat (ef_kvecsleg)
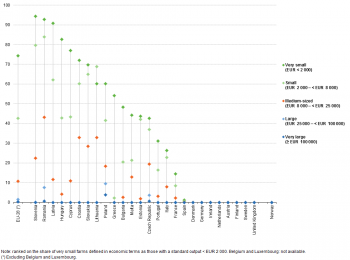
(%)
Source: Eurostat (ef_kvecsleg)
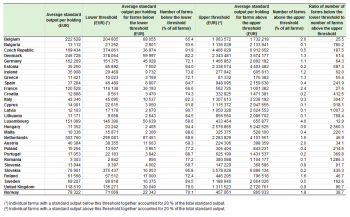
Source: Eurostat (ef_kvecsleg)Source: Eurostat (FSS — farm structure survey)
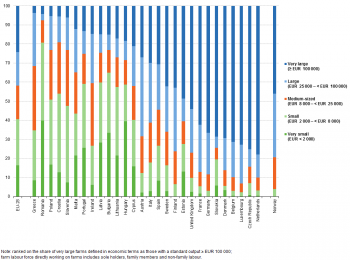
(% of total AWUs)
Source: Eurostat (ef_kvecsleg)
(% of total labour force in AWUs)
Source: Eurostat (ef_olfftecs)

(% of total labour force in AWUs)
Source: Eurostat (ef_olfaa)
(% of total)
Source: Eurostat (ef_olfaa)Source: Eurostat (Farm Structure Survey)

(% of total)
Source: Eurostat (ef_olfaa)Source: Eurostat (Farm Structure Survey)

(% of total)
Source: Eurostat (ef_olfaa)Source: Eurostat (Farm Structure Survey)

(% of regular labour force in AWUs)
Source: Eurostat (ef_lflegecs)
(% of regular labour force in AWUs)
Source: Eurostat (ef_lflegecs)
(% of total)
Source: Eurostat (ef_oluecsreg)

(% of total)
Source: Eurostat (ef_kvftecs)
(% of total)
Source: Eurostat (ef_oluecsreg)

(% of total)
Source: Eurostat (ef_oluecsreg)

(% of total)
Source: Eurostat (ef_olsecsreg)
(% of total)
Source: Eurostat (ef_olsecsreg)

Source: Eurostat (ef_kvftaa)
(% of total)
Source: Eurostat (ef_kvftaa)

(% of total)
Source: Eurostat (ef_kvftaa)

(% of total)
Source: Eurostat (ef_kvftaa)
Main statistical findings
Key indicators — some background
The total number of farms in the EU fell by more than one quarter in less than a decade
For several decades, the number of farms in the EU has followed a downward path. Between 2005 and 2013 the total number of farms in the EU-27 fell by 26.2 %, equivalent to an average decline of 3.7 % per annum. The largest declines in farm numbers were recorded in Slovakia (-12.5 % per annum), Bulgaria (-8.9 % per annum), Poland (-6.6 % per annum), Italy (-6.5 % per annum), the Czech Republic (-5.8 % per annum), Latvia (-5.5 % per annum) and the United Kingdom (-5.3 % per annum). By contrast, Ireland was the only EU Member State to record an increase in its number of farms between 2005 and 2013, with an average increase of 0.6 % per annum, equivalent to an additional 7 thousand farms.
There was little change in the utilised agricultural area farmed in the EU during recent years, as the average rate of change was 0.1 % per annum for the EU-27 between 2005 and 2013. The total utilised agricultural area for the EU-28 stood at 174.6 million hectares in 2013. This relatively stable agricultural area, coupled with a declining number of farms has resulted in farms across the EU becoming, on average, bigger. Some of the fastest changes were recorded among those Member States that joined the EU in 2004 or more recently, as a process of structural adjustment took place.
One third of the farms in the EU were located in Romania
The structure of agriculture in the EU Member States varies as a function of differences in geology, topography, climate and natural resources, as well as the diversity that is found in terms of (former) political and economic systems, regional infrastructure and social customs. The differences witnessed between Member States in relation to the average size of their farms is however largely linked to ownership patterns, as those countries with high numbers of small farms are characterised by semi-subsistence, family holdings, whereas larger farms are more likely to be corporately-owned, joint stock and limited liability farms, or cooperatives.
Romania accounted for one third (33.5 %) of the total number of farms in the EU-28 in 2013, while Poland (13.2 %) was the only other EU Member State to record a double-digit share; many of the farms in these two Member States can be considered subsistence households. In terms of utilised agricultural area, most agricultural land was found in France (15.9 % of the EU-28 total in 2013), followed by Spain (13.3 %), while the United Kingdom (9.9 %), Germany (9.6 %), Poland (8.3 %) and Romania (7.5 %) had the next highest shares.
Economic size of farms
The majority of this article analyses the structure of farms in the EU in economic terms, based on their standard output, a measure of the monetary value of agricultural output at farm-gate prices for crops and livestock; note that the standard output does not take account of input costs and therefore does not provide an indication as to the profitability of farms. Five different classes have been defined according to their economic size: very small; small; medium-sized; large; and very large. Note that the final part of the main statistical findings in this article provides an alternative analysis, based on the physical size of farms, as measured by their utilised agricultural area.
In 2013, there were 4.4 million farms in the EU-28 that had a standard output that was less than EUR 2 000, while a further 3.1 million farms had an output within the range of EUR 2 000–EUR 8 000. Together these very small and small farms accounted for more than two thirds (69.1 %) of all the farms in the EU-28 (see Figure 1), whereas their share of standard output was considerably lower, at 5.0 %. This may be explained, at least in part, by the relatively high number of very small, subsistence households in the EU (see below for more information concerning farms where more than 50 % of their output is self-consumed).
By contrast, there were 680 thousand farms in the EU-28 with a standard output of at least EUR 100 000; these very large farms accounted for 6.3 % of the total number of farms and for 71.4 % of the agricultural standard output in 2013. It should be noted that while many of these farms with a high level of standard output occupied considerable areas of agricultural land, there are specific types of farming which may have considerable output in monetary terms from very small areas of agricultural land, for example, horticulture or poultry farming.
The standard output of farms in the EU increased by almost 56 % between 2005 and 2013
The Netherlands recorded the largest farms, generating an average of EUR 303 800 of standard output (see Figure 2); note that many farms in the Netherlands are specialised in growing high value products, for example, flowers, fruit and vegetables (often under glass). The average economic size of farms was also relatively high in Denmark, Belgium, the Czech Republic, Germany, Luxembourg, France and the United Kingdom, ranging from EUR 246 700 to EUR 117 800; none of the other EU Member States recorded an average economic size of more than EUR 80 000 per farm.
At the other end of the range, there were 10 EU Member States where the average economic size of farms was below EUR 15 000, all but one of these recorded a ratio in 2013 that was within the range of EUR 10 000–15 000, the exception being Romania, where farms averaged EUR 3 300 of standard output. As such, comparing the results for the Netherlands with those for Romania, the average economic size of farms in the former was approximately 92 times as large as in the latter.
A high proportion of farms in the Benelux were very large
There were considerable divergences between the EU Member States as regards the economic size of their farms in 2013 (see Figure 3). While 6.3 % of the total number of farms in the EU-28 were considered as being very large as a result of generating a standard output of at least EUR 100 000, this share was considerably higher in several Member States. Indeed, more than half of all the farms in the three Benelux Member States generated at least EUR 100 000 of standard output, peaking at 54.8 % in the Netherlands, while very large farms accounted for the highest share of the total number of farms in the United Kingdom (26.0 % of the total), Denmark (33.2 %), France (37.5 %) and Germany (37.8 %).
By contrast, there were nine EU Member States where the very small farms with less than EUR 2 000 of standard output were the most common economic size of farms. These farms were particularly prevalent in Romania (68.7 % of all farms) and Hungary (67.6 %), while they also accounted for more than half of the total number of farms in Malta, Bulgaria, Cyprus and Latvia. As such, farms in the western EU Member States tended, on average, to be much larger in economic size than those in many of the Member States that joined the EU in 2004 or more recently.
On average, farms in the German region of Sachsen-Anhalt had the highest standard output
Map 1 shows the average economic size of farms for NUTS level 2 regions. There were 35 regions across the EU-28 where the standard output per farm averaged at least EUR 200 000 (as shown by the darkest shade in the map). These regions were located in the Netherlands (every region except for Zeeland), Germany (eight NUTS level 1 regions), Belgium (four regions), Denmark, France and the United Kingdom (three regions each), the Czech Republic (two regions) and Slovakia (one region). Standard output per farm peaked at EUR 541 800 in the German region of Sachsen-Anhalt, while two other German regions — Mecklenburg-Vorpommern and Thüringen — were also present among the top five regions in the EU with the largest farms in economic terms; they were joined by the Czech capital city region of Praha and the Dutch region of Zuid-Holland.
At the other end of the range, there were 10 regions in the EU-28 where farms on average generated EUR 5 000 or less of standard output in 2013. All eight of the Romanian regions figured in this list, along with the Greek island region of Ionia Nisia and the Polish region of Podkarpackie. The region with the lowest level of standard output per farm (EUR 2 600) was Sud-Vest Oltenia in Romania.
The information presented in Map 2 is based on an alternative analysis of the economic size of farms. It shows differences in standard output between regions within a single EU Member State. The national average is used as a benchmark and the standard output in each region is shown as a percentage of the national average. Note that those Member States with only a single NUTS level 2 region have, by definition, a value of 100 for this indicator. The regions where farms tended to be larger than the national average (in economic terms) are shown in shades of orange, whereas the regions which were characterised by farms that were smaller than the national average are shown in green.
In several of the EU Member States, farms in the capital city region often had a relatively high level of standard output compared with the national average; this was particularly the case in the Czech Republic, Austria, Portugal and Slovakia (note that these capital city regions may also contain land that encircles the capital city itself) and the values recorded in some of these regions may be linked to farmers providing high value horticultural products to local markets. By contrast, the lowest average levels of standard output were recorded either in capital city regions, for example, Berlin or London (where there is practically no space for agricultural activity within the region) or in very remote, often upland/highland regions, where it may be difficult to farm or transport goods to market, for example, the overseas French regions of Guyane and La Réunion, the southern Polish region of Podkarpackie, the island Região Autónoma da Madeira (Portugal) and the Highlands and Islands of Scotland (the United Kingdom).
Almost three quarters of farms in the EU that are very small in economic terms were subsistent
Many small farms are characterised by the fact that farm holders may struggle to make a living. A characteristic of very small farms is that they are often subsistence households. Figure 4 shows the proportion of farms where more than half of the production of the farm is self-consumed, the information is once again analysed according to the economic size of farms. Across the whole of the EU-28, almost three quarters (74.4 %) of very small farms (in economic terms) consumed more than half of their own production in 2013, while just over two fifths (42.6 %) of small farms were classified as subsistent. A high proportion (the share rising above 90 %) of the very small farms in Latvia, Romania and Slovenia were subsistence households.
An alternative form of analysis is presented in Table 1. This analysis provides details as to the wide-ranging differences that exist in the average size of farms in the EU. Again it looks at the distribution of farms within each of the EU Member States according to their economic size, but instead of having fixed thresholds to determine the economic size of a farm, it classifies all farms into five groups called quintiles. All of the farms are ranked by economic size; the output of the smallest farms is combined until the sum reaches one fifth of the total standard output; the same approach is adopted for the next largest farms and so on until five groups of farms have been created, containing different numbers of farms, but each group accounting for one fifth of the total standard output. The information that is presented in this part of the analysis (using these quintiles) focuses on the large number of farms in the bottom quintile and small number of farms in the top quintile. The lower threshold shown in the table refers to the level of standard output below which the cumulative output of the smallest farms equates to one fifth of the national total; the upper threshold shows the level of standard output above which the cumulative output of the largest farms also equates to one fifth of the national total.
There were relatively few small farms in the Benelux countries, France and Austria. The smallest farms in Luxembourg that accounted for one fifth of standard output in 2013 made up 60 % of the total number of farms, while in Belgium and France one fifth of standard output was produced by the smallest two thirds of all farms and this share of farm numbers was just under 70 % in Austria and the Netherlands. By contrast the smallest farms in Slovakia that collectively generated one fifth of the total standard output made up 96 % of the number of farms, with this share also over 90 % in Hungary, Estonia, Bulgaria, the Czech Republic, Cyprus and Latvia.
The lower threshold below which one fifth of total standard output was generated by the smallest farms ranged across the EU Member States from a low of EUR 2 842 in Romania up to EUR 378 thousand in Denmark, with Slovakia and the Czech Republic both recording thresholds that were close to EUR 375 thousand. At the other end of the scale, the threshold above which one fifth of total standard output was generated by the largest farms reached EUR 4.5 million and EUR 3.6 million respectively in the Czech Republic and Slovakia, where just 0.5 % and 0.2 % of the total number of farms were in the top quintile. By contrast, there were relatively high numbers of farms in Luxembourg in the top quintile, where one fifth of total standard output was generated by the largest farms which made up 4.6 % of the farm population; the next highest shares were recorded in Belgium (2.6 %), France (2.4 %) and Austria (2.0 %).
A comparison between the number of farms in the top and bottom quintiles reveals that some of the widest disparities in the distribution of farms by economic size were recorded in Romania and Latvia: using the lower and upper quintiles for standard output there were, on average, more than one thousand smaller farms for each larger farm in 2013 in both of these EU Member States. However, the difference was even wider in Hungary, where this ratio peaked at 2 360 : 1. By contrast, there were relatively few smaller farms in Luxembourg for each larger farm (12.9 : 1), and there were less than 50 farms in the bottom quintile for each large farm in the top quintile in Belgium, France, Austria, Finland and the Netherlands; this was also the case in Norway.
Structure of the farm labour force
There were 22.2 million persons in the EU-28’s farm labour force in 2013. Although engaged in production on farms, these people did not necessarily work on a full-time basis. Information on the agricultural labour force may be converted into annual work units (AWUs), which correspond to a full-time equivalent person working a whole year. On this basis there were 9.5 million AWUs in the EU-28’s labour force (composed of sole holders, other family labour and non-family labour) directly working on farms in 2013. Note that a large part (4.2 million AWUs) of this labour force was composed of sole holders, while family members accounted for in excess of 3.0 million AWUs. As such, many members of the labour force do not work as paid employees and are instead paid in kind for their work. Note also that the overall figure for the number of AWUs was lower than the 10.8 million farms that were active across the whole of the EU in 2013 and as such, there was, on average, less than one AWU for each farm.
Of the 9.5 million AWUs of labour input on EU-28 farms in 2013, Poland accounted for just over one fifth (20.2 %) of the total, while the next highest share was recorded by Romania (16.3 %), where the agricultural labour force was almost twice the size as in Spain and Italy, which both accounted for 8.6 % of the EU-28 total. In 2013, average labour input per farm ranged from lows of 0.4 AWUs per farm in Romania, 0.5 AWUs in Cyprus and Malta and 0.7 AWUs in Greece, up to an average of 2.1 AWUs per farm in Slovakia and 2.3 AWUs in the Netherlands, peaking at 4.0 AWUs per farm in the Czech Republic.
Very large farms played an important role in providing agricultural labour opportunities
An analysis, based on the economic size of farms, shows that small farms (with a standard output of EUR 2 000 – < EUR 8 000) accounted for almost one quarter (24.2 %) of the EU-28’s agricultural labour force (composed of sole holders, other family labour and non-family labour) that worked directly on farms; an identical share was recorded for very large farms (with a standard output of ≥ EUR 100 000), with the shares of total regular labour input for the other size classes all quite similar, between 16.3 % and 17.7 % — see Figure 5.
There was a wide variation between the EU Member States as regards the share of their agricultural labour forces that were working on farms of different economic sizes in 2013. In Bulgaria (33.3 %) and Hungary (39.4 %), very small farms (with a standard output of < 2 000 EUR) accounted for a higher share of labour input than farms of any other size class. There were eight Member States where the largest agricultural labour force was recorded on small farms, as their share of the total number of AWUs rose above 40.0 % in Slovenia, Romania and Croatia. Medium-sized farms (with a standard output of EUR 8 000 EUR – < EUR 25 000) provided work to a greater share of the agricultural labour force than any other size class in Ireland (32.8 %) and Greece (33.9 %), while the highest shares of labour input in Malta, Italy and Austria were recorded for large farms (with a standard output of EUR 25 000 – < EUR 100 000). However, the most striking aspect of Figure 5 is that very large farms provided the highest share of agricultural labour input (in terms of AWUs) in almost half (13) of the EU Member States. Among these, there were nine where a majority of the labour force was working on very large farms, this share rising to more than three quarters of the total in the Czech Republic (75.2 %) and the Netherlands (78.0 %).
Farming is a predominantly family activity within the EU
As noted above, very small and small farms (in economic terms) are often unable to provide a viable income for farmers and their families. As such, they are often run either as part-time operations, in conjunction with other gainful activities, or to supplement pensions; these small farms are typically characterised by a high share of family labour. On larger farms it is more common to find that a higher share of the labour force is engaged on a full-time basis, and these farms are also more likely to employ non-family labour.
Approximately three quarters (76.5 %) of EU-28’s agricultural labour force in 2013 was provided by family members (either sole holders or other family members working on the farm). This share rose above 90.0 % in Ireland, Croatia, Slovenia and Poland and family labour accounted for more than half of the agricultural labour force in the vast majority of the other EU Member States: Estonia (46.4 %), France (40.9 %), Slovakia (27.6 %) and the Czech Republic (25.8 %) were the only exceptions to this rule, with a majority of their agricultural labour force being accounted for by non-family members.
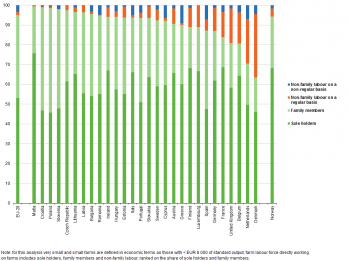
The relative importance of family labour was particularly pronounced in very small and small farms, defined here in relation to their economic size. Figure 6 shows that across the EU-28 more than half (53.2 %) of the labour input in very small and small farms was provided by sole holders. Family members accounted for more than two fifths (41.7 %) of the labour force in these very small and small farms, such that the share of non-family labour was relatively low, at 5.1 % of the total agricultural labour force. When very small and small farms did employ non-family labour they preferred to do so on a non-regular basis (3.4 %) rather than a regular basis (1.7 %).
Almost half of the labour force on very large farms in the EU was accounted for by non-family labour
Economies of scale and a higher degree of mechanisation may encourage some very large farms (in economic terms) to replace labour by capital and this results in quite different patterns of employment distribution. In 2013, very large farms accounted for 71.4 % of the standard output generated in the EU-28’s agricultural sector, which could be contrasted with their 24.1 % share of the agricultural labour force.
In the EU-28, non-family members accounted for almost two thirds (65.8 %) of the labour input in very large farms in 2013 (see Figure 7). Almost half (49.0 %) of the labour force in very large farms was composed of non-family workers employed on a regular basis, their share being almost three times as high as that for non-family labour employed on a non-regular basis (16.9 %).
In a majority (19) of the EU Member States, non-family labour accounted for more than half of the agricultural labour force on very large farms. In 2013, this was most notably the case in Hungary, Bulgaria, Estonia, the Czech Republic, Romania and Slovakia, where non-family labour accounted for more than 90 % of the labour input. It is interesting to note that sole holders accounted for less than 5.0 % of the labour input on farms in these Member States, suggesting that they often had a different ownership status (cooperatives or corporate farms).
By contrast, there were nine EU Member States where family labour (sole holders and other family members) accounted for a majority of the agricultural labour force in very large farms. In 2013, the share of family labour was within the range of 50.0–60.0 % in Greece, the United Kingdom, the Netherlands, Malta, Finland and Austria, rising to 64.7 % in Luxembourg, 65.1 % in Belgium and 82.3 % in Ireland. More information on family farming in the EU is provided in this [Agriculture_statistics_-_family_farming_in_the_EU article].
Older farm managers tended to work in very small and small farms
Of the 10.6 million farm managers in the EU’s agricultural sector in 2013, there were relatively few young farm managers (note that for this analysis there are no data available for Belgium or Croatia). Those aged less than 35 years accounted for 6.0 % of the total, while the highest share of farm managers was recorded among those aged 65 and above (some 3.3 million managers, or 31.1 % of the total). Agriculture is the economic sector in which it is most common to find people continuing to work after the age of 65.
Between 2005 and 2013, the share of young farm managers in the total number of managers in the EU fell slightly, as it had stood at 6.9 % for the EU-27; the share of farmers aged 65 years and above also fell during this period, while the largest relative gain was recorded among farmers aged between 55 and 64, as their share of the total number rose from 22.2 % of all EU-27 farm managers in 2005 to 24.7 % by 2013 (no data for Belgium or Croatia).
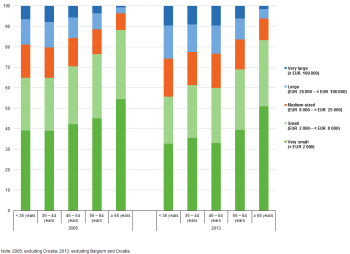
Elderly farm managers tend to work on very small and small farms (measured in economic terms) which are characterised by low levels of income and subsistence households; elderly farmers are less likely to have participated in professional training. While these very small and small farms tend to record relatively low levels of income, productivity and profitability, some play an important role in reducing the risk of rural poverty, providing additional income and food.
By contrast, young farmers tend to manage larger farms (in economic terms): this may be linked to the fact that they are more likely to have higher levels of educational attainment and to have followed professional training courses, which may lead to the introduction of new and innovative farming practices. As can be seen in Figure 8, during the period from 2005 to 2013 the share of young farm managers (aged less than 35 years) who were managing medium-sized, large and very large farms increased. The share of young farm managers who were managing smaller farms (measured in economic terms) was consequently lower.
More than half of the farm managers in very small and small Portuguese farms were aged 65 and above …
Figures 9 and 10 show the contrast (measured in economic terms) between the age of farm managers in very small and small farms on the one hand and very large farms on the other. In a majority (19) of the 26 EU Member States for which data are available (no data for Belgium and Croatia), elderly managers (aged 65 and above) in very small and small farms accounted for the highest share of farm managers (see Figure 9). In 2013, the share of those aged 65 and above in the total number of farm managers of small and very small farms peaked at 56.4 % in Portugal, while shares of more than 40.0 % were also recorded in Italy, the Netherlands, Cyprus, Romania, Spain and Bulgaria. In the remaining EU Member States, where those aged 65 and above did not account for the highest share (among any age group) of farm managers of small and very small farms, the most common age group was either 55–64 years (four of the Member States) or 45–54 years (three of the Member States). At the other end of the age spectrum, Poland (10.3 %) stood out, as it was the only Member State where farm managers aged less than 35 years accounted for a double-digit share of the total number of farm managers in very small and small farms.
… while more than half of the managers of very large Romanian farms were aged less than 35 years
In 2013, more than one third (35.5 %) of EU farm managers working in very large farms were aged 45–54 years, the highest share for any of the age groups shown in Figure 10. By contrast, those aged less than 35 years accounted for just less than one tenth (9.4 %) of the total, a share that was similar to that recorded for managers aged 65 and above (8.1 %). This pattern was repeated in most (22) of the 26 EU Member States for which data are available (again no data for Belgium or Croatia), with the share of farm managers aged 45–54 years peaking at 42.3 % for very large farms in Austria. Among the four exceptions, three — the Czech Republic, Hungary and Slovakia — reported that the most common age of managers in very large farms was 55–64 years. However, the largest exception that stands out in Figure 10 is the high proportion (57.3 %) of farm managers in very large Romanian farms who were aged less than 35 years: their share was more than six times as high as the EU average.
There was a higher propensity for women to work on smaller farms
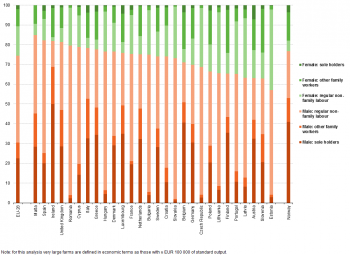
An analysis of the farm labour force by sex and by economic size is not available for the non-regular labour force. For this reason, the data presented in Figures 11 and 12 focus exclusively on the regular labour force (composed of sole holders, other family labour and non-family labour). In 2013, the EU-28’s regular agricultural labour force was composed of 8.7 million AWUs; men accounted for almost two thirds (64.8 %) of the total. This pattern was repeated among all of the EU Member States, as the share of the regular labour force accounted for by men was consistently higher than that for women. Men accounted for more than four fifths of the regular labour force in Ireland and Cyprus, with their share peaking at 88.1 % in Malta. At the other end of the range, there was almost parity between the sexes in Latvia, Lithuania and Poland, as the male share of the regular labour force was situated within the range of 53.7–54.9 %.
The distribution of agricultural work between the sexes was somewhat more balanced in very small and small farms (measured in economic terms). In 2013, men accounted for 55.8 % of the EU-28’s regular labour force in these farms. More than three quarters of the regular labour force in very small and small farms in Ireland, Denmark and Malta was composed of men, while at the other end of the scale, a small majority (50.6 %) of the labour force in such farms in Lithuania was composed of women, the only Member State to report a gender gap in favour of women.
A closer analysis of the information for sole holders reveals that there were higher numbers of male (compared with female) sole holders in very small and small farms for each of the EU Member States. Across the whole of the EU-28, there were 2.2 times as many male as female sole holders in 2013, while there were between 7 and 8 times as many male sole holders in Germany, the Netherlands, Denmark and Finland, rising to 15 times as many in Malta. At the other end of the range, the number of male and female sole holders in very small and small farms was almost balanced in the Baltic Member States and Austria.
Figure 12 shows a similar set of information for very large farms (again on the basis of the economic size of farms). The gender gap in these farms was more pronounced, as men accounted for almost three quarters (74.4 %) of the EU-28’s regular farm labour force in 2013. It is also interesting to note a majority of the labour input for both of the sexes came from regular non-family employment.
Among the EU Member States, the regular male labour force in very large farms was consistently larger than the regular female labour force, with their share rising to more than four fifths of the regular labour force in the United Kingdom, Ireland, Spain and Malta (where the highest share was once again recorded, at 84.9 %). The highest proportion for women working in very large farms was recorded in Estonia, where the regular female labour force represented 43.0 % of the total.
A closer analysis of the information for sole holders reveals that a much higher proportion of very large farms had male (compared with female) sole holders. In 2013, the ratio of male to female sole holders in very large farms was 11.5 : 1 in the EU-28. Considerably higher ratios were recorded in a number of the EU Member States, most notably in the United Kingdom, Ireland, Denmark and the Netherlands. By contrast, in Latvia the number of male sole holders in very large farms was 3.7 times as high as the corresponding number of female sole holders.
Land use and farming specialisation
Larger farms tended to engage in more specialised forms of farming …
In terms of farming activity, Figure 13 shows that across the EU-28 in 2013, smaller farms (in economic terms) tended to practise a range of different activities on the farm, for example, mixed cropping, mixed livestock, or mixed crop and livestock farming. When they did specialise in a single type of farming this tended to be either pig or poultry farming, or the production of permanent crops (especially olives). Larger farms were more likely to specialise in a particular type of farming, especially horticulture, dairy farming, pig farming and cattle rearing.
Almost all (97.5 %) of the farms in the EU-28 that had mixed pig and poultry farming (mixed granivores) were very small and small farms. These farms also accounted for more than four fifths of the total number of several other types of farming: specialised poultry farming; combined various crops and livestock farming; and specialist olive farming. By contrast, more than half (53.3 %) of the farms in the EU-28 that were specialist dairy farms were large or very large farms, while close to two thirds of all specialist indoor horticulture farms and other horticulture farms were also large or very large farms. Figure 15 provides more information as to how the dominant farm type varies with the economic size of farms.
… although small and very small farms were specialised in olive farming
The analysis of farming types according to the economic size of farms is extended in Figure 16, which is based on an analysis of the utilised agricultural area rather than the number of farms. It is important to note that certain types of farming can be practised without any agricultural area: this is the case, for example, in relation to animals grazing on common land, animals reared entirely indoors, or specialised horticulture (such as growing mushrooms), as common land and indoor areas/buildings are excluded from the total utilised agricultural area. That said, Figure 14 confirms many of the previous results, with the caveat that the relative shares of large and very large farms were, unsurprisingly, higher in terms of their share of the total utilised agricultural area than their share of the number of holdings.
In 2013, large and very large farms accounted for more than 90 % of the total utilised agricultural area in the EU-28 that was devoted to the following activities: other horticulture; specialist dairying; and specialist pig farming. Large and very large farms accounted for more than half of the total agricultural area utilised by all but one of the different types of farming shown in Figure 14. The only exception was specialist olive farming, where very small and small farms accounted for 39.4 % of the utilised agricultural area, compared with 35.7 % for large and very large farms.
In very small and small farms there was a wide range of different patterns of crop specialisation…
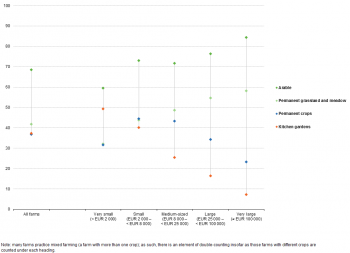
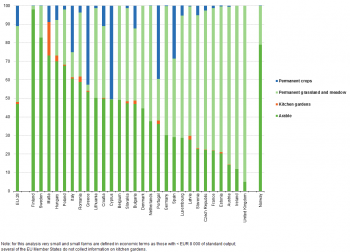
Figures 15 and 16 show the different patterns of crops (according to the economic size of farms) with a focus on very small and small farms on the one hand, and very large farms on the other. In 2013, almost half of the total agricultural area utilised by very small and small farms in the EU-28 was devoted to arable land (47.0 %), while permanent pasture and meadow accounted for approximately two fifths (40.9 %), leaving permanent crops with slightly more than one tenth (11.0 %) of the area utilised by these farms; kitchen gardens had a very small share (1.1 %).
In 2013, arable land accounted for more than four fifths of the total agricultural area utilised by very small and small farms in Sweden and Finland, while permanent grassland and meadow accounted for a similar share of the utilised agricultural area among very small and small farms in Austria, Ireland the United Kingdom, where a high proportion of very small and small farms were specialised in grazing livestock. A different pattern was observed in most of the southern EU Member States, most notably in Cyprus, Greece and Portugal, where a relatively high proportion of the utilised agricultural area of very small and small farms was devoted to permanent crops (for example, olives and grapes).
… whereas very large farms tended to specialise in arable farming
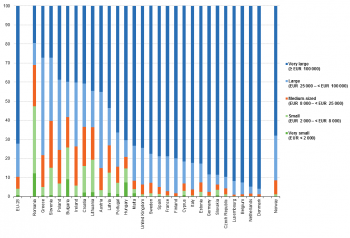
While the patterns of crops were quite varied for very small and small farms (with climate and topography appearing to play an important role in determining the broad crop patterns), very large farms tended to specialise in arable farming. Figure 16 shows that in 2013 just over two thirds (67.9 %) of the utilised agricultural area of very large farms in the EU-28 was devoted to arable land, with permanent grassland and meadow accounting for more than one quarter (28.4 %) of the total, and permanent crops for the remaining 3.7 %.
Among the EU Member States, the relative specialisation in arable farming (as measured by its share of the utilised agricultural area) on very large farms was particularly pronounced in Latvia, Cyprus, Malta, Denmark, Lithuania and Finland, where arable land accounted for more than 90.0 % of their total area in 2013. There were only five Member States where less than half of the total agricultural area on very large farms was utilised as arable land: in Luxembourg, Croatia, Ireland, Portugal and Greece a majority of the agricultural area of very large farms was devoted to permanent pasture and meadow. Italy, Spain and Portugal were the only Member States where permanent crops had a double-digit share of the agricultural area utilised by very large farms.
Almost three quarters of the livestock in the EU were reared on very large farms
Livestock units (LSUs) facilitate the aggregation of livestock data for different species and ages, by the use of coefficients to make the data on different animals comparable. On this basis, the livestock herd in the EU-28 equated to 130.2 million units in 2013: the highest shares were recorded in France (16.8 %), Germany (14.1 %), Spain (11.1 %) and the United Kingdom (10.2 %).
The analyses presented in Figures 17 and 18 relate to livestock farming, with an analysis according to the economic size of farms. On this basis, almost three quarters (72.2 %) of the livestock units in the EU-28 in 2013 were reared on very large farms. In recent years there has been a considerable shift towards a higher number of livestock units being reared on very large farms: their number rose by almost 10 million units between 2005 and 2013 to reach 94 million LSU. By contrast, the number of livestock units fell for all of the remaining size classes during this period, with the total number of livestock units reared on very small farms more than halving (to just over one million LSUs). A more detailed analysis suggests that some of the largest farms in the EU increased their livestock density, suggesting they were making use of more intensive farming practices. The rising number of livestock units on very large farms and falling numbers for all other size classes resulted in a large increase in the share of livestock units reared on very large farms, as shown in Figure 17.
The relative importance of very large farms (in economic terms) for livestock rearing is clear in Figure 18, which shows that these farms accounted for the highest share of livestock units in 2013 in all but three of the EU Member States. Indeed, more than three quarters of all livestock units were reared on very large farms in half of the Member States, with this share peaking at over 90 % in the Benelux Member States and Denmark.
By contrast, large farms accounted for the highest share of livestock units in two of the EU Member States in 2013: their share rose to one third (33.3 %) of the total in Slovenia and to more than half (51.2 %) in Greece, greater than the shares of any other economic size classes. The only other exception — where neither very large nor large farms recorded the highest share of livestock units — was Romania, where more than one third of all livestock units were reared on small farms. Romania also stood out in relation to its share of livestock units reared on very small farms, insofar as they accounted for 12.2 % of the total, the only Member State where a double-digit share was recorded. Very small farms also had relatively high shares of the total number of livestock units in Bulgaria (9.0 %) and Hungary (7.5 %); in the remaining Member States their share never rose above 2.2 %.
Physical size of farms
This final part of the analysis provides an alternative analysis of farm size, based instead on the physical size of farms, as measured by their utilised agricultural area. For this analysis, farms have been split into four different classes so as to identify very small, small, medium-sized and large farms. Table 2 shows that there was a total of 10.8 million farms in the EU-28 in 2013; the vast majority of these were relatively small, family-run farms which are often passed down from one generation to the next. Indeed, in 2013, there were 4.9 million physically very small (< 2 hectares of utilised agricultural area) and 4.5 million physically small (2 – 20 hectares) farms in the EU-28. Together, these farms with less than 20 hectares of utilised agricultural area accounted for almost 9 out of 10 (86.3 %) farms in the EU and for more than two thirds (68.1 %) of the labour force directly working on farms. Unsurprisingly, the relative weight of physically very small and small farms was much lower in terms of their share of the utilised agricultural area, which stood at less than one fifth (18.5 %) of the total.
By contrast, there were 337 thousand physically large farms in the EU-28 — defined here as those with at least 100 hectares of utilised agricultural area. Together they accounted for 3.1 % of all farms in 2013 and they provided 12.5 % of the total agricultural labour force that was directly working on farms. Their share of the total utilised agricultural area was considerably higher, at 52.1 %. Given that these physically large farms occupied more than half of the total agricultural area, the farming practices that they adopt may be considered to be particularly important from an environmental perspective.
Physically very small and small farms (with less than 20 hectares of utilised agricultural area) accounted for just over two thirds (68.1 %) of the EU-28 farm labour force that was directly working on farms. There were much higher shares recorded in some of the EU Member States, as physically very small and small farms provided more than 80 % of the labour input in Portugal, Poland, Cyprus, Croatia, Slovenia and Greece, rising to more than 90 % in Romania and Malta (where the highest share was recorded, at 98.4 %).
By contrast, physically large farms (with at least 100 hectares of utilised agricultural area) provided work to more than two thirds of the farm labour force in Slovakia (67.6 %) and the Czech Republic (68.2 %). These shares were considerably higher than in any of the other EU Member States, as the next highest shares were recorded in the United Kingdom, Denmark and Estonia, where 40–50 % of the agricultural labour force was working on physically large farms (see Table 2).
Farms in the Czech Republic were, on average, 115 times as large as in Malta
Combining these basic indicators for the number of farms and the utilised agricultural area, the average physical size of each farm in the EU-28 stood at 16.1 hectares in 2013. This marked a considerable increase when compared with the corresponding ratio from 2005, when the average for the EU-27 had been 11.9 hectares.
In 2013, the largest average farm size (in physical terms) was recorded in the Czech Republic, at 133.0 hectares of utilised agricultural area, followed at some distance by the United Kingdom (93.6 hectares) and Slovakia (80.7 hectares). There were six EU Member States that reported their average farm size was less than 10.0 hectares in 2013, they were: Hungary, Greece, Slovenia, Romania, Cyprus and Malta (where the lowest average was recorded, at 1.2 hectares per farm). Comparing these two extremes, on average, farms in the Czech Republic were approximately 115 times as large as in Malta.
Physically large farms accounted for more than half of the utilised agricultural area
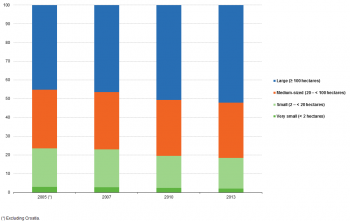
Physically large farms in the EU-28 utilised 91.0 million hectares of agricultural area in 2013, which was 1.8 times as high as the area utilised by physically medium-sized farms, 3.2 times as high as the area utilised by physically small farms, and 25.4 times as high as the area utilised by physically very small farms. Figure 19 shows the division of the utilised agricultural area between farms of different physical sizes, and demonstrates the important role that is played by physically large farms within the EU’s agricultural sector.
In 2013, physically large farms accounted for a majority (52.1 %) of the EU-28’s utilised agricultural area, which may be contrasted with a 45.2 % share recorded across the EU-27 in 2005. The total utilised agricultural area of physically large farms in the EU-27 rose by 12.6 million hectares between 2005 and 2013, equivalent to an overall increase of 16.2 %. The area occupied by farms classified to one of the other size categories fell, with the biggest reductions recorded for physically small farms.
Physically very small and small farms accounted for more than 19 out of 20 farms in Greece, Cyprus, Romania and Malta
In 2013, physically very small and small farms with less than 20 hectares of utilised agricultural area accounted for 95 % or more of all farms in Slovenia, Greece, Cyprus, Romania and Malta (see Figure 20). A closer analysis reveals that more than half (54.4 %) of all the physically very small farms in the EU-28 were located in Romania. By contrast, the proportion of physically very small and small farms was relatively low in Luxembourg (33.7 % of all farms), Finland (36.9 %) and the United Kingdom (38.1 %) and was also below 50 % in Ireland, France, Denmark, Germany and Belgium.
The share of physically large farms in the total number of farms peaked in the United Kingdom, at 22.1 %, while Luxembourg (21.6 %), France (20.7 %) and Denmark (20.3 %) were the only other EU Member States where physically large farms accounted for more than one fifth of the total. At the other end of the range, there were seven Member States where physically large farms accounted for less than 1.0 % of all farms: Croatia, Poland, Romania, Cyprus, Greece, Slovenia and Malta (where there were no physically medium-sized or large farms).
An analysis for 2013 reveals that the most common size of farm in the EU-28 was one with 2 – < 20 hectares of utilised agricultural area. These physically small (but not very small) farms accounted for the highest share of the total number of farms in half (14) of the EU Member States, while there were seven EU Member States where the highest number of farms (by physical size) was recorded among physically very small farms and another seven where physically medium-sized farms were most common.
In most EU Member States, a small number of physically large farms account for a high proportion of the agricultural area
Figure 21 shows the relative importance of different size farms in terms of their share of the utilised agricultural area. In 2013, there were 17 EU Member States where physically large farms had the highest share of the utilised agricultural area, with 14 reporting that these physically large holdings farmed more than half of the agricultural area, this share rising to more than four fifths of the total in Bulgaria (83.6 %), the Czech Republic (87.8 %) and Slovakia (90.4 %).
There were six EU Member States where the highest share of the utilised agricultural area was accounted for by physically medium-sized farms: of these, Austria, Finland, Ireland, Belgium and the Netherlands each reported that more than half of their agricultural area in 2013 was farmed by physically medium-sized farms, this share peaking at close to two thirds (66.2 %) of the total area in the Netherlands. Physically small farms accounted for the highest share of the total utilised agricultural area in Greece, Cyprus and Poland, and their share rose to more than half of the total agricultural area in Malta (52.3 %) and Slovenia (64.5 %).
Data sources and availability
Surveys and legislation
A basic farm structure survey (FSS) is carried out by all EU Member States. It has a common methodology and takes place at regular intervals, providing comparable and representative statistics across countries and time, as well as at a regional level (down to NUTS level 3). A comprehensive farm structure survey is carried out every 10 years — this full scope survey being an agricultural census, the last of which was held in 2010 — and intermediate sample surveys are carried out three times between these comprehensive surveys.
The legal basis for the FSS is Regulation (EU) No 1166/2008 of 19 November 2008. EU Member States collect information from individual agricultural holdings (farms) and, observing strict rules of confidentiality, data are forwarded to Eurostat. The basic information collected in the FSS covers: land use, livestock numbers, rural development, management and farm labour input (including the age, sex and relationship to the holder). The survey data can be aggregated to different geographic levels (countries, regions, and for comprehensive surveys also districts) and arranged by size class, area status, legal status of the holding, objective zone and farm type.
The unit underlying the FSS is the agricultural holding (referred to in this article as a farm), a technical-economic unit under single management engaged in agricultural production. Until 2007, the FSS covered all agricultural holdings with a utilised agricultural area (UAA) of at least one hectare (ha) and those holdings with a UAA of less than one hectare if their market production exceeded certain natural thresholds. Under the new legislation, the minimum threshold for agricultural holdings changed from one to five hectares. This new five hectare threshold was adopted in the Czech Republic, Germany and the United Kingdom. In Luxembourg, the threshold was changed to three hectares, in Sweden to two hectares, and in the Netherlands the threshold was changed to a minimum of EUR 3 000 of standard output.
The new legislation also changed the coverage of the FSS to 98 % of the UAA (excluding common land) and 98 % of the livestock on farms. Common land (land shared by several holdings) is not (always) included in the UAA in the case of Germany, where the common land belonging to alpine pasture cooperatives in Bavaria is excluded. In all other countries, common land either does not exist or has been included in the survey.
Key definitions
The utilised agricultural area (UAA) is a measure (in hectares) of the area used for farming. It includes the land categories: arable land; permanent grassland; permanent crops; kitchen gardens. It does not cover unused agricultural land, woodland and land occupied by buildings, farmyards, tracks, ponds, and so on.
The standard output of an agricultural product (crop or livestock) is the average value of agricultural output at farm-gate prices, in euro per hectare or per head of livestock; this concept excludes direct payments (a type of subsidy).
The farm labour force is made up of all individuals who have completed their compulsory education (having reached school-leaving age or duration) and who carried out work on farms during the 12 months up to the survey date. The figures include farm holders, even when not working on the farm, whereas their spouses are counted only if they carry out work on the farm. The holder is the natural person (sole holder or group of individuals) or the legal person (for example, a cooperative or other institution) on whose account and in whose name the farm is operated and who is responsible in legal and economic terms for the farm — in other words, the entity or person that takes the economic risks of the farm; for group holdings, only the main holder (one person) is counted. The regular farm labour force covers the family labour force (sole holders and other family members) and permanently employed (regular) non-family workers. One annual work unit (AWU) corresponds to the work performed by one person who is occupied on an agricultural holding on a full-time basis. Full-time means the minimum hours required by the national provisions governing contracts of employment. If these provisions do not explicitly indicate the number of hours, then 1 800 hours are taken to be the minimum (225 working days of eight hours each).
A livestock unit (LSU), is a reference unit which facilitates the aggregation of livestock from various species and age, through the use of specific coefficients established initially on the basis of the nutritional or feed requirement of each type of animal (with a set of coefficients for 23 different categories of animal). The reference unit used for the calculation of livestock units (= 1 LSU) is one adult dairy cow. For example, a single LSU corresponds to 10 sheep or goats.
Size classes
There is no fixed definition as to what constitutes a ‘small’ or a ‘large’ farm. A range of different classifications are available and this information may be aggregated in order to analyse farms of different sizes. For the purpose of the analyses presented in this article the following categories have been used to differentiate farms by size.
By economic size based on standard output in euro:
- Very small farms: < EUR 2 000
- Small farms: EUR 2 000 – < EUR 8 000
- Medium-sized farms: EUR 8 000 – < EUR 25 000
- Large farms: EUR 25 000 – < EUR 100 000
- Very large farms: ≥ EUR 100 000
By economic size based on standard output in euro, grouped into quintiles:
In order to compare the relative weight of the agricultural holdings in each country, farms were sorted from smallest to largest by their economic size and then divided into five groups (quintiles):
- the smallest farms, defined as those with the lowest levels of economic output who together cumulatively account for 20 % of the total standard output;
- the largest farms, defined as those with the highest levels of economic output who together cumulatively account for 20 % of the total standard output.
With this approach, the definition of ‘small’ or ‘large’ farms depends not on a uniform threshold (for the EU as a whole), but reflects the distribution in each of the EU Member States. In doing so, the size of the farms may be presented relative to their standard output in each Member State.
By physical size based on utilised agricultural area in hectares:
- Very small farms: < 2 hectares;
- Small farms: 2 hectares – < 20 hectares;
- Medium-sized farms: 20 hectares – < 100 hectares;
- Large farms: ≥ 100 hectares
Context
Rural development policy aims to improve: competitiveness in agriculture and forestry; the quality of the environment and countryside; life in rural areas; and the diversification of rural economies. As agriculture has modernised and the importance of industry and more recently services within the economy has increased, so agriculture has become much less important as a provider of jobs. Consequently, increasing emphasis has been placed by policymakers within the EU on the role farmers can play in rural development, including forestry, biodiversity, the diversification of the rural economy to create alternative jobs, and environmental protection in rural areas.
The common agricultural policy (CAP) has been frequently reformed in an attempt to modernise the agricultural sector and make it more market-oriented. After almost two years of negotiations between the European Commission, the European Parliament and the Council, a political agreement on the reform of the CAP was reached on 26 June 2013. This was designed to lead to far-reaching changes: making direct payments fairer and greener, strengthening the position of farmers within the food production chain, and making the CAP more efficient and more transparent, while providing a response to the challenges of food safety, climate change, growth and jobs in rural areas, thereby helping the EU to achieve its Europe 2020 objectives of promoting smart, sustainable and inclusive growth. In December 2013, the latest reform of the CAP was formally adopted by the European Parliament and the Council. The farm structure survey continues to be adapted with the aim of trying to provide timely and relevant data to help analyse and follow these policy developments.
The general pattern of development within the agricultural sector of the EU has been towards a greater concentration of agriculture within the hands of relatively few large (often corporately-owned) farms. The number of farms is in steady decline, and when people migrate away from sparsely populated agricultural areas, the farming land which remains is often acquired by larger farms. Thus, over time, land use and agricultural production have become more concentrated. Indeed, there is an interesting dichotomy between small family-run, labour-intensive, diversified farms and larger corporate farms which tend to be relatively specialised and rely on capital investment in machinery to benefit from economies of scale. To reverse these trends, some EU Member States support smaller farms, for example, through: land consolidation schemes; regulations on land sales/prices; taxation changes to favour small or family-owned farms (for example, in relation to property or inheritance tax); measures which facilitate access to credit for small farms.
See also
Further Eurostat information
Data visualisation
Publications
Main tables
- Agriculture) (t_agri), see:
- Farm structure (t_ef)
Database
- Agriculture (agri), see:
- Farm structure (ef)
- Farm structure – 2008 legislation (from 2005 onwards) (ef_main)
Dedicated section
Methodology / Metadata
- Agriculture, see:
- Farm structure (ESMS metadata file — ef_esms)
- Farm structure — national metadata (ESMS metadata file — ef_esqrs)
- Farm structure survey — thresholds (background article)
Source data for tables, figures and maps (MS Excel)
Other information
- Regulation (EC) No 1166/2008 of the European Parliament and of the Council of 19 November 2008 on farm structure surveys and the survey on agricultural production methods.
- Commission Regulation (EC) No 1242/2008 of 8 December 2008 establishing a Community typology for agricultural holdings.
- Regulation (EU) No 378/2014 of the European Parliament and of the Council of 3 April 2014 amending Regulation (EC) No 1166/2008 as regards the financial framework for the period 2014–2018.
- Commission Regulation (EU) No 715/2014 of 26 June 2014 amending Annex III to Regulation (EC) No 1166/2008 of the European Parliament and of the Council on farm structure surveys and the survey on agricultural production methods, as regards the list of characteristics to be collected in the farm structure survey 2016.
External links
- European Commission — Rural Development Policy, 2014–2020
- European Commission — the Common Agricultural Policy after 2013