Archive:Human resources in science and technology - flows
- Data extracted in December 2015. Most recent data: Further Eurostat information, Main tables and Database.
In this article, we consider statistics in the field of human resources in science and technology (HRST), which provide insights into the demand for people with strong qualifications in science and technology and the supply of such people. We look at the current and future supply of highly-skilled graduates of universities and other specialist educational institutions in the HRST field, in the European Union (EU), the candidate countries and the EFTA countries.
Investment in research, development, education and skills is a key EU policy area. Such investment is essential to boost economic growth and develop a knowledge-based economy. Consequently, interest is growing in the role skills play, and in measuring them. In this context, it is important to measure and analyse the most highly-skilled section of the labour force, both within the EU and internationally.
Statistics on human resources in science and technology (HRST) focus on two main aspects:
- stocks - the characteristics of the labour force currently working in the field of science and technology; there is a particular focus on scientists and engineers, often the innovators at the centre of technology-led development;
- flows - showing job-to-job mobility and the inflow from education into the science and technology labour force.
This article focuses on flows data in the HRST field.

Source: Eurostat (hrst_fl_tepart)

Source: Eurostat (hrst_fl_mobage)

Source: Eurostat (hrst_fl_mobsect2)
Main statistical findings
Educational inflows
Educational inflows provide a way to assess how many people will join the HRST population. Indeed, one criterion for inclusion in the HRST population is the level of education attained. Undergraduates, graduates, postgraduates and post-doctoral students are counted as part of the HRST population.
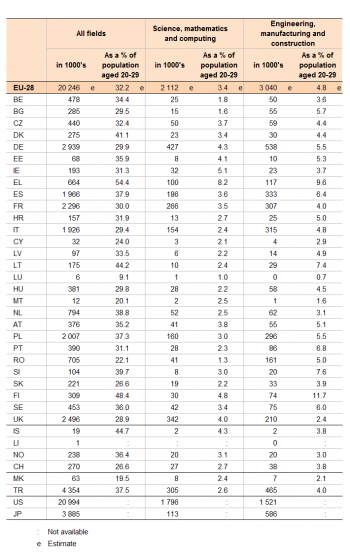
In 2012, there were an estimated 20 million people in higher education in the 28 EU countries. More than five million – 25% of all those in tertiary education - were studying sciences or engineering (S&E). The proportion exceeded 30% of the total in Germany, Greece and Finland.
In 2012, nearly one third (32.2%) of the population of the 28 EU countries aged between 20 and 29 was enrolled in tertiary education. Although the percentage varied, it was above 20% in all the Member States except Luxembourg, where it was just 9.1%. Greece had the highest proportion of tertiary education students among 20-29-year-olds (54.4%), followed closely by Finland, with 48.4% and Lithuania, with 44.2% (see Table 1).
Between 2007 and 2012, the numbers of students in tertiary education rose by an estimated annual average of 1.3% in the EU as a whole, while the numbers in science and engineering rose by 2%. Only a few countries (Estonia, Hungary, Slovenia and Latvia) reported a fall in the number of students at tertiary level, although the numbers in science and engineering actually increased. In Italy, Lithuania, Poland and Romania, both total tertiary-level student numbers and the numbers of science and engineering students rose.
Another way to analyse the future HRST population is to look at graduations. It is estimated that nearly five million tertiary graduations were obtained in 2012 in the EU, representing 7.7% of the 20-29 age group. In all countries, the majority of graduations were accomplished in the first stage of tertiary education. Numbers rose between 2011 and 2012 almost everywhere except Germany, Italy, Latvia, Lithuania, Luxembourg, Poland, Romania, Slovakia and Sweden.
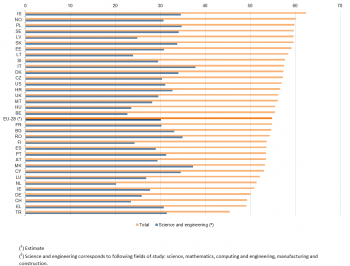
Across the EU, women's share in higher education reached an estimated 54.9% in 2012, and they accounted for an estimated 30.1% of science and engineering tertiary educated students. They were in the majority in all countries except Turkey, Greece and Switzerland. In science and engineering field, at least one student in four was female, except in the Netherlands, Belgium, Switzerland, Hungary, Lithuania, Finland and Latvia. The smallest gap between the figures for higher education generally and the field of science and engineering was recorded by Turkey (14 percentage points), while Latvia reported the widest gap (35 percentage points) (see Figure 1).
Job-to-job mobility
This means changing jobs from one year to the next. It does not include inflows into the labour market of people who were previously unemployed or inactive.
At country level, less than 10% of the employed HRST changed employer in 2013. Norway, the UK and Denmark had the highest mobility rates (about 9% of the 25-64 aged HRST population), while less than 2.5% of this population moved jobs in Slovakia and Romania.
As regards age distribution in the mobile population, in 2013 the youngest HRST (25-34-year-olds) were the most frequently represented category everywhere but Denmark, where the age group distribution was even (see Figure 2).
As regards the issue of gender parity, job-to-job mobility was higher for men than for women in most countries in 2013. For example, seven out of every ten people who changed jobs in Turkey in 2013 were men. However, the position was reversed in nine countries, and the mobile population was almost 60% female in Slovenia and Cyprus.
In 2013, there was less mobility in the knowledge-intensive service sector (KIS) than in NACE activities as a whole. Only Finland recorded higher mobility in knowledge-intensive services (see Figure 3). The difference exceeded one percentage point in Latvia, Cyprus, Turkey, Lithuania and Iceland. The UK experienced the highest mobility rate among all the countries in the knowledge-intensive service sector, at nearly 9%. Conversely, Slovakia and Greece recorded the lowest rate, at exactly 2%.
Data sources and availability
The data on human resources in science and technology flows showing job-to-job mobility come from the EU Labour force survey. The data on education inflows are from the joint UNESCO/OECD/Eurostat education survey. Both surveys are carried out by the national statistical institutes, and the results are sent to Eurostat.
The education inflow data give a good measure of the current and future supply of HRST by education (HRSTE). The annual data on inflows can be divided into two groups, each with a specific focus: annual data on actual inflows (‘graduation’; i.e. students completing a university-level course of study) and annual data on potential inflows (‘participation’; i.e. students in higher education) from the education system into HRST stocks.
Flow statistics are broken down by sex, age, region, sector of economic activity, occupation, educational level, fields of education, nationality and country of birth. Not all combinations can be produced.
Definitions
Eurostat uses standardised concepts, methods and definitions to produce HRST statistics. It draws on the Manual on the Measurement of Human Resources devoted to Science and Technology, the ‘Canberra Manual’, jointly written by the OECD, UNESCO, the International Labour Organisation, the European Commission’s Directorate-General for Research and Innovation, and Eurostat.
The Canberra Manual describes highly skilled human resources as essential for the development and flow of knowledge and as forming the crucial link between technological progress and economic growth, social development and environmental wellbeing. Countries and international organisations have highlighted the political and economic importance of internationally comparable, standardised and high-quality data on human resources.
The Manual defines human resources in science and technology as people who meet at least one of the following two conditions:
- the educational criterion - they have successfully completed a university-level education (HRSTE);
- the occupational criterion – they are employed in a science and technology occupation as ‘professionals’ or ‘technicians and associate professionals’ (HRSTO).
The group that meets both criteria is called the HRST core (HRSTC).
Even though the definition of HRST in the Canberra Manual refers to ‘S’ and ‘T’, it extends beyond science and technology in the narrow sense. HRSTE covers all fields of study, so anyone who has successfully completed tertiary education is part of the potential HRST stock.
Comparability of concepts and data
Since statistics on the number of people and the mobility of human resources in science and technology are all sourced from Eurostat’s Labour Force Survey, they can be compared and combined with each other and with high-tech statistics on employment in high-tech sectors and knowledge-intensive activities. Nevertheless, users should pay close attention to concepts and definitions when comparing or combining HRST statistics with those from other fields and/or sources.
For example, ‘total HRST’ cannot be compared with total employment, as total HRST also covers unemployed and economically inactive people qualified for and/or with experience in working in science and technology. If comparisons need to be made, either ‘HRST in terms of occupation’ or ‘HRSTC’ subgroups, or a HRST table that explicitly contains only employed science and technology personnel, could be used.
Comparisons between HRST numbers, mobility statistics and statistics on HRST education inflow must be drawn with caution, as the sources of these statistics apply different methodologies. For example, a HRST table showing the field of education cannot be compared with one showing employed HRST, because only ‘HRST in terms of education’ covers the education dimension (not all employed HRST are educated to university level).
Context
Europe 2020
The Europe 2020 strategy sets out a vision of Europe’s social market economy for the 21st century. It aims to make the EU a smart, sustainable and inclusive economy with high levels of employment, productivity and social cohesion. Innovation as a driver of economic progress is a key element. Europe 2020 advocates three mutually reinforcing priorities:
- smart growth - developing an economy based on knowledge and innovation;
- sustainable growth - promoting a more resource-efficient, greener and more competitive economy;
- inclusive growth - fostering a high-employment economy that provides social and geographical cohesion.
Innovation Union
The European Commission is further boosting the Europe 2020 strategy through seven flagship initiatives. One of these is the ‘Innovation Union’, supporting ‘smart growth’. The Innovation Union initiative seeks to improve the framework for research and innovation in the EU as well as access to finance. The aim is to ensure that innovative ideas can be turned into products and services that create growth and jobs.
A key element of the Innovation Union involves completing the European Research Area (ERA), which is designed to make European research institutions more competitive by bringing them together and encouraging a more inclusive way of working. More mobility for knowledge workers and deeper cooperation among EU research institutions are central ERA goals.
The European Research Area should inspire the most talented people to embark on research careers in Europe and encourage industry to invest more in European research. It will enable European researchers to develop strong links with partners around the world. In this way, Europe will benefit from the advancement of knowledge worldwide, contribute to global development and take a leading role in international initiatives to solve problems that affect us all.
See also
Further Eurostat information
Publications
- Science, technology and innovation in Europe- Pocketbook, 2013 edition
Main tables
- Science and technology, see:
- Human Resources in Science & Technology (t_hrst)
- Human resources in science and technology (HRST) (tsc00025)
- Doctorate students in science and technology fields (tsc00028)
- Human resources in science and technology (HRST) by NUTS 2 regions (tgs00038)
Database
- Science and technology, see:
- Human Resources in Science & Technology (hrst)
- Stocks of HRST at the national and regional levels (hrst_st)
- Flows of HRST at the national level (hrst_fl)
Methodology / Metadata
- Human Resources in Science & Technology (ESMS metadata file — hrst_esms)
Dedicated section
Source data for tables, figures and maps (MS Excel)
Other information
- Commission Implementing Regulation (EU) No 995/2012 of 26 October 2012 laying down detailed rules for the implementation of Decision No 1608/2003/EC of the European Parliament and of the Council concerning the production and development of Community statistics on science and technology (Legal text)
- Decision 1608/2003/EC concerning the production and development of Community statistics on science and technology (Legal text)
External links
- European Commission - Europe 2020
- European Commission - Research - ERA
- Innovation Union Competitiveness Report 2011
[[Category:<Subtheme category name(s)>|Name of the statistical article]] [[Category:<Statistical article>|Name of the statistical article]]
