Archive:Waste generation and landfilling indicators
Data extracted in April 2015. Most recent data: Further Eurostat information, Main tables and Database. This article has been discontinued and replaced by Waste management indicators This article analyses in detail the European Union (EU) sustainable development indicator generation of waste excluding major mineral wastes and the Europe 2020 indicator landfilling of waste excluding major mineral wastes. According to the principles of EU waste policies, the disposal of waste should be the last option in waste management. Priority should be given to prevention, reuse, recycling and other forms of recovery.
The sustainable development indicator ‘generation of waste excluding major mineral wastes’ is defined as all waste generated in a country per inhabitant per year, excluding major mineral wastes. The indicator enables the monitoring of waste generation over time for the EU as a whole, and makes it possible to compare developments across countries.
Treatment patterns for waste excluding major mineral wastes are not yet official sustainable development indicators. Nevertheless, these patterns are quite informative as they enable a comparison across countries of the development of waste management.


Main statistical findings
Indicator of waste generation excluding major mineral wastes
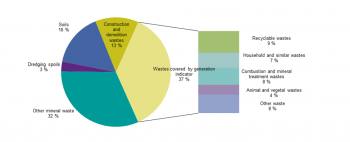
In 2012, total waste generation in the EU-28 amounted to 2.5 billion tonnes, an average of 4 984 kg per EU inhabitant. Of this total, 922 million tonnes are covered by the indicator ‘generation of waste excluding major mineral wastes’, corresponding to 1 828 kg/inhabitant and to 37 % of total waste generated (see Figure 1). The following categories of waste are not covered by the indicator:
- ‘other mineral wastes’ (categories 12.2, 12.3, 12.5 of the European Waste Catalogue for Statistics ([1]) — 801 million tonnes (which originate mainly from mining activities);
- excavated ‘soil’ (12.6) — 398 million tonnes;
- ‘mineral construction and demolition waste’ (12.1) — 321 million tonnes; and
- ‘dredging spoils’ (12.7) — 73 million tonnes.
(See Table 1 for classification of waste categories.)
The main categories of waste covered by the waste generation indicator are:
- ‘recyclables’ (06-07.6) — 242 million tonnes;
- ‘household and similar wastes’ (10.1) — 170 million tonnes;
- ‘combustion wastes and mineral treatment wastes’ (12.4, 12.8, 13) — 192 million tonnes;
- ‘animal and vegetal wastes’ (09) — 110 million tonnes; and
- ‘other waste’ — 208 million tonnes.
(See Figure 1 and Table 2.)
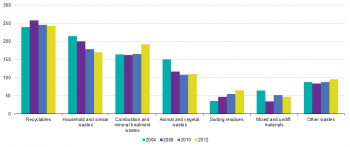
Table 2 shows in detail the development of waste generation for the EU-28 in the period 2004-2012 (no data available for 2006). The figures indicate that waste generation excluding major mineral wastes has generally remained stable over this period, ranging from 1 940 kg/inhabitant in 2004 to 1 770 kg/inhabitant in 2010. While the indicator basically remained stable, changes have occurred for the waste categories (see Table 2 and Figure 2). The generation of ‘household and similar wastes’ (10.1), which mainly consists of mixed municipal waste, bulky waste and street–cleaning residues, shows a clear and steady downwards trend since 2004. This development can be observed in most Member States and is assumed to result from the extension of separate waste collection systems for recyclable wastes, such as packaging waste, waste electronic equipment and other recyclables.
The decrease in ‘household and similar waste’ corresponds to the steady and significant increase in ‘sorting residues’ (10.3). This arises from the enhanced separate collection of recyclables, related sorting and composting activities, and the increasing pre-treatment of waste (e.g. by mechanical-biological treatment).
The amounts of ‘recyclables’ (06 – 07.6) generated reflect the volume of metal, glass, paper, plastic, rubber, wood and textile wastes that are separately collected or that are separated from mixed waste by treatment processes. Although one would expect a continuous growth in recyclables as a result of increased separate collection and sorting in Member States, the figures do not show any clear trend (Figure 2). A more in-depth analysis of the data shows that developments vary depending on the origin of the waste. While the amount of ‘recyclables’ in the household sector has constantly increased since 2006, recyclable waste in manufacturing industries has decreased since 2008. The latter development mainly results from lower amounts of wood, paper and metal waste reported by manufacturing sectors. These decreases are assumed to be a combined effect of real developments and the exclusion of by-products from waste statistics.
The strong and steady decrease in ‘animal and vegetal wastes’ (09) since 2004, and more particularly between 2004 and 2006, (from 238 kg to 191 kg per capita) can to a large extent be attributed to methodological adaptations by countries in the first years of data collection. Such adaptations mainly concern the exclusion of manure and slurry and vegetal by-products from waste statistics. Between 2008 and 2012, figures remained more or less stable.
The amount of ‘mixed and undifferentiated wastes’ (10.2) significantly decreased up to 2008, which was the result of an improved and more specific classification of generated wastes to waste categories. The increase in 2010 was an impact of the revision of the Waste Statistics Regulation, which broadened the definition of ‘mixed and undifferentiated wastes’ leading to higher amounts for this waste category. In 2012, a downward trend began again, indicating an improved classification of generated wastes to waste categories by Member States.
Waste generation by waste category in kg/inhabitant
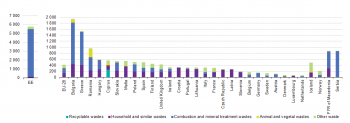
Figure 3 shows the waste generation indicator in kg per inhabitant for 2012 for each country and the EU-28 as a whole, broken down into main waste categories. The indicator values for 2012 range from 620 kg per inhabitant in Croatia to 8 586 kg per inhabitant in Estonia. The differences in the amounts and waste categories generated reflect structural differences between countries.
The high amount of waste in Estonia is mainly due to large quantities of ‘combustion and mineral treatment wastes’ (12.4) from the energy sector (5 748 kg/inhabitant) and chemical wastes (01.4, 02, 03.1) from the refinery sector (1 148 kg/inhabitant). Both waste types originate from the refining and incineration of oil shale, which is the main energy source in Estonia. The significant impact on waste generation from energy sources used is also visible in other countries where energy consumption relies to a high degree on solid fuels (coal, lignite, peat). This is most prominent in Bulgaria, Greece, Poland, Serbia, the former Yugoslav Republic of Macedonia and Bosnia and Herzegovina, which all have a particularly high consumption of coal and lignite compared with other Member States (see energy statistics).
In Finland, it is ‘wood waste’ (07.5) originating from wood processing, the manufacture of pulp and paper and forestry that leads to a waste generation clearly above the EU average. This is reflected in the high proportion of the waste category ‘recyclable wastes’ compared with other countries.
Considerable amounts of ‘animal and vegetal wastes’ (09) are reported by Romania and the Netherlands. In the Netherlands, nearly half of ‘animal and vegetal wastes’ originate from the food industry while in Romania, nearly all ‘animal and vegetal wastes’ come from agriculture and forestry; the high amounts were determined by a model-based estimation and may be overestimated.
‘Household and similar waste’ generation amounts to 336 kg per capita in the EU-28 and varies from 192 kg/inhabitant in Cyprus to 597 kg/inhabitant in Ireland, mainly depending on the established waste collection system and national consumption patterns.
Indicator of landfilling of waste excluding major mineral wastes
In Figure 4, the 974 million tonnes of waste that were landfilled in 2012 are broken down into waste categories; the separate column details the waste categories that are covered by the landfill indicator. In 2012, the landfill indicator covered 210 million tonnes or 21.6 % of the total waste landfilled. The indicator does not cover:
- ‘other mineral wastes’ (12.2, 12.3, 12.5) — 606 million tonnes;
- excavated ‘soils’ (12.6) — 113 million tonnes;
- ‘mineral construction and demolition waste’ (12.1) — 41 million tonnes; and
- ‘dredging spoils’ (12.7) — 3.6 million tonnes.
The most significant waste categories represented by the indicator are:
- ‘combustion wastes’ (12.4) — 83 million tonnes;
- ‘household and similar wastes’ (10.1) — 68 million tonnes;
- ‘animal and vegetal wastes’ (09.1, 09.2, 09.3) — 7 million tonnes; and
- ‘recyclable wastes’ — 2.7 million tonnes.
Waste landfilled by waste category in kg/inhabitant
Figure 5 shows the landfill indicator in kg/inhabitant for each country, broken down by main waste category. The detailed data underlying the graph are shown in Table 4.
In 2012, an average of 416 kg/inhabitant of waste (excluding major mineral wastes) was landfilled in the EU-28. This included 136 kg/inhabitant of ‘household and similar waste’ (10.1), 165 kg/inhabitant of ‘combustion wastes’ (12.4), 14 kg/inhabitant of ’animal and vegetal wastes’ (09) and 4 kg/inhabitant of ‘recyclable wastes’.
The amount of waste landfilled per country varied from 70 kg per inhabitant in the Netherlands to 5 774 kg per inhabitant in Estonia. The composition of landfilled waste shows that the impact of the energy sources used is even stronger for the landfill indicator than for the waste generation indicator. The landfill indicator is dominated by ‘combustion wastes’ (12.4) in Estonia, Bulgaria, Greece, Serbia and the former Yugoslav Republic of Macedonia. In these countries, basically all generated combustion waste was landfilled, representing more than 568 kg per capita in the former Yugoslav Republic of Macedonia and up to 5 366 kg per capita in Estonia (Table 4).
The amount of ‘household and similar wastes’ (10.1) reflects where countries are with their waste management systems and policies for the diversion of waste from landfills. Low amounts of landfilled ‘household and similar wastes’ are reported by countries that have established strict rules such as landfill bans for untreated or combustible waste. This is best illustrated by Germany, Austria, Sweden, Belgium, and the Netherlands, which all reported amounts of ‘household and similar wastes’ landfilled of less than 15 kg/inhabitant for 2012.
Table 3 and Figure 6 combine the two indicators on generation and landfilling. Figure 6 shows the landfill rate, i.e. the ratio between landfilled waste and generated waste, for each country. The landfill rate expresses how much of generated waste ends up in landfills and is thus a good indicator of progress or failure with regard to the diversion of waste from landfills.
At the level of the EU-28, 23 % of generated wastes (excluding major mineral wastes) were finally disposed of in landfills. In six countries, less than 8 % of generated wastes were landfilled in 2012. At the other end of the scale, there are seven Member States where more than 50 % of waste generated was landfilled.
Data sources and availability
Data on waste generation and treatment are available for five reference years: 2004, 2006, 2008, 2010 and 2012. Data are missing for the EU-28 aggregate for 2006 but should soon become available.
Both indicators are based on the same concept: they exclude from their coverage some significant waste flows in terms of quantity (mineral wastes, dredging spoils and contaminated soils). The exclusion of these wastes reduces the coverage of the sustainable development indicators significantly. However, it enhances their sensitivity and comparability across countries as mineral waste is significant in some countries and economic activities, such as mining and construction. Both indicators are presented in kilograms per inhabitant. Table 1 shows the coverage of the waste streams.
Analyses are based not only on total waste excluding major mineral wastes generated and landfilled, but also on waste categories that make up the total waste excluding major mineral wastes. These categories are presented in Table 1. Total waste excluding major mineral wastes is divided into either five or seven waste categories, depending on the number of classes included so as to ensure readable graphs and figures. The differences between both classifications can be found in the ‘other waste’ category, which excludes or includes ‘sorting residues’ and ‘mixed undifferentiated materials’ for the five and seven waste categories, respectively (Table 1).
Within the framework of the Waste Statistics Regulation (EC) No 2150/2002, data are collected according to the statistical waste classification EWC-Stat (Version 4), which is defined in Annex III to the Regulation. A list of all waste categories that have to be reported pursuant to the Waste Statistics Regulation is given in Table 1. The list includes the descriptions or labels of the waste categories, the EWC-Stat codes and the codes under which the data for the categories can be downloaded from Eurobase. Table 1 also lists aggregates of waste categories for which the data can be downloaded from Eurobase. ’Waste excluding major mineral wastes’ used for the construction of both indicators presented in this article covers all waste types except the following waste categories:
- mineral construction and demolition waste (EWC-Stat 12.1);
- other mineral wastes (12.2, 12.3, 12.5);
- soils (12.6);
- dredging spoils (12.7).
Context
The EU’s approach to waste management is based on three principles: waste prevention, recycling and reuse, and improving final disposal and monitoring. Where possible, waste that cannot be recycled or reused should be safely incinerated with landfills only used as a last resort. Both these methods need close monitoring because of their potential for causing severe environmental damage.
To monitor the implementation of waste policy, in particular compliance with the principles of recovery and safe disposal, reliable statistics on the production and management of waste from businesses and private households are required.
Since reference year 2004 and every two years, Eurostat collects under the Waste Statistics Regulation comprehensive data on waste generation and treatment from EU Member States and European Economic Area countries. After the fifth report in June 2014, data are available for the period 2004-2012. The Waste Statistics Regulation data are increasingly used as a basis for indicators to monitor waste generation and management in the EU.
The sustainable development indicators are part of a set of indicators used to monitor the EU sustainable development strategy. This strategy and its seventh environment action programme — the General Union Environment Action Programme to 2020 ‘Living well, within the limits of our planet’ (Decision No 1386/2013/EU) — set the objectives, amongst others, of turning Europe into a resource-efficient, green, competitive, low-carbon economy. The intention of EU policy in this area is to further tackle the unsustainable and inefficient use of resources and to improve waste prevention and management. These issues were addressed in the evaluation of the thematic strategy on the prevention and recycling of waste (COM(2011) 13 final) and the final assessment of the Sixth Community Environment Action Programme (COM(2011) 531 final).
Further Eurostat information
Publications
- Environmental statistics and accounts in Europe, Chapter 3 Waste (2010)
- Energy, transport and environment indicators pocketbook (2014 edition)
- Generation and treatment of waste in Europe 2008 (SiF 44/2011)
- Generation and treatment of municipal waste (SiF 31/2011)
Main tables
- Waste statistics
Database
- Environment, see:
- Waste statistics
- Waste generation and treatment (env_wasgt)
Dedicated section
Methodology / Metadata
- Waste generation and treatment (ESMS metadata file — env_wasgt_esms)
Source data for tables and figures (MS Excel)
Other information
- Environmental Data Centre on Waste
- Regulation 2150/2002 of 25 November 2002 on waste statistics
- Thematic strategy on the prevention and recycling of waste
- Being wise with waste: the EU’s approach to waste management
External links
- European Commission - DG Environment - Waste in the EU
- European Environment Agency - Waste and material resources
<noprint>== See also ==
- All articles on waste statistics
- Monitoring sustainable development (online publication)
Notes
- ↑ Within the framework of the Waste Statistics Regulation (2002/2150/EC) data are collected according to the Statistical Waste Nomenclature EWC-Stat (Version 4) which is defined in Annex III to the Regulation. The figures in brackets relating to waste categories in the text give the EWC-Stat code of the respective waste category. A list of all waste categories that have to be reported pursuant to the Waste Statistics Regulation is given in Table 1 of this article