Archive:Urban Europe — statistics on cities, towns and suburbs — patterns of urban and city developments
Data extracted in February–April 2016
This Statistics Explained article has been archived on 3 December 2020.
Highlights
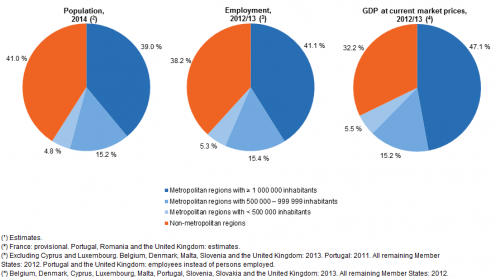
In 2014, metropolitan regions with at least one million inhabitants provided a home to 39 % of the EU population, provided employment to 41 % of the EU’s workforce and generated 47 % of its gross domestic product (GDP).
The average population density for the whole of the EU was 116.4 inhabitants per km² in 2011; however, less than half of the EU’s total area (44% or 1.95 million km²) was actually inhabited.
This chapter is part of an online publication that is based on Eurostat’s flagship publication Urban Europe — statistics on cities, towns and suburbs (which also exists as a PDF).
Definitions of territorial units
The various territorial units that are presented within Urban Europe — statistics on cities, towns and suburbs are described in more detail within the introduction. Readers are encouraged to read this carefully in order to help their understanding and interpretation of the data presented in the remainder of the publication.
Full article
Patterns of urban and city developments in the EU
Early man was a hunter-gatherer living off the land in small tribal societies, interacting closely with nature to ensure survival; as such, the development of towns and cities was a movement away from this earlier behaviour. However, it was only with the onset of the industrial revolution that the pace of population growth accelerated considerably and a pattern of increasing urbanisation was established. In much of Europe this principally took place during the 19th and the first half of the 20th centuries, by which time many European cities had reached close to their current size.
In 2008, a historic landmark was reached, as the United Nations declared that more than 50 % of the world’s population was living in urban areas. Much of the growth in urban populations since the middle of the last century may be attributed to the emergence of newly industrialised economies and associated megacities in China, India and other parts of Asia, as well as Latin America and sub-Saharan Africa.
The share of the urban population in the EU continues to rise
Although almost three quarters (72.5 %) of EU-28 inhabitants lived in cities, towns and suburbs in 2014, there are considerable differences in the size and spatial distribution of urban developments between European Union (EU) Member States. For example, the Netherlands is characterised by a high level of population density and a high share of urban land use, whereas in most of the Nordic Member States and the interior of the Iberian Peninsula much lower levels of urban land use are commonplace.
Each of the EU Member States has a distinctive history of territorial developments: for example, centrally-planned economies and the lack of a market for land/property resulted in compact urban developments across most eastern and Baltic Member States. Otherwise, in some other Member States, the post-war period was characterised by extensive (re-)building, with cities being planned as more dispersed, spatial units, sometimes resulting in urban sprawl or urban creep.
Overall, the increase in populations and the limited space available for urban developments has resulted in the divide between urban and rural areas becoming increasingly blurred. In many cities, people have tended to move out of inner cities to suburban and peri-urban areas (hybrid areas of fragmented urban and rural characteristics) on the outskirts of existing metropolitan regions. This shift has been encouraged, among others, by: increased motorisation rates; improvements to road networks and public transport links; aspirations for a better quality of life; and a desire to escape poverty and urban decay apparent in some inner city areas.
This chapter provides information on:
- the spatial distribution of densely populated regions across the EU Member States and patterns of urban development;
- the growth/decline of population and economic activity in the EU’s urban areas;
- population projections, which highlight that an increasing share of the EU-28 population is expected to inhabit predominantly urban regions by 2050.
Spatial distribution of urban developments
The spatial distribution of cities across the EU is linked to its geography and history. Most European cities are built on the sites of old settlements that were situated on the banks of rivers or coastlines. However, while some cities thrive, others decline: this may be explained, at least in part, by the attractiveness of cities as places to live, work or study. National policies and the actions of governments can also play a role in determining the fortunes of a city through key investment decisions which have the potential to increase a city’s attractiveness, or decisions to plan the creation of new towns, satellite towns or towns on reclaimed land.
The majority of EU-28 population lives in a relatively small area …
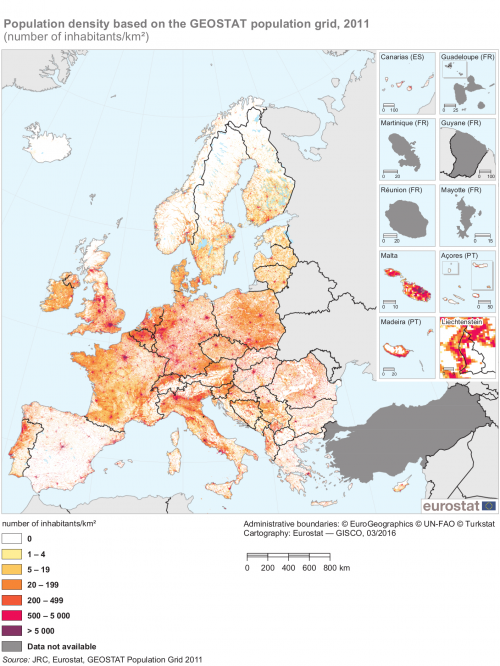
The GEOSTAT population grid provides statistical and geospatial information for each of the close to 4.5 million km² of area covered by the EU-28. The average population density for the whole of the EU-28 was 116.4 inhabitants per km²; however, less than half of the EU’s total area (44 % or 1.95 million km²) was actually inhabited.
Just 10 % of those grid cells that were inhabited were home to more than three quarters (77.2 %) of the EU-28 population; their average population density was almost 2 400 inhabitants per km², or 17.5 times higher than the EU-28 average. By contrast, some 11.9 % of the EU-28 population populated 80.9 % of the inhabited area; their population density was almost one fifth of the EU-28 average.

Source: Eurostat, GEOSTAT Population Grid 2011 (http://ec.europa.eu/eurostat/web/gisco/geodata/reference-data/population-distribution-demography)
… as thinly populated regions accounted for the majority of its territory
Map 1 provides an overview of population density in the EU-28 and shows that the most densely concentrated areas of urban development run from south-east England, through the Flanders region of Belgium, into the Netherlands and the German region of Nordrhein-Westfalen. This area is characterised not only by high levels of population density, but also by its transport infrastructure and location close to many of Europe’s largest markets, attracting many enterprises to locate in cities such as Antwerp, Köln, London or Rotterdam.
An intermediate level of population density exists across much of France, northern Italy, Germany, Denmark, Poland and the Czech Republic, with urban developments regularly spread across much of their territory. A somewhat different pattern was observed in the Iberian Peninsula, southern Italy, Greece, as well as many of the eastern and northern EU Member States as these areas were characterised by relatively few, sporadic urban developments. This was particularly true in Spain, where — other than the capital of Madrid — relatively large urban areas are predominantly located around the coastline, while interior regions are very sparsely populated.
Urban morphology in the EU
There are a range of different patterns of urban morphology evident across the EU Member States, with variations in the number, hierarchy and distribution of cities for any given territory; these differences reflect, at least to some degree, political and administrative structures. For example, Germany generally displays a polycentric pattern of urban development, with a relatively high number of medium-sized cities spread across its territory, perhaps reflecting the importance of its federal states; a similar pattern is evident in Italy and Poland. On the other hand, Paris and London are examples of monocentric urban developments, as each of these capitals accounts for a considerably higher share of national economic activity; further information on the dominance of capital cities is provided in Chapter 4.
The urban atlas is a joint initiative of the European Commission’s Directorate-General for Regional and Urban Policy and the Directorate-General for the Internal Market, Industry, Entrepreneurship and SMEs, with the support of the European Space Agency (ESA) and the European Environment Agency (EEA); it has been used as the source for Map 2 (and is also used for Map 2 in Chapter 6).
There are differences in patterns of urban development that arise from the sphere of influence that a city may/may not exert on its surrounding areas and other cities. For example, Berlin (Germany) displays a monocentric sphere of considerable influence over its surrounding region of Brandenburg, with considerably more people living in the city than its surrounding region. In contrast to Berlin, in the German region of Nordrhein-Westfalen there are several medium-sized and large cities such as Bonn, Dortmund, Duisburg, Düsseldorf, Essen and Köln, whose spheres of influence intersect and where the boundaries between one city and another become blurred.

Source: Copernicus Urban Atlas (http://land.copernicus.eu/local/urban-atlas/urban-atlas-2012/view/)
The growth/decline of urban populations and their economic activity
Metropolitan regions are approximations of functional urban areas composed of a city and its commuting zones, with at least 250 thousand inhabitants, as covered by one or more NUTS level 3 regions. An analysis by size reveals that the largest metropolitan regions — those with at least one million inhabitants — provided a home to 39.0 % of the EU-28 population in 2014 (see Figure 1); they also provided employment to 41.1 % of the EU’s workforce and generated 47.1 % of its gross domestic product (GDP).
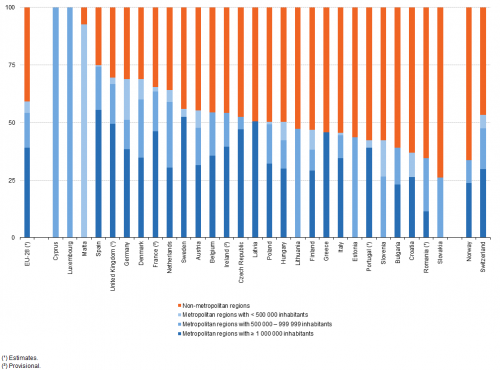
Figure 2 shows a similar analysis for population across the individual EU Member States: metropolitan regions with at least one million inhabitants provided a home to around half of the total number of inhabitants in Spain (55.5 %), Sweden (52.4 %), Latvia (50.5 %) and the United Kingdom (49.4 %).
Source: Eurostat (met_pjanaggr3), (met_10r_3emp), (met_10r_3gdp), (demo_pjan), (nama_10_pe) and (nama_10_gdp)
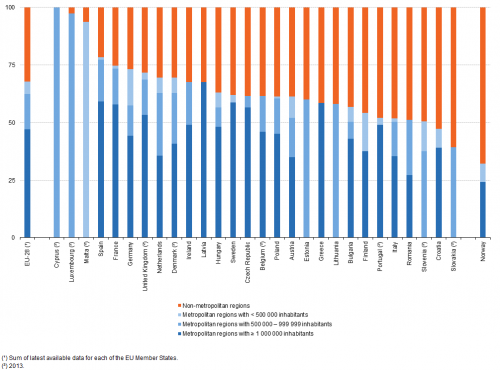
In Figure 3 the focus of the analysis is on economic activity, as measured by GDP. The economic contribution of metropolitan regions with at least one million inhabitants was greater than their share of the population in all 21 of the EU Member States which had at least one metropolitan region of this size. The economic importance of these large metropolitan regions was particularly high in Romania, Latvia, Hungary and Bulgaria. For example, metropolitan regions with at least one million inhabitants accounted for 42.8 % of Bulgarian GDP, while they provided a home to 23.2 % of the Bulgarian population.
(%)
Source: Eurostat (met_pjanaggr3) and (demo_pjan)
(%)
Source: Eurostat (met_pjanaggr3), (met_10r_3gdp) and (nama_10_gdp)
London and Paris are the only truly megacities in the EU
Table 2 presents summary information on the populations of the EU-28’s largest cities/urban areas as of 1 January 2014, with the ranking based on data for functional urban areas (cities and their commuting zones). Using this typology, there were only two megacities (with more than 10 million inhabitants) in the EU: London was the biggest with 12.5 million inhabitants, closely followed by Paris (11.8 million). In order to give some idea of the size of these cities, they both had more inhabitants than the total populations of Belgium, the Czech Republic or Portugal.
Based on this definition, Madrid (Spain) was the third largest functional urban area in the EU-28 with 6.5 million inhabitants, while the Ruhrgebiet and Berlin (both Germany) were the only other urban areas with more than 5.0 million inhabitants. As such, approximately 8 % of the EU-28 population was living in an urban area with more than 5.0 million inhabitants, which was considerably less than the corresponding share — approximately one quarter — in the United States. The fragmented distribution of cities in the EU may be largely explained by the relatively small population size of most EU Member States.
A comparison between the size of the functional urban area and that of the city provides one means of analysing patterns of urban development. In Katowice (Poland), Lisboa (Portugal), Manchester (the United Kingdom) and Paris, the functional urban area had at least five times as many inhabitants as the city centre, as defined by administrative boundaries.
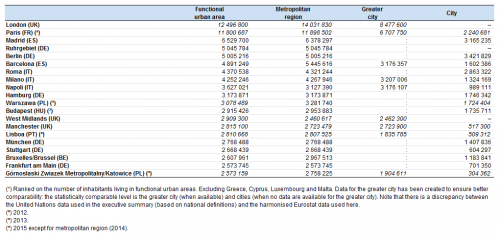
(inhabitants)
Source: Eurostat (urb_lpop1), (met_pjanaggr3) and (urb_cpop1)
Many predominantly urban regions in the EU are growing at a relatively fast pace
Although the overall rate of population growth in the EU-28 has been modest in recent years, there are cities and urban regions which continue to grow at a much faster pace. An analysis based on the urban–rural typology indicates that most predominantly urban regions exhibited population growth rates that were above their national averages, suggesting that the process of urbanisation was ongoing. Furthermore, population projections for the period through to 2050 indicate that this pattern is expected to continue during the next 35 years — see the end of this chapter for more details.
Between 1 January 2004 and 1 January 2014 the population living in predominantly urban regions of the EU-28 rose from 203.6 million to 215.7 million inhabitants, an overall increase of 6.0 %. The most rapid expansion in population numbers was recorded for those living in predominantly urban regions with at least one million inhabitants, where there was a 12.3 % increase in the number of inhabitants.
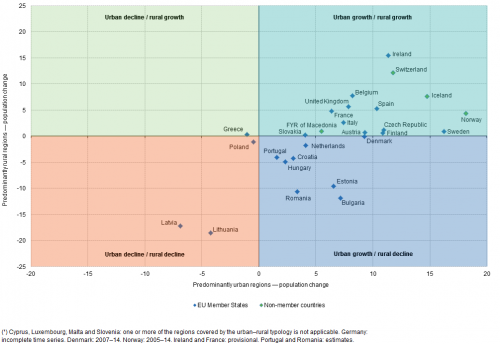
Figure 4 shows that there were only four EU Member States — Latvia, Lithuania, Greece and Poland —where the size of the population living in predominantly urban regions declined during the period 1 January 2004 to 1 January 2014; this may be explained, at least in part, by migratory patterns. In Latvia and Lithuania (and Poland to a lesser degree), the reduction in the number of inhabitants in predominantly urban regions was reproduced in rural regions too. On the other hand, there was a rapid rate of population growth in the predominantly urban regions of Sweden, Ireland, the Czech Republic, Finland and Spain; while high growth rates were also recorded in Norway, Iceland and Switzerland. The largest disparities between population growth rates for predominantly urban regions and predominantly rural regions and therefore the fastest transformations towards a more urbanised society were recorded in Bulgaria, Romania, the three Baltic Member States, Finland and Sweden.
A majority of the population growth in predominantly urban regions of Ireland, France, the Netherlands and the United Kingdom was attributed to natural population change
Looking at the two charts that are part of Figure 5, it is striking that the majority of the population change that took place in the EU Member States in 2013 could be attributed to predominantly urban regions, be this as a result of net migration or natural population change (the difference between births and deaths).
Ireland, France, the Netherlands and the United Kingdom each reported that their predominantly urban populations were expanding at a faster rate as a result of natural population change rather than net migration. However, it was more common to find higher crude rates of net migration in predominantly urban regions. This was particularly true in Italy, Hungary and Austria, where a relatively rapid inflow of migrants (people changing their residence from one country to another for a period of one year or more — including on a permanent basis) could be contrasted with a rate of natural population change that was close to zero. A different pattern was evident in Greece, Spain and Portugal — three economies that were particularly affected by the financial and economic crisis — where crude rates of net migration were negative, as the flow of emigrants leaving predominantly urban regions considerably outweighed the flow of immigrants.
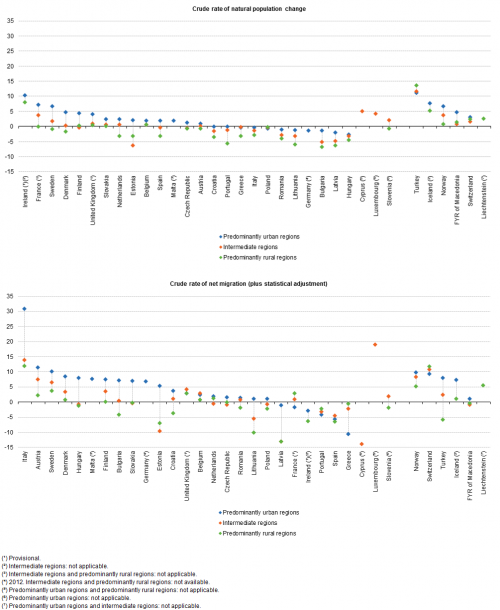
(per 1 000 inhabitants)
Source: Eurostat (urt_gind3)
The metropolitan region of London saw its population grow, on average, by 17 inhabitants an hour during the period 2004–14
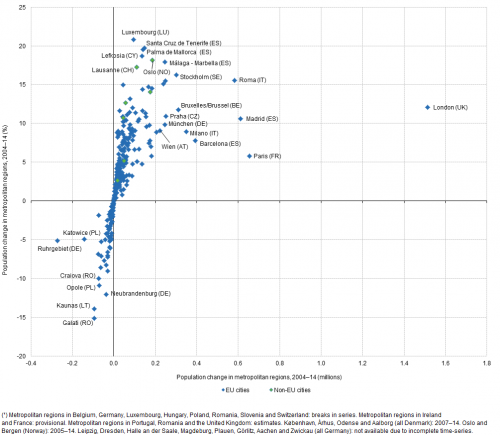
Having established that predominantly urban regions have a considerable influence on overall patterns of population change, Figure 6 provides a similar analysis for metropolitan regions. It shows, unsurprisingly, that the largest absolute changes in population numbers during the period from 1 January 2004 to 1 January 2014 were recorded for some of the EU’s biggest metropolitan regions, principally the capitals of London (which gained an additional 1.5 million inhabitants), Paris (655 thousand), Madrid (612 thousand) and Roma (581 thousand). It is interesting to note that the population of London has recently returned to levels above those witnessed at the onset of the World War II. Indeed, the dynamic rates of population growth in the metropolitan regions of London and Paris during the most recent decade mark a considerable change and are in contrast to slow or negative rates of change that continue to be witnessed many parts of Europe and North America.
The fastest expansion in population among the metropolitan regions of the EU-28 was recorded in Luxembourg, where the number of inhabitants rose by 20.8 % between 1 January 2004 and 1 January 2014. High growth rates were also registered in four Spanish metropolitan regions, all of which were popular holiday/retirement destinations, namely, Santa Cruz de Tenerife, Palma de Mallorca, Alicante - Elche, and Málaga - Marbella, as well as in the metropolitan regions of four more capitals, namely, Lefkosia (Cyprus), Stockholm (Sweden), Roma (Italy) and Dublin (Ireland).
Those metropolitan regions where population numbers declined were often characterised by a relatively narrow industrial base
There were a number of metropolitan regions that saw their populations decline during the period 1 January 2004 to 1 January 2014. In absolute terms, the biggest reductions were recorded in the coal and steel centres of the Ruhrgebiet in Germany (-271 thousand inhabitants) and Katowice in Poland (-143 thousand), while there were also relatively large declines in the industrial centres of Kaunas (Lithuania’s second city), Galați and Craiova (both Romania). Indeed, many of the metropolitan regions in the EU-28 which have seen their numbers of inhabitants reduced are characterised by a relatively narrow industrial base. Aside from those regions already mentioned, population numbers also fell, for example, in the former mining regions of Ostrava (the Czech Republic), Saarbrücken (Germany), Pécs (Hungary) and Heerlen (the Netherlands), the shipbuilding regions of Bremerhaven (Germany) and Sunderland (the United Kingdom), or the metalworking regions of Siegen (Germany), Miskolc (Hungary) and Opole (Poland).
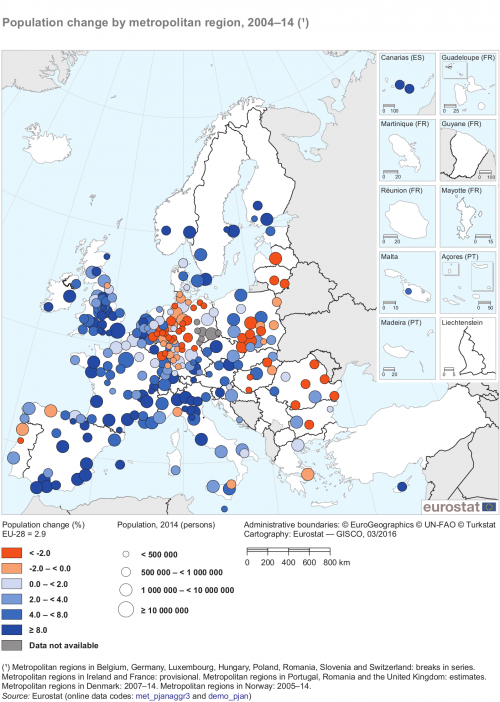
(%)
Source: Eurostat (met_pjanaggr3) and (demo_pjan)
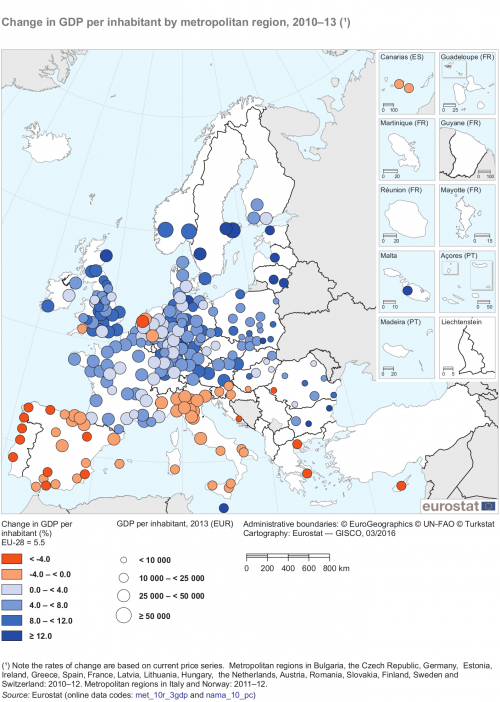
Figure 7 shows the development of GDP per inhabitant, in terms of absolute and relative changes for the period 2010–13; as a result of changes to the system of data collection for national and regional accounts, ESA 2010, a lengthy time series is not available at the time of drafting. The effects of the financial and economic crisis were clearly apparent insofar as GDP per inhabitant fell in each of the metropolitan regions of Greece (2010–12), Spain (2010–12), Croatia, Italy, Cyprus, Portugal and Slovenia; the only other metropolitan regions to record a reduction in their economic activity were the five Dutch regions of Amsterdam, Heerlen, Rotterdam, 's-Gravenhage and Utrecht (all 2010–12), Pécs (Hungary, 2010–12), Timişoara (Romania, 2010–12) and Exeter (the United Kingdom).
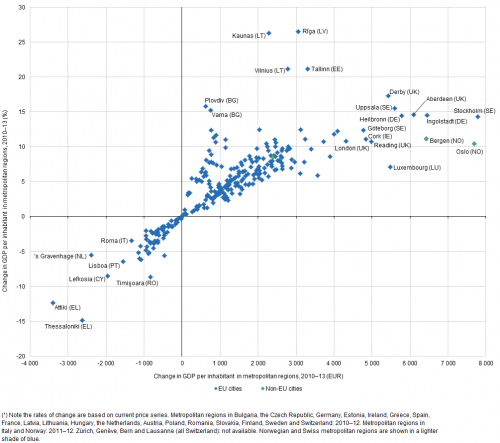
Source: Eurostat (met_10r_3gdp)
The fastest economic growth in recent years was often recorded in metropolitan regions with high-technology industries
The level of GDP per inhabitant increased in the vast majority of the metropolitan regions across the EU-28 between 2010 and 2013. The fastest growth rates were recorded in the Baltic Member States — in part reflecting a rebound from the financial and economic crisis — in the regions of Rīga (Latvia), Vilnius, Kaunas (both Lithuania) and Tallinn (Estonia). Otherwise, high growth rates were also registered by the Bulgarian regions of Plovdiv and Varna (financial services and real estate), the German region of Ingolstadt (headquarters of a major carmaker), the Swedish region of Uppsala (which specialises in medical research and biotechnology), and the British regions of Aberdeen (which had a vibrant offshore oil industry until the recent downturn in crude oil prices) and Derby (which is home, among others, to a couple of carmakers).
In absolute terms, the biggest increases in GDP per inhabitant were recorded in the metropolitan regions of Heilbronn and Ingolstadt (both Germany), Cork (Ireland), Luxembourg (Luxembourg), Stockholm, Göteborg and Uppsala (all Sweden), Aberdeen, Derby and Reading (all the United Kingdom); several of these regions may be characterised as engines of economic growth, in particular as leading producers of technological innovation.
(%)
Source: Eurostat (met_10r_3gdp) and (nama_10_pc)
Changing patterns of urban developments: satellite new towns or inner city (re-)development?
Urbanisation has historically been associated with a range of economic and social transformations, as urban areas can play a key role as drivers of regional economies: they act as hubs for jobs, business, higher education, innovation and entrepreneurship; they attract investment and offer employment opportunities. Some cities work closely with their surrounding areas (local authorities and administrations) to coordinate integrated solutions, for example transport networks, for mutual benefit and territorial cohesion.
Most European cities have a well-defined centre that is often rich in historical/cultural features, as well as retail outlets. In larger urban areas, it is often commonplace to find that other towns and cities are assimilated into the larger metropolitan region as part of the ongoing process of urbanisation. This pattern often began when urban planners pursued the development of suburban lifestyles and developed satellite new towns around large cities, in the hope that these would alleviate problems in inner city areas.
During the last 20 years there has been a change to patterns of urban development as the growth of new residential areas has slowed (in line with population changes) and become more concentrated in inner city areas, while industrial and commercial areas have become the main source of urban expansion. However, there are some exceptions, such as the Mediterranean coastline or suburban residential developments in eastern Member States around major cities. In many countries, urban planners are increasingly seeking to restrict the number of suburban and greenfield sites that are being used for developments — due to their potential adverse environmental impact — focusing attention instead on (re-)developing inner city areas.
The most rapid urban population growth was often located in capital cities and their surrounding commuter belts
This next section looks in more detail at the demographic and economic developments in the EU among predominantly urban regions; the typology is based on NUTS level 3 regions. Table 3 shows that the highest population growth rates among urban regions with at least one million inhabitants were recorded in three of the five regions that compose London, as well as the capital city regions of Bruxelles/Brussel (Belgium), Byen København (Denmark) and Stockholms län (Sweden), three coastal regions of Spain (Málaga, Alicante and Murcia), the Haute-Garonne region in France (including Toulouse), and Stredoceský kraj in the Czech Republic (a region which encircles the capital of Praha).
Although the evidence would suggest that some of the fastest expansions in population across the EU-28 are taking place in its largest (capital) cities, there may be a range of advantages to living in smaller cities; for example, shorter commuting times, lower house prices, closer proximity to nature, less crime and pollution. Many of these issues relating to satisfaction and the quality of life in cities are addressed in Chapter 13. Among some of the smaller predominantly urban regions (with less than one million inhabitants), the most rapid increases in population numbers were often registered in commuter zones, for example, Monza e della Brianza to the north-east of Milano in Italy, Wiener Umland/Nordteil to the north of the Austrian capital of Wien, Ilfov which surrounds the Romanian capital of Bucureşti, or Berkshire to the west of London.
Contrasting patterns — urban developments
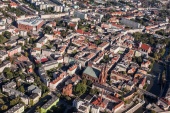
Urban developments can be constrained by topographical features (for example, the sea, mountains or lakes). With restricted space, it is common to find that urban developments such as these have tightly packed buildings and relatively high levels of population density. On the other hand, there is usually more space available for suburban developments, which are often characterised by detached housing, gardens and comparatively low levels of population density.
© paul prescott/Shutterstock.com; © Luciano Mortula/ Shutterstock.com; © Mariusz Szczygiel/Shutterstock.com;
© Marina J/Shutterstock.com
Aside from these, the highest population growth rates in predominantly urban regions were often recorded in the United Kingdom, across a variety of different regions: some were part of the London commuter belt (for example, Thurrock), some were located on the south coast (for example, Brighton and Hove), while others were characterised by their relatively large migrant populations (for example, Leicester).
It is also interesting to note the presence of the eastern German region of Dresden, Kreisfreie Stadt, where the population grew by 9.7 % between 1 January 2004 and 1 January 2014 — contrary to the general patterns observed across much of eastern Germany and also contrary to the overall low rates of natural population change across Germany. The expanding population in Dresden may be attributed, at least in part, to the establishment of public administration services, research institutes and high-technology sectors such as the semiconductor industry (so-called Silicon Saxony) and the pharmaceuticals sector.
Only four predominantly urban regions with at least one million inhabitants reported a decline in their population between 2004 and 2014
There were only four predominantly urban regions in the EU-28 with at least one million inhabitants where there was a decline in the level of population between 1 January 2004 and 1 January 2014. Each of these saw a modest reduction, as the number of inhabitants living in Grande Porto (Portugal), Hannover (Germany), and the Greek and Romanian capital city regions (Attiki and Bucureşti) reported changes in the range of -0.3 % to -3.4 %. While there was a contraction of 3.4 % in the Romanian capital, its surrounding region of Ilfov registered the highest population growth rate among any of the predominantly urban regions in the EU-28, with a 50.3 % increase in its number of inhabitants between 1 January 2004 and 1 January 2014, suggesting that many people left the inner city to move to the surrounding areas.
A decline in population numbers was more commonplace among those predominantly urban regions that were smaller in size and this pattern was particularly apparent in Germany and Poland, where there were several examples of urban populations contracting by 5–10 %. These declines may be linked, at least in part, to low levels of natural population change and regions specialised in declining industrial activities, but may also reflect breaks in series that result from post and pre-census data.
GDP per inhabitant grew at a rapid pace in several predominantly urban regions of Germany, Poland and the United Kingdom
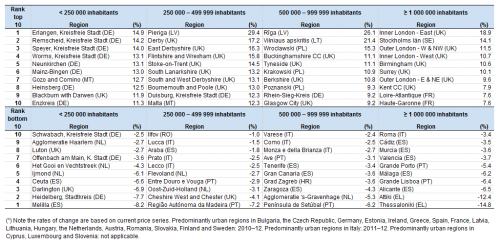
The highest growth rates for GDP per inhabitant between 2010 and 2013 were, unsurprisingly, often recorded in some of the predominantly urban regions with the highest population growth rates, confirming the dynamic nature of these regions. For example, four of the five regions that compose London, Stockholm (2010–12) and Haute-Garonne (2010–12) were all present among the 10 fastest growing urban economies with at least one million inhabitants.
Otherwise, economic activity grew at a relatively fast pace in several predominantly urban regions from the Baltic Member States (Pieriga, Rīga and Vilniaus apskritis, 2010–12) and Poland (Krakowski, Poznanski and Wroclawski), while the fastest growth rates across smaller urban regions were often concentrated in Germany and the United Kingdom, as well as the two Maltese regions. By contrast, the largest contractions in economic activity were generally recorded in southern Europe, with predominantly urban regions from Greece, Spain, Italy and Portugal accounting for a high number of those regions with the biggest declines in activity.

Source: Eurostat (demo_r_pjanaggr3)
Source: Eurostat (nama_10r_3gdp)
There was a wide disparity in standards of living between predominantly urban regions in the United Kingdom
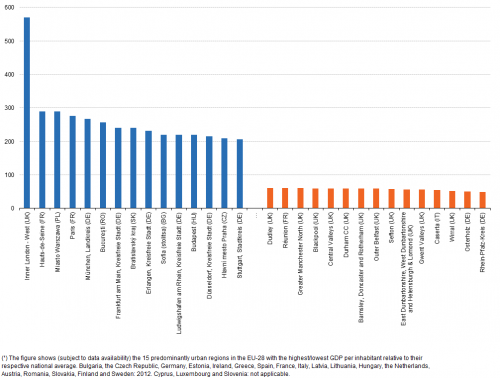
Figure 8 presents information on the relative level of GDP per inhabitant in predominantly urban regions; each value is expressed in relation to national GDP per inhabitant to give an idea of the similarities/disparities that may exist in terms of different standards of living in the same EU Member State; note that GDP per inhabitant can be influenced by commuter inflows which inflate the economic activity in a region, while commuters are likely to spend a fairly high proportion of their salaries back in the region where they live.
Inner London - West had by far the highest level of relative GDP per inhabitant in 2013, as the average wealth of each person living in this region was 5.7 times as high as the national average for the United Kingdom. The remainder of this ranking was dominated by other capital cities and their surrounding areas, including the Hauts-de-Seine (in the western suburbs of the French capital) and Paris itself, Miasto Warszawa (Poland), Bucureşti (Romania), Bratislavský kraj (Slovakia), Sofia (stolitsa) (Bulgaria), Budapest (Hungary) and Hlavní mesto Praha (the Czech Republic), underlying the monocentric nature of urban developments in France, the United Kingdom and many of the eastern EU Member States.
All of the remaining predominantly urban regions with high levels of GDP per inhabitant relative to their national average were from Germany, although they did not include the capital city of Berlin, they were: München, Landkreis; Frankfurt am Main, Kreisfreie Stadt; Erlangen, Kreisfreie Stadt; Ludwigshafen am Rhein, Kreisfreie Stadt; Düsseldorf, Kreisfreie Stadt; and Stuttgart, Stadtkreis.
At the other end of the ranking, many of the regions that had the lowest GDP per inhabitant compared with their national average were also located in the United Kingdom, reflecting, at least in part, the high level of GDP per inhabitant in Inner London - West pulling up the national average and creating a wider disparity between regions. Some of the lowest levels of GDP per inhabitant in the United Kingdom were recorded in (former) industrial regions, such as the Central Valleys and Gwent Valleys (of Wales), or the Wirral, Sefton, Greater Manchester North and Blackpool in the north-west of England.
(national average = 100)
Source: Eurostat (nama_10r_3gdp)
The fastest population growth in the last 50 years was recorded in several new town developments and on reclaimed land
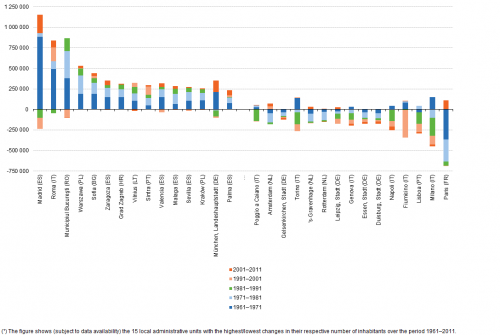
Figure 9 provides a more detailed analysis that is based on data for local administrative units (LAU) over the much lengthier period of 1961–2011; note that the coverage of units varies considerably between EU Member States and that while the labels used for some local administrative units are identical to those used for metropolitan regions/predominantly urban regions this does not necessarily mean that they cover the same areas.
On the basis of data available for local administrative units, the most rapid long-term population growth was often recorded in (parts of) capital cities. For example, Madrid, Roma, Municipiul Bucureşti, Warszawa and Sofia recorded the largest expansions in their population numbers; they were joined by several Spanish cities, including Zaragoza, Valencia, Malaga, Sevilla and Palma, the Croatian capital of Zagreb, Sintra to the west of Lisboa in Portugal, and the German city of München, Landeshauptstadt.
The biggest reduction in population numbers for a local administrative unit was recorded in the French capital of Paris (defined here as the 20 arrondissements contained within the confines of the Boulevard Périphérique), although this pattern was reversed towards the end of the period under consideration. The other administrative units that recorded relatively large contractions in their overall number of inhabitants between 1961 and 2011 were located in Germany, Italy or the Netherlands, along with the Portuguese capital of Lisboa.
Although not shown, the highest population growth rates between 1961 and 2011 were often recorded for administrative units associated with new town developments or reclaimed land — as their population at the start of the period under consideration was often close to zero. For example, the municipality of Zeewolde in the Netherlands was only founded in 1984 and was established on a reclaimed polder; it saw its population increase from just one person in 1961 to almost 21 thousand by 2011. Almere, also in the Netherlands, is an urban development whose population grew from 39 inhabitants in 1961 to 188 thousand by 2011. Similar new town developments exist across many of the EU Member States, for example, the seaside resort of La Grande-Motte in Languedoc-Roussillon region of southern France, whose population rose from 37 in 1961 to 23 thousand by 2011, or Emerson Valley and Furzton (both parts of Milton Keynes in the United Kingdom), whose joint populations rose from 202 inhabitants in 1961 to 27 thousand by 2011.
Population projections for 2015–50
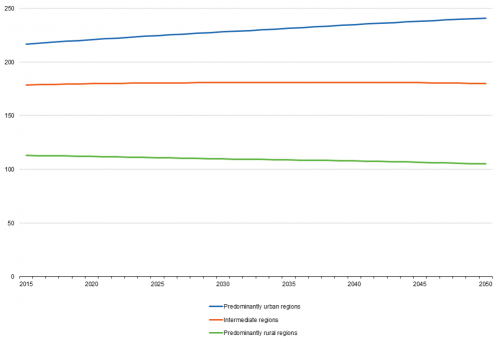
This final section provides information on population projections for the EU-28 during the period 2015–50. Figure 10 shows the population of predominantly rural regions is projected to fall by 7.9 million inhabitants during this period, to account for 20.0 % of the EU-28 population by 2050. Although the number of people living in intermediate regions is projected to rise by 1.1 million persons, their share of the overall number of inhabitants in the EU-28 is predicted to fall to 34.2 % by 2050. By contrast, the projections foresee the total number of people living in predominantly urban regions rising by 24.1 million persons, and that by 2050 these regions will provide a home to almost half (45.8 %) of the EU-28 population.
(million inhabitants)
Source: Eurostat (proj_13rpms3) and http://ec.europa.eu/eurostat/web/rural-development/methodology
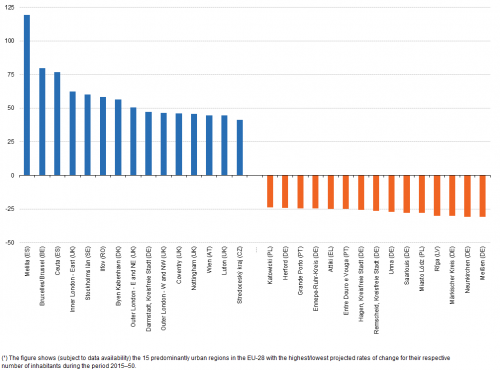
Eurostat’s population projections have been made for NUTS level 3 regions. Figure 11 provides information on the 15 predominantly urban regions that are projected to have the fastest expanding populations during the period 2015–50. Some of the most rapid increases are expected in capitals and/or their adjoining urban regions, for example, Bruxelles/Brussel, parts of London, Stockholms län, Ilfov (the region surrounding the Romanian capital of Bucureşti), Byen København, Wien or Stredoceský kraj (the region surrounding the Czech capital of Praha). Fast population growth rates are also projected for the autonomous Spanish cities of Melilla and Ceuta, as well as the German region of Darmstadt, Kreisfreie Stadt, and Coventry, Nottingham and Luton (all in the United Kingdom).
(%)
Source: Eurostat (proj_13rpms3)
The population projections also confirm some of the patterns already described, insofar as they suggest that the number of inhabitants will continue to contract across parts of Germany, Poland, the Baltic Member States, as well as Greece and Portugal. Some of the most rapid reductions are projected for relatively small urban regions, although there are some well-known cities where the population of their predominantly urban region is predicted to contract by as much as 24–30 %, including Katowicki and Miasto Lódz (both Poland), Grande Porto (Portugal), Attiki (Greece) and Rīga (Latvia).
Source data for tables and graphs
Direct access to
- Urban Europe — statistics on cities, towns and suburbs (online publication)
- Degree of urbanisation classification - 2011 revision
- Eurostat regional yearbook
- Statistics on regional typologies in the EU
- Regions and cities (all articles on regions and cities)
- Territorial typologies
- Territorial typologies for European cities and metropolitan regions
- What is a city?
- Urban audit (ESMS metadata file — urb_esms)
- Regional statistics by typology (ESMS metadata file — reg_typ_esms)
- European Commission, Directorate-General for Regional and Urban Policy, Urban development
- European Commission, Directorate-General for Regional and Urban Policy, A harmonised definition of cities and rural areas: the new degree of urbanisation
- OECD, Redefining urban — a new way to measure metropolitan areas

