Archive:Transport and storage statistics - NACE Rev. 1.1
This Statistics Explained article is outdated and has been archived - for recent articles on structural business statistics see here.
- Data from January 2009. Most recent data: Further Eurostat information, Main tables and Database.
This article introduces a set of statistical articles which analyse the structure, development and characteristics of the economic activities in the transport and storage sector in the European Union (EU). According to the statistical classification of economic activities in the EU (NACE Rev 1.1), this sector covers NACE Divisions 60 to 63, and its activities are treated in more depth in six further articles:
- land transport by rail - NACE Rev. 1.1 (NACE Group 60.1);
- land transport by road - NACE Rev. 1.1 (NACE Group 60.2);
- land transport by pipelines - NACE Rev. 1.1 (NACE Group 60.3);
- water transport - NACE Rev. 1.1 (NACE Division 61);
- air transport - NACE Rev. 1.1 (NACE Division 62);
- warehousing and transport support activities - NACE Rev. 1.1 (NACE Groups 63.1, 63.2 and 63.4);
- travel agencies - NACE Rev. 1.1 (NACE Group 63.3).
Main statistical findings
Structural profile
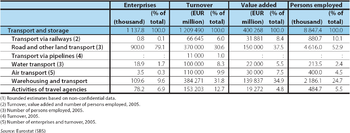
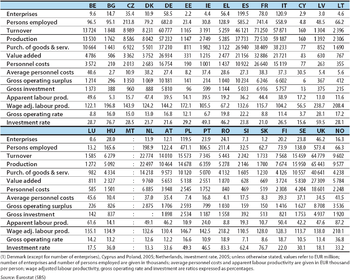
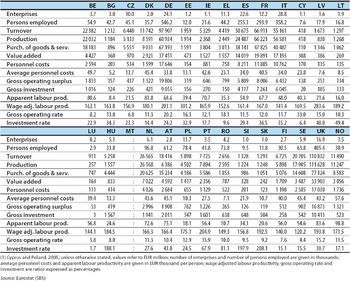
There were in excess of 1.1 million enterprises in the transport services sector (NACE Divisions 60 to 63) in the EU-27 which employed 8.8 million persons in 2006 in the EU-27, which represented 6.8 % of those working in the non-financial business economy (NACE Sections C to I and K). This sector generated EUR 400.3 billion of value added in 2006 from turnover valued at EUR 1 209.5 billion: equivalent to 7.1 % of value added in the non-financial business economy and 5.4 % of its turnover.
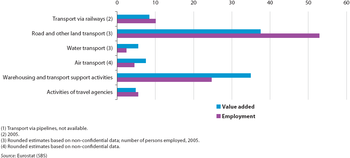
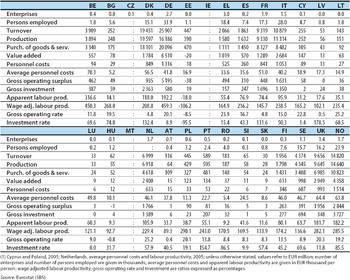
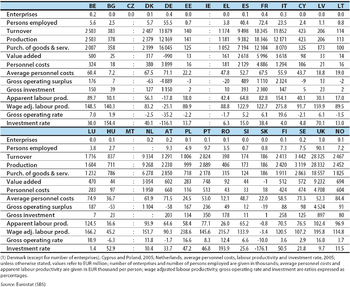
By far the two largest subsectors were road and other land transport (NACE Group 60.2, see Road and other land transport statistics - NACE Rev. 1.1) and warehousing and transport support activities (NACE Groups 63.1, 63.2 and 63.4, see Warehousing and transport logistics statistics - NACE Rev. 1.1) which each contributed more than one third of transport services value added. The next largest subsectors were rail transport (NACE Group 60.1, see Rail transport statistics - NACE Rev. 1.1) and air transport (NACE Division 62, see Air transport sector statistics - NACE Rev. 1.1) which each generated around EUR 30 billion of value added (in 2005 and 2006 respectively). Water transport (NACE Division 61, see Water transport statistics - NACE Rev. 1.1) and the activities of travel agencies (NACE Group 63.3, see Travel agencies statistics - NACE Rev. 1.1) were around two thirds of this size, with value added around EUR 20 billion in 2006. In employment terms the dominance of the single largest subsector, road and other land transport, was even greater, occupying more than one half of the EU-27's transport services workforce. Transport via railways and the activities of travel agencies were the only other subsectors whose contribution to transport services was greater in employment than in value added terms.
The United Kingdom had the largest transport services sector in value added terms while Germany had the largest workforce in this sector. In value added terms the Baltic Member States were the most specialised[1] in transport services, as they, as well as Luxembourg, generated 10 % or more of their non-financial business economy value added in this sector. The transport services sector recorded its smallest shares of non-financial business economy value added in Germany, Slovakia and Ireland. In the case of Latvia, in value added terms transport services was the second largest of all the structural business statistics sectors, smaller only than wholesale trade.
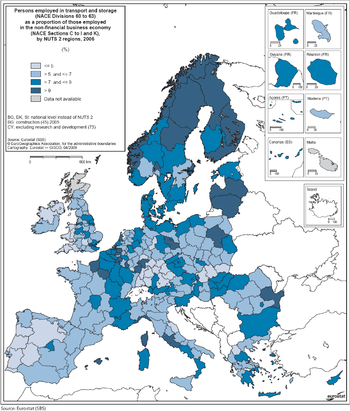
An analysis of the regional specialisation based on the non-financial business economy employment share of this sector shows that there are a number of regions that have a very different level of specialisation from the average recorded for the country to which they belong. While the island region of Åland (Finland) is by far the most specialised region (at the level of detail shown in the map) in transport services, the next two most specialised regions, Bratislavský kraj (Slovakia) and Bremen (Germany), are both in Member States which had a particularly low value added specialisation in transport services.
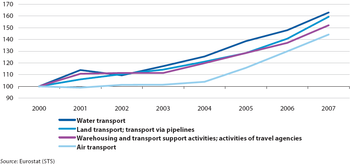
The development of the EU-27 turnover indices between 2000 and 2007 for transport services NACE divisions shows that the strongest growth was for water transport, with average growth of 7.2 % per year over this period. Land transport and transport via pipelines recorded average growth that was only slightly slower (6.9 % per year). Average growth in warehousing, transport support activities and activities of travel agencies (6.2 % per year) and air transport (5.4 % per year) was somewhat lower still, but nevertheless above the non-financial services (NACE Sections G to I and Divisions 72 and 74) average in both cases.
During the period from 2000 to 2007, there was a negative rate of change in the turnover index for water transport in 2002 (-3.9 %) and for air transport in 2001 (-1.1 %), the latter reflecting a general economic slowdown as well as a number of exceptional circumstances. Whilst air transport recorded the lowest average growth over the seven-year period studied, in the most recent years for which data are available (2005 to 2007) it recorded double-digit growth each year, with the highest sales growth among the four transport services NACE divisions in two of these three years.
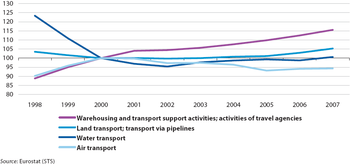
EU-27 employment indices are available for transport services NACE divisions from 1998, and these show a contrasting development in the various activities. The strongest growth was for warehousing, transport support activities and activities of travel agencies, for which growth averaged 3.0 % per year over this nine-year period, with growth recorded each and every year. This was the only one of the four transport services NACE divisions that recorded average employment growth above the non-financial services average (2.3 %). Air transport recorded an annual average growth rate of 0.5 %, but this was composed of strong growth in 1999 and 2000, followed by a more gentle decline most years since then, with the 1.0 % increase of 2006 the only significant recent employment gain in this subsector. Land transport and transport via pipelines also recorded overall growth during this period, a more modest 0.2 % per year average. This resulted from a relatively strong fall in employment in 1999 and 2000, followed by a period of relatively stable employment, with more rapid expansion in the last two years for which data are available. Water transport was the only transport services NACE division to record an overall fall in employment between 1998 and 2007, averaging 2.2 % per year. This was, however, due to a very strong fall in employment in 1999, 2000 and to a lesser extent 2001 and 2002. Since then the water transport employment index only fell once (-0.6 % in 2006), and averaged growth of 1.1 % per year over the period 2002 to 2007.
Size class data show that large enterprises (with 250 or more persons employed) played an important role in transport services, with close to half (48.5 %) of the sector's value added and more than two fifths (40.7 %) of its employment within the EU-27 in 2006: in both cases this was well above the non-financial business economy average. All three of the other size classes contributed less in employment and value added terms to the transport services total than they did to the non-financial business economy total. Behind these averages for the transport services sector lies a distinction, essentially between air and rail transport which are dominated by large enterprises on one hand, and the remaining transport services which are characterised by an employment contribution from large enterprises closer to the average for the non-financial business economy. The information that is available for a few Member States illustrates that transport via railways is dominated by large enterprises to a greater extent than in nearly any other activity: in Germany large enterprises contributed 93.2 % of employment in rail transport in 2006, while the equivalent share in the United Kingdom was 98.6 %. Equally, large enterprises accounted for a large share of air transport employment, exceeding 60 % in all of the Member States with data available for 2006. The importance of large enterprises in the EU-27's air transport sector was such that they accounted for 93.2 % of this activity's employment in 2006: this was the second highest employment share of large enterprises among all of the non-financial business economy NACE divisions [2]in 2005 or 2006, only smaller than for the mining of coal and lignite and the extraction of peat (NACE Division 10).
Transport of goods and passengers
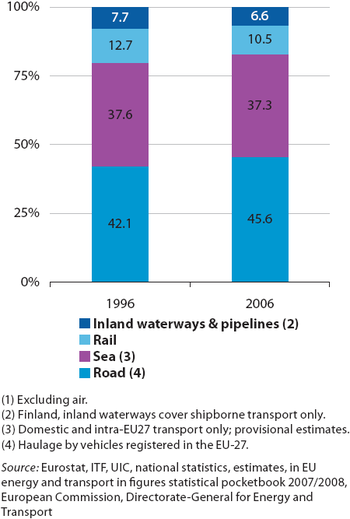
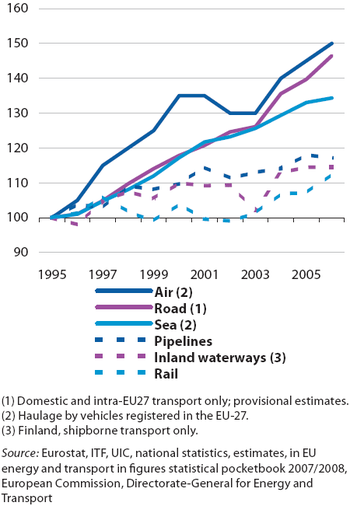
Over several decades, road and sea transport of goods increased strongly in the EU, while the volume of goods transported by inland waterways was relatively stable and rail freight transport declined. For the EU-27 around ten years of data is now available for most modes of transport, and this provides an insight into the changes in more recent periods for both goods and passengers. Since 1996 the use of road freight transport increased steadily and strongly, and by 2006 its share (in terms of tonne-kilometres) of total freight (excluding air transport and extra-EU-27 sea transport) was approaching 50 %. Rail, pipeline and inland water freight transport, as well as intra-EU sea transport all increased in terms of tonne-kilometres transported, but their share of total freight transport decreased (only slightly for sea freight transport).
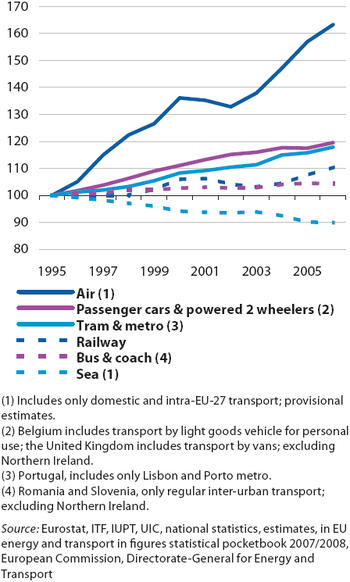
EU-27 sea passenger transport displayed a fall in the number of passenger-kilometres transported every year from 1995 onwards, with the exception of 2003. The fall in 2005 was particularly strong, down 2.4 %. In contrast, rail passenger transport recorded growth most years from 1997 onwards, with falls recorded only in 2002 and 2003. Growth was particularly strong in the two most recent years, 2.8 % recorded in 2005, and 2.7 % in 2006. Other collective land passenger transport such as buses, metros, trams and coaches also recorded relatively stable increases in their respective volumes of passenger transport, generally stronger for trams and metros than for buses and coaches.
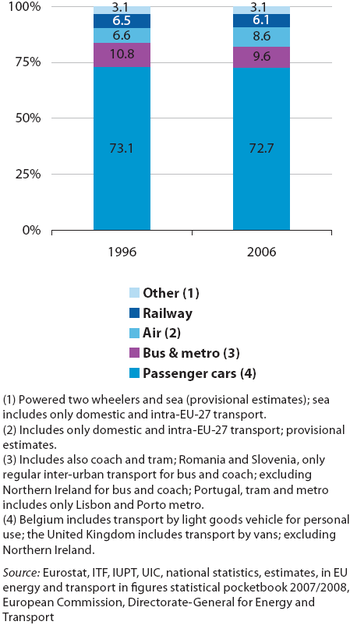
In the EU-27 the fastest increase in passenger transport over the period considered was recorded for air transport, as its share of total passenger transport (in terms of passenger-kilometres) rose from 6.6 % in 1996 to 8.6 % by 2006. The relatively stable modal share of passenger cars reflects a growth rate in the use of passenger cars that was slightly higher than the rates recorded by all other forms of passenger transport (except for air transport).
Employment characteristics
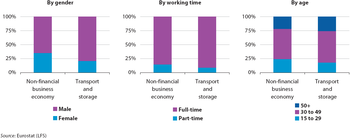
On the basis of Labour force survey data, transport services clearly stand out from most other service activities in terms of their gender profile. Only 20.9 % of those persons employed in this sector in 2007 in the EU-27 were women, around three fifths of the average for the non-financial business economy where women accounted for 35.1 % of those employed. In land transport and transport via pipelines (NACE Division 60) the share of women in the workforce was just 13.5 %, among the lowest shares across the non-financial business economy NACE divisions, higher only than in construction and two mining and quarrying (NACE Section C) divisions. The share of women in the workforce was also particularly low in water transport, 19.9 %, and just below the non-financial business economy average in warehousing, transport support activities and the activities of travel agencies (32.4 %). The only one of the four transport services NACE divisions where the share of women in the workforce was above the non-financial business economy was air transport where 40.7 % of the workforce was female.
Part-time work was also less common in transport services than in other activities, since 90.9 % of those employed in transport services in the EU-27 in 2007 worked on a full-time basis, compared with a non-financial business economy average of 85.7 %. The high incidence of full-time employment was observed in three of the transport services NACE divisions, particularly so in water transport (94.2 %) and land transport and transport via pipelines (92.7 %). The lowest rate of full-time employment was recorded for air transport (84.3 %), just 1.4 percentage points below the non-financial business economy average.
The age profile of the transport services workforce was also markedly different from the non-financial business economy average. The proportion of the EU-27 transport services workforce aged 15 to 29 was 17.7 % in 2007, some 6.7 percentage points below the average for the non-financial business economy. This was reflected in an above average share of older workers (aged 50 or more) representing more than one quarter (25.7 %) of the workforce, compared with just over one fifth (21.9 %) for the non-financial business economy as a whole. All of the transport services NACE divisions recorded a relatively low proportion of younger workers, but this was most notable for land transport and transport via pipelines where the proportion was as low as 14.1 %, one of the lowest among the non-financial business economy NACE divisions, higher only than in some mining and quarrying (NACE Section C) divisions. Air transport was the only transport services NACE division where the proportion of older workers (20.0 %) was below the non-financial business economy average, while the highest proportion of older workers was recorded for land transport and transport via pipelines and for water transport services (both 27.8 %).
Expenditure, productivity and profitability
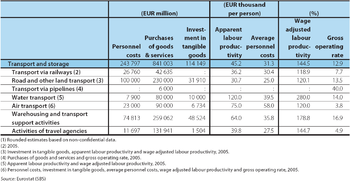
Transport services reported high gross tangible investment, EUR 114.1 billion in 2006 in the EU-27, equivalent to 11.0 % of the total within the non-financial business economy, a share far greater than this sector's employment or value added shares. As such, the investment rate (investment compared to value added as a percentage) in transport services was 28.5 %, just over 10 percentage points higher than the non-financial business economy average (18.4 %). Water transport recorded a particularly high investment rate (45.5 %) in 2006, as did warehousing and transport support activities (34.7 %). In 2005, the three subsectors that make up land transport and transport via pipelines (NACE Divisions 60) recorded a combined investment rate of 27.0 %, and air transport recorded a rate of 24.8 %, in both cases below the transport services average but above the non-financial business economy average. By this measure one of the transport services subsectors stood out from the others, and this was the activities of travel agencies where gross tangible investment was equivalent to just 7.8 % of value added.
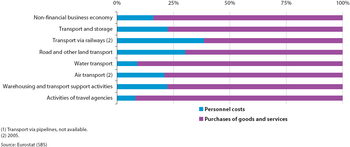
An analysis of operating expenditure indicates that transport services use a relatively large amount of labour, with personnel costs accounting for around 22.5 % of operating expenditure in the EU-27 in 2006, approximately 1.4 times the average share in the non-financial business economy. This share was particularly high for transport via railways (38.6 %, 2005), and road and other land transport (30.3 %), while it was particularly low for the activities of travel agencies (8.1 %), an activity that often involves relatively high purchases of goods and services that are resold to customers.
The high levels of full-time employment may, to some extent, explain why average personnel costs faced by transport services enterprises were generally high: in transport services they averaged EUR 31.3 thousand per employee in 2006 in the EU-27 compared with EUR 28.8 thousand for the non-financial business economy as a whole. The relatively high level of average personnel costs impacted on the wage-adjusted labour productivity ratio, which represents the extent to which value added per person employed covers average personnel costs per employee. In the EU-27’s transport services sector this ratio was 144.5 % in 2006, below the non-financial business economy average of 151.1 %. There were considerable differences in the value of this ratio between the transport services subsectors, with a particularly high ratio for water transport (280.0 %, 2005). No recent data is available for transport via pipelines, but in all six of the Member States with 2005 or 2006 data available for this subsector the wage-adjusted labour productivity ratio was in excess of 500 %.
In contrast, the gross operating rate (gross operating surplus relative to turnover) was higher for transport services (12.9 %) in 2006 than the non-financial business economy average (10.8 %). An exceptionally high gross operating rate (40.0 %, 2005) was recorded for transport via pipelines, the highest rate among all non-financial business economy NACE groups with data available.
Data sources and availability
The main part of the analysis in this article is derived from structural business statistics (SBS), including core, business statistics which are disseminated regularly, as well as information compiled on a multi-yearly basis, and the latest results from development projects.
Other data sources include short-term statistics (STS), the Labour force survey (LFS) and Eurostat, ITF, UIC, national statistics, estimates, in EU energy and transport in figures statistical pocketbook 2007/2008, European Commission, Directorate-General for Energy and Transport.
Context
The transport and storage sector focuses on transport services provided to clients for hire and reward. When analysing transport traffic volumes (for example, tonnes of freight) as presented in this article, it is important to bear in mind that these include own account transport as well as transport services for hire and reward. This is particularly important in road transport where, for example, a manufacturer might collect materials or deliver own output, rather than contracting a transport service enterprise to do this. Equally, the use of own vehicles (typically passenger cars) accounts for a very large part of passenger transport. Such own account transport does not contribute towards the statistics on the transport services sector.
EU transport policy is based upon the 2001 White paper ‘European transport policy for 2010: time to decide’ and the 2006 mid-term review in the European Commission's communication (COM(2006) 314) ‘Keep Europe moving – sustainable mobility for our continent’. In 2007 the European Commission adopted a communication (COM(2007) 606) on ‘Keeping freight moving’, to make rail freight more competitive, facilitate modernisation of ports, and review progress in the development of sea shipping.
Environmental issues remain of great importance to this sector, as transport is a major source of emissions and noise. In 2008 the European Commission put forward a package of measures related to road and rail transport referred to as ‘Greening Transport’. This included a communication (COM(2008) 433) summarising the packages and initiatives planned for 2009, a strategy to internalise the cost of transport externalities, a proposal for a Directive on road tolls for lorries, and a communication on rail noise. The overall thrust of the package is to try to move towards more sustainable transport.
See also
- Freight transport statistics
- Freight transport statistics - modal split
- Inland transport infrastructure at regional level - Railways
- Passenger transport statistics
Further Eurostat information
Publications
- European Business: Facts and figures - 2009 edition
Main tables
Database
Dedicated section
Other information
- COM(2006) 314 of 22 June 2006 on Keep Europe moving - Sustainable mobility for our continent
- COM(2007) 606 of 18 October 2007 on The EU's freight transport agenda: Boosting the efficiency, integration and sustainability of freight transport in Europe
- COM(2008) 433 of 8 July 2008 on Greening Transport
