Archive:Sustainable development - public health
This Statistics Explained article is outdated and has been archived - for recent articles on sustainable development indicators see here.
- Data from July 2015. Most recent data: Further Eurostat information, Database.
This article provides an overview of statistical data on sustainable development in the area of public health. It is based on the set of sustainable development indicators the European Union (EU) agreed upon for monitoring its sustainable development strategy.. This article is part of a set of statistical articles for monitoring sustainable development, which are based on the Eurostat publication 'Sustainable development in the European Union - 2015 monitoring report of the EU sustainable development strategy'. The report is published every two years and provides an overview of progress towards the goals and objectives set in the EU sustainable development strategy.
Table 1 summarises the state of affairs in the area of public health. Quantitative rules, applied consistently across indicators and visualised through weather symbols, provide a relative assessment of whether Europe is moving in the right direction and at a sufficient pace, given the objectives and targets defined in the strategy.
Overview of the main changes
The headline indicator in the thematic area of ‘public health’ shows people are tending to live longer. This is also evident in the steadily decreasing amount of people dying from chronic diseases before the age of 65. However, the expected amount of years lived without activity limitations have not risen. This indicates that the extra years of life gained are not necessarily spent in good health. Other public health trends generally show a moderately favourable picture. Progress can be seen in two determinants of health: the production of toxic chemicals and the share of people residing in living quarters exposed to excess noise. No improvements are visible in the amount of people reporting unmet needs for health care due to monetary constraints. The share of people unable to afford health care has risen since the onset of the economic crisis in 2008. Little or no progress can also be seen in the share of people suffering from long-standing illnesses or health problems and exposure to air pollution by particulate matter and ozone. Improving these indicators and reducing health inequalities thus remain challenges for the EU.
Key trends in public health
Increases in life expectancy but not in years lived without activity limitations
Girls born in the EU in 2013 could expect to live 83.3 years on average — 5.5 years more than boys. This is an improvement in life expectancy for both sexes. However, the number of healthy life years that girls or boys born in 2013 could expect to live have not changed compared with 2005. This indicates that people on average do not get to spend the years gained without activity limitations. Health inequalities between social groups persist, but evidence suggests that disproportionate health problems in different groups declined between 2004 and 2010. Over the same period, the inequalities between Member States in terms of life expectancy at birth fell for men and women.
Improvements in health indicators have slowed since the onset of the economic crisis and inequalities persist
Out of every 100 000 people in the EU, 129.9 died due to chronic diseases before the age of 65 in 2012 [1]. This is a fall of 21.0 % compared with 2002. Such premature deaths due to chronic diseases differ widely across the EU, especially for men. Overall, the share of people reporting unmet needs for health care due to monetary constraints grew from 2.1 % in 2008 to 2.4 % in 2013. Inequalities between income groups persist as those in the lowest income quintile were more likely to report unmet medical needs. Between 2005 and 2013 the share of people in the EU suffering from a long-standing illness or health problems increased slightly from 30.6 % to 32.4 %. The increase was more pronounced between 2010 and 2013. Long-standing illnesses remain more prevalent among the lower income groups.
Progress in determinants of health such as toxic chemical production or noise annoyance, but poor improvement in particulate matter and ozone exposure
Between 2004 and 2013 the production volume of toxic chemicals fell by 13.8 %, from 234.0 million tonnes to 201.8 million tonnes. The decline in the production of chemicals classified as ‘carcinogenic, mutagenic and reprotoxic’ (CMR), the most toxic chemicals, was less pronounced, with their share of total chemical production remaining close to 10 %. At the same time, total production of non-toxic chemicals remained stable at about 120 million tonnes over the period 2004 to 2013. There was an increase in the exposure to air pollution by very fine particulate matter (PM2.5) — the most hazardous to human health — from 14.3 micrograms per cubic metre in 2000 to 16.9 in 2012. In spite of the rise in PM2.5, overall exposure to air pollution by fine particulate matter (PM10) fell by 3.6 micrograms per cubic metre over the same period, with PM10 concentrations reaching 24.9 micrograms per cubic metre in 2012. Overall urban exposure to air pollution by ozone rose by 555 micrograms per cubic metre between 2000 and 2012, reaching 3 502 micrograms per cubic metre in 2012. However, the trend was volatile due to the influence of weather on ozone levels. Last, there was a drop in the share of the population inhabiting living quarters exposed to noise, from 21.9 % in 2008 to 19 % in 2013. Whether this implies an actual reduction in noise levels or a change of people’s subjective perception of noise is not clear. Across the EU, an estimated 90 million people in urban areas and 35 million outside of these are exposed to excessive noise.
Main statistical findings
Headline indicator
Life expectancy and healthy life years
Life expectancy in the EU has increased by 1.8 years for women and 2.6 years for men between 2004 and 2013. However, people do not necessarily live longer without any activity limitations. In particular women’s healthy life expectancy fell by one year between 2005 and 2013.

Girls born in the EU in 2004 could expect to live 81.5 years. This was 6.3 years longer than boys born in the same year. In the long term, between 2004 and 2013, life expectancy for both women and men increased moderately, by 1.8 and 2.6 years, respectively. The stronger gain for men indicates the life expectancy gender gap has been closing. Men also experienced a stronger short-term gain of 1.5 years compared with one year for women between 2008 and 2012. According to a recent report by the Organisation for Economic Co-operation and Development (OECD), this can at least partly be attributed to women adopting similar risk-increasing behaviours as men, such as smoking, and to a sharp reduction in deaths from cardiovascular diseases among men (OECD, 2014, pp.16).
- Women live longer than men but spend more years with a disability or disease
In contrast to overall life expectancy, the disability- or disease-free life expectancy measured by the healthy life years indicator does not show a gender gap. Girls born in 2013 could expect to spend 61.5 years in good health. At 61.4 years, the healthy life expectancy for boys born in the same year was only slightly lower. Given that healthy life expectancy does not differ between men and women, yet women’s overall life expectancy considerably exceeds that of men, women can on average be assumed to spend a greater share of their lives with a disability or a disease. Moreover, healthy life expectancy has not improved over time. Between 2005 and 2013 it fell by 1.0 years for women, while it grew by 0.3 years for men. This shows that people are not spending the extra life years gained without activity limitations. Instead they have to live with some kind of disability or disease.
- How life expectancy and healthy life years vary between Member States
In 2013, girls born in Spain had the highest life expectancy, at 86.1 years. This was 2.8 years longer than the EU average and 7.5 years more than in Bulgaria, which has the lowest life expectancy in the EU. In 2013, women in nine Member States had a lower life expectancy than the EU average in 2004. This includes the newest Member State, Croatia. Disparities in life expectancy among countries are even larger for men. In 2013, boys born in Italy had the highest life expectancy at 80.3 years, which was 2.5 years above the EU average and 11.8 years above the Member State with the lowest male life expectancy, Lithuania. Men in the same nine countries that had the lowest life expectancy for women, as well as Estonia, also had a lower life expectancy in 2013 than the EU average in 2004. However, the increase in life expectancy in these countries clearly exceeded the EU average between 2004 and 2013 and was especially high between 2007 and 2013, indicating they have been catching up to the rest of the EU.

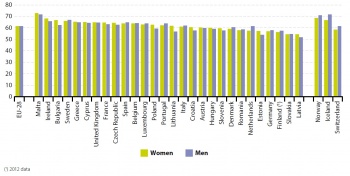
Differences in healthy life years [2] across Member States are more pronounced than for life expectancy. In 2013, the country with the highest healthy life expectancy for both men and women was Malta. There, boys and girls born in 2013 could expect to live around ten years more without activity limitations than the EU average. Furthermore, in Latvia, the country with the fewest expected healthy life years for men and women in 2013, women were expected to spend 7.3 fewer years without any activity limitations and men 9.7 fewer than the EU average. Thus the difference in healthy life expectancy across the EU varies by up to almost 20 years.
- Health inequalities in the EU
Over the past few years the gap between the Member State with the highest life expectancy at birth for men compared with the lowest has tightened by about 11 %, from 13.3 years in 2008 to 11.8 years in 2013. Over the same period the gap for women also declined by about 4 % from 7.8 years to 7.5 years. The Gini coefficient, used as a measure of inequality between Member States, has declined as well [3]. From 2000 to 2010 the Gini coefficient of male life expectancy at birth was reduced by 3.5 % and the female coefficient by 10.4 % [4]. This decrease is partly due to a fall in the inequality in infant mortality across European countries. From 2000 to 2010, the Gini coefficient of infant mortality decreased by 26.4 % (European Commission, 2013, p.20). Health inequalities between social groups are due to many factors, including behavioural factors and differences in living and working conditions, but also in access to and quality of health care. A European Commission report on health inequalities in the EU shows that whichever indicator of socioeconomic status is considered — education, income or material deprivation — reporting of poor general health and long-standing health problems tend to be less frequent in the most advantaged group and increasingly common as disadvantage worsens. Of these, the strongest association is between material deprivation and health as well as between education and health. For instance, although women are more likely to report being in bad health than men, when controlling for education, the odds of reporting so decrease. This suggests that socioeconomic disadvantages experienced by women largely account for differences in general health between men and women (European Commission, 2013, pp. 50-62). Finally, both at a regional level and between Member States the level of health can be associated with GDP, however, this connection is far stronger for countries with lower levels of GDP OECD, 2011, p.24).
Health and health inequalities
Deaths due to chronic diseases
A 21.0 % drop in the death rate due to chronic diseases before the age of 65 was experienced between 2002 and 2012. The decrease remained steady throughout the long- and short-term period. In 2012 chronic diseases accounted for almost 60 % of all premature deaths and were more common among men than women.


According to the European Health Report 2012 by the World Health Organization (WHO), chronic diseases such as cardiovascular diseases, cancer and chronic obstructive pulmonary diseases accounted for 80 % of all deaths in the EU in 2009. Death due to chronic diseases is considered premature if it occurs before the age of 65. The WHO report shows about 30 % of deaths in the EU in 2009 occurred before the age of 65, and the most frequent cause of these were chronic diseases WHO, 2012).
Out of every 100 000 people, 164.4 prematurely died of a chronic disease in 2002. This rate steadily decreased to 129.9 deaths per 100 000 persons in 2012. This constitutes a reduction of 21.0 % in the long run between 2002 and 2012. Moreover, the decrease remained constant throughout the short and the long run.
- How deaths due to chronic disease vary between Member States
Standardised premature death rates due to chronic diseases vary strongly across the EU. In 2012 Hungary had the highest death rate for people under the age of 65 due to a chronic disease, with 272.8 deaths per 100 000 people. This was more than three times as high as in Sweden, the Member State with the lowest rate. Notably, among countries below the EU average (129.9 premature deaths per 100 000 people), differences in premature death rates were substantially smaller than among the countries above the EU average. For example, almost twice as many people below the age of 65 died of a chronic disease in Hungary than in Slovenia, the Member State just above the EU average. Of the 11 countries where premature death rates due to chronic diseases were above the EU average, ten also had an overall premature death rate that exceeded the EU average. Yet, similar to the situation of the EU average, premature deaths due to chronic diseases accounted for about 60 % of all premature deaths in these countries. This shows that premature chronic deaths, among all premature deaths, are not more common in these countries, but are a result of the overall higher premature death rate.
- Premature deaths due to chronic diseases are far more common for men than for women
In 2012, the distribution of premature death rates among men strongly corresponded to the overall distribution of premature death rates, where the same 11 countries as well as Greece were above the EU average. Conversely, the premature death rates for women differed far less across Member States and showed a rather different distribution than overall premature death rates. Thus, the inter-country differences in premature death rates among men were the main driver behind the differences in overall premature death rates. The premature death rate due to chronic diseases among men exceeded that of women in all Member States. An exception is the European but non-EU-member Principality of Liechtenstein, where women were slightly more likely to die prematurely of a chronic disease than men. Lower death rates translate into higher life expectancy and explain the gender gap in the headline indicator ‘life expectancy’. Cancer and cardiovascular diseases were the most common chronic disease causing premature death both for men and women in the EU (Nichols, et. al., 2012, p.25).
Unmet needs for medical health care
A 0.3 percentage point increase in the share of people reporting unmet needs for medical health care due to monetary constraints was recorded in the EU between 2008 and 2013. Differences between income groups persist.
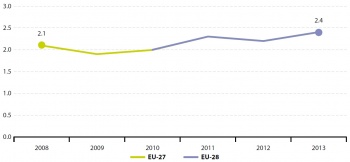

In 2013, 2.4 % of the EU population reported being unable to afford medical treatment or examination in the past 12 months [5]. This represents an unfavourable 0.3 percentage point increase since the onset of the financial crisis in 2008, indicating that economic struggles have hindered access to medical care.
- The more people are faced with economic constraints, the more often they report unmet medical needs
The relationship between economic hardship and unmet needs for medical health care becomes apparent when comparing people from different income quintiles. While only 0.6 % of people in the highest income quintile reported unmet needs for medical care due to monetary constraints in 2013, the lower the income quintile, the higher this share becomes. At a rate of 4.9 % of the population, people in the lowest income quintile were more than eight times as likely to report unmet needs for medical care due to monetary reasons as in the highest income quintile.
Long-standing illnesses or health problems
The amount of people suffering from a long-standing illness or health problem grew by 1.8 percentage points in the long-term period between 2005 and 2013. This increase has been even stronger in the short-run between 2008 and 2013. Differences between income groups persist.
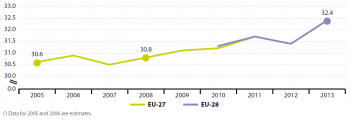

In 2013, 32.4 % of the EU population suffered from a long-standing illness or health problem. Although this value rose moderately, by 1.8 percentage points, in the long term period between 2005 and 2013, most of the increase occurred in the short term between 2008 and 2013.
- The lower their income, the more likely people are to report long-standing health issues
In 2013, 25.9 % of people in the highest income quintile reported having suffered from long-standing illnesses or health problems. This is in contrast with 35.9% of people in the lowest and 37.5% of people in the second lowest income quintile. This reveals a difference between income groups that seems to have remained stable for the entire period from 2010 to 2013. In addition, women are more likely to report long-standing health issues than men. In 2013, 34.6 % of women indicated dealing with long-standing health issues compared with 30.1 % of men. Also, the likelihood of reporting such health issues increased with age for both sexes.
Determinants of health
Production of toxic chemicals
Between 2004 and 2013 total production of toxic chemicals fell by 13.8 %. The short-term trend since 2008 confirms this favourable development. Although the share of non-toxic chemicals in total production increased by 3.3 %, the share of the most toxic chemicals remained unchanged.
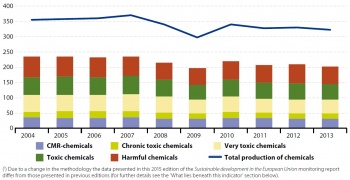
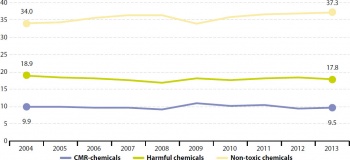
In 2013, 321.8 million tonnes of industrial chemicals were produced in the EU. Of these, 201.8 million tonnes were toxic to human health to varying degrees. The production volume of toxic industrial chemicals in 2013 was 32.2 million tonnes below the volume in 2004 and 13.7 million tonnes below that in 2008 and thus represents a rather favourable decrease in the long and the short term. This development is in line with the goals of the Regulation for the registration, evaluation, authorisation and restriction of chemicals (REACH) [6] to reduce the total volume of toxic chemicals [7].
- While the production share of non-toxic chemicals increased, the share of the most toxic chemicals remained unchanged
As a favourable result of the decline in the production of toxic chemicals, the share of non-toxic chemicals produced increased modestly, reaching 37.3 % in 2013, with a production volume at around 120 million tonnes. The share of industrial chemicals toxic to human health fell slightly from 66.0 % in 2004 to 62.7 % in 2013 (see Figure 11). This is also mirrored in the production of chemicals classified as ‘harmful’, the share of which fell by 1.1 percentage points from 2004 to 2013. ‘Very toxic’ chemicals showed a similar fall over the same period. The decline in the production of the most toxic chemicals — those classified as ‘carcinogenic, mutagenic and reprotoxic’ (CMR) — was, however, less pronounced. While production volumes of CMR chemicals fell by 12.3 % between 2004 and 2013, their share in total chemical production remained close to 10 % over the same period.
Exposure to air pollution by particulate matter
Exposure to air pollution by the finest and therefore most hazardous particulate matter (PM2.5) increased by 2.6 micrograms per cubic metre in the EU between 2000 and 2012. Despite this negative development, the overall concentration of fine particulate matter (PM10) has fallen by 3.6 micrograms per cubic metre since 2000.
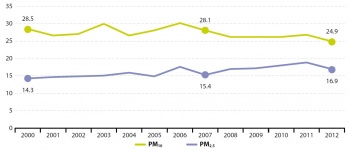
The amount of particulate matter smaller than 10 micrometres (PM10) fell by 3.6 micrograms per cubic metre over the long-term period between 2000 and 2012. Yet given the year-on-year variation, it is difficult to discern a clear trend. Most of this reduction took place in the most recent years between 2007 and 2012. Within the PM10 category, the particulate matter that is smaller than 2.5 micrometres (PM2.5) poses the strongest risk factor for mortality. In contrast to PM10, the amount of PM2.5 increased both in the long term and short term. Overall, since 2000 the amount of PM2.5 has increased by 2.6 micrograms per cubic metre, reaching a level of 16.9 micrograms per cubic metres in 2012.
- Severe heat waves partially explain peaks in particulate matter exposure
Peaks in particular matter exposure in 2003 and 2006 were partially due to severe summer heat waves. The hot, dry conditions led to stagnant air in which pollutants accumulated. In 2003, conditions were exacerbated by wildfires in south-western Europe, which produced large quantities of particulates that were then transported to the northern and eastern parts of Europe (Hodzic, et.al., 2007, p.4705-4760).
- Particulate matter takes higher toll on urban zones than rural areas
A report on Air Quality in the EU by the European Environment Agency showed that in 2012, 21 % of the EU population lived in areas where the daily limit values for PM10 were exceeded (European Environment Agency, 2014). According to the EU Air Quality Directives, the daily limit value for PM10 was set at 50 micrograms per cubic metre per day, not to be exceeded on more than 35 days per year, and the target value for PM2.5 was set at 25 micrograms per cubic metre per year [8]. In 2012 the PM10 daily limit value was exceeded at 27 % of urban measuring sites and even at 7 % of rural sites. The PM2.5 target value was also exceeded more in urban areas (13 %) than in rural areas (4 %) (European Environmental Agency, 2014).
Exposure to air pollution by ozone
Exposure to air pollution by ozone increased by about 555 micrograms per cubic metre in the EU between 2000 and 2012. Changing weather patterns have contributed to yearly and regional differences in ozone concentrations. There was a slight decrease between 2007 and 2012 with smaller annual variations.
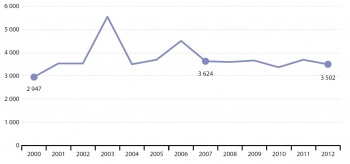
Overall exposure to air pollution by ozone increased by 555 micrograms per cubic metre in the long-term period between 2000 and 2012. However, the trend was very unstable, particularly between 2000 and 2007. In contrast to the negative long-term trend, exposure to air pollution by ozone in the short term, between 2007 and 2012, decreased slightly and followed a smoother path. High exposure in the year 2003 is related to a heat wave in that summer (Johnson, et. al., 2005, p.168-171). A smaller peak also occurred in 2006 for similar reasons. Urban exposure to ozone varies widely between countries, partly due to differences in climate and vegetation. In general, southern countries with hotter summers show higher exposure levels than cooler northern countries. Nevertheless, peaks occurred throughout the EU in 2003 and 2006 due to exceptionally high temperatures. This increase was most pronounced in northern countries, which showed higher relative increases compared with countries in the south.
Annoyance by noise
The share of people inhabiting living quarters exposed to noise dropped by 3.0 percentage points between 2008 and 2013. It is however unclear whether this reduction is due to a change in conditions or in people’s perceptions.

In 2013, 18.9 % of the EU population reported they suffered from noise in their living arrangements [9]. This represents a 3.0 percentage point reduction since 2008 [10]. This could be explained by quieter cars resulting from EU legislation [11]. However, because the indicator shows the subjective assessment of noise, it is not clear if the reduction is due to a change in conditions or in people’s perceptions. The five countries in which people were most likely to indicate they suffer from noise in their living quarters are Malta, Romania, Cyprus, Germany and the Netherlands. Countries where the opposite holds true are Croatia, Estonia, Bulgaria, Norway and Iceland. Thus no geographic pattern of suffering from noise can be discerned. The European Environment Agency mapped noise in the EU based on the location of major roads, railways, airports and agglomerations. They found that road transport is the most widespread noise source and estimated that about 90 million people in urban areas and 35 million people outside of these areas are exposed to excess noise (European Environmental Agency, 2014).
Context
Why do we focus on public health?
The first principle of the Rio Declaration on Environment and Development states ‘Human beings are at the centre of concerns for sustainable development. They are entitled to a healthy and productive life in harmony with nature’ (Council of the European Union, 2009). This illustrates that public health is a key component of sustainable development. Healthy people are more productive and have more resources to contribute to communal life. Thus a society in good health represents added value for the economy and social development. As a result, sustainable development cannot be ensured in societies marked by widespread disease. Countries at different levels of development face different public health threats and challenges. While ‘traditional health threats’ are associated with a lack of development, ‘modern health threats’ are caused by rapid development that lacks health and environmental precautions and leads to unsustainable consumption of natural resources. Examples of such modern risks include increased road traffic, air pollution and use of toxic chemicals [12], but also social conditions such as income inequality, unemployment or social isolation (WHO, 2003).
One of the major challenges for policy makers posed by modern health threats is that a long period may pass before health effects manifest themselves [13]. For instance, a cancer-causing chemical released into the environment today may not reach a person until it has passed through the food chain for months or years. This means that understanding the pathways through which the hazards move is particularly important. In such cases, the ‘precautionary principle’ is applied. This states that when human activities could lead to morally unacceptable harm that is scientifically plausible but uncertain, actions have to be taken to avoid or diminish that harm (UNESCO, 2005).
There is a strong link between health and other issues related to sustainable development. Health is influenced by environmental issues associated with climate change and energy (such as greenhouse gas emissions), sustainable transport (such as annoyance by noise), sustainable production and consumption (such as atmospheric emissions), and the management of natural resources. A second link can be seen between socioeconomic development and health. Improved living conditions and the reduction of inequalities greatly contribute to better health. For poorer people, cost may be an obstacle to gaining access to health services and leading a healthy lifestyle. Generally, socially included people benefit from the support of their environment. Finally, economic activity or employment greatly contribute to mental health stability. These issues are addressed in the EU Sustainable Development Strategy’s key challenges of ‘public health’, ‘social inclusion’, ‘demography and migration’ and ‘fighting global poverty’.
How does the EU tackle public health?
The protection from health threats is an explicit objective in the EU Sustainable Development Strategy (EU SDS) (Council of the European Union, 2009). ‘Public health’ is one of seven key challenges of the strategy, with the overall objective to ‘promote good public health on equal conditions and improve protection against health threats’. At the global level, the Agenda 21 adopted at the 1992 Rio Earth Summit (UN, 1998) has been one of the most significant points in establishing an international policy framework for health in sustainable development. Promoting good health is furthermore an integral part of Europe 2020 (Commission communication, 2010), being particularly important for the strategy’s priority on smart and inclusive growth. It is specifically addressed through the European Innovation Partnership on Active and Healthy Ageing [14]. This pilot scheme aims to increase the average healthy lifespan of EU citizens by two years by 2020. In addition, the EU health strategy ‘Together for Health’ [15] supports the overall Europe 2020 strategy. The EU health strategy is based on four core principles: (i) shared health values, (ii) health is the greatest wealth, (iii) health in all policies and (iv) strengthening the EU’s voice in global health. It puts forward the following three main objectives:
- Fostering good health in an aging Europe
- Protecting citizens from health threats
- Supporting dynamic health systems and new technologies.
The 2013 report by the European Commission Investing in Health showed how health investments should contribute to the Europe 2020 objective of smart, sustainable and inclusive growth (European Commission, 2013). The three main proposals for smart investment in health were:
- Spending smarter but not necessarily more in sustainable health systems
- Investing in people’s health, particularly through health‑promotion programmes
Investing in health coverage as a way of reducing inequalities and tackling social exclusion.
Further reading on public health
See also
Further Eurostat information
Main tables
- Public Health
Dedicated section
Methodology
- More detailed information on public health indicators, such as indicator relevance, definitions, methodological notes, background and potential linkages, can be found on page 171-196 of the publication Sustainable development in the European Union - 2015 monitoring report of the EU sustainable development strategy.
Notes
- ↑ These numbers refer to standardised death rates and not crude death rates. The (age-) standardised death rate is a weighted average of age-specific mortality rates, whereas the crude death rate describes mortality in relation to the total population.
- ↑ The county breakdown of the indicator healthy life years must be handled with care as treatment and use of medical care as well as mortality registration methods may vary across countries.
- ↑ The Gini coefficient is used as an indicator of inequality. Although it is mainly used to measure income inequality, it can also be applied to health. It can take values from 0 (perfect equality) to +1 (perfect inequality). For details on the method of calculation, see Regidor E, ‘Measures of health inequalities: part 1’, Journal of Epidemiology and Community Health 2004; 58:pp. 858¬–861; also see European Commission Directorate General for Health and Consumers (2011), Expert review and proposals for measurement of health inequalities in the European Union — Full Report, p. 27.
- ↑ European Commission (2013) Report on health inequalities in the European Union, p. 23 and European Commission (2013), Health inequalities in the EU — Final report of a consortium. Consortium lead: Sir Michael Marmot p. 29.
- ↑ The comparability of the indicator between countries is limited as national questions on self-reported unmet need for medical care due to monetary constraints are not completely harmonised, differences in national health systems limit the comparability and indicators based on self-reporting incorporate individual subjective cultural effects and perceptions. The indicator should be interpreted carefully.
- ↑ Regulation (EC) No 1907/2006 - REACH
- ↑ ECHA — Implementing REACH in practice; see http://www.eubusiness.com/topics/chemicals/echa-reach-guide/
- ↑ See: http://eur-lex.europa.eu/legal-content/EN/TXT/?uri=CELEX:32008L0050
- ↑ Some care is needed when interpreting this indicator due to the subjective assessment of noise. What is actually measured is the compound effect of noise when it interacts with people’s standards of what level they consider to be acceptable. An increase in the value of the indicator may not necessarily indicate a similar increase in noise and/or pollution levels but also a decrease of the levels that European citizens are willing to tolerate. In fact, there is empirical evidence that perceived environmental quality by households is not always consistent with the actual environmental quality assessed using ‘objective’ indicators, particularly for noise.
- ↑ While this number refers to EU-28 data in 2013, it is based on EU-27 data in 2008.
- ↑ e.g. Directive 92/97/EEC on the approximation of the laws of the Member States relating to the permissible sound level and the exhaust system of motor vehicles.
- ↑ See: WHO, Traditional Hazards, New Risks.
- ↑ Martens and Michael (2003), Environmental change, climate and health. Issues and research methods, Cambridge University Press.
- ↑ See: http://ec.europa.eu/health/ageing/innovation/index_en.htm
- ↑ See: http://ec.europa.eu/health/strategy/policy/index_en.htm


