Archive:Road freight vehicle statistics - lorries, road tractors and trailers
This Statistics Explained article is outdated and has been archived - for recent articles on sustainable development see here.'
This article presents statistics on vehicles for transport of freight in the European Union (EU): lorries, road tractors, semi-trailers and trailers. It describes the development in the number of such vehicles and describes the trends in the registration of new vehicles. It also analyses the load capacity of these vehicles, which is essential for the capacity of the transport sector in the EU to move freight.
In 2012, France and Spain had the highest numbers of lorries, with the strongest growth in France. For road tractors, the highest number was recorded in Poland, followed by France, Germany and Spain. Road tractors are motor vehicles designed to haul semi-trailers and similar trailers without motor; correspondingly, the largest numbers of semi-trailers were found in the same countries.
The registrations of new lorries and road tractors fell sharply in 2009, but have recovered in the subsequent years. These fluctuations were most pronounced in Latvia and the other Baltic Member States, as well as in some other eastern Member States.
Source: Eurostat (online data code: (road_eqs_lrstn)
Source: Eurostat (online data code: (road_eqs_lorroa)
Source: Eurostat (online data code: (road_eqs_lornum)
Source: Eurostat (online data code: (road_eqs_lorton)
Source: Eurostat (online data code: (road_eqs_lormot)
Source: Eurostat (online data code: (road_eqr_lorrin)

Source: Eurostat (online data code: (road_eqr_lrstn)
Main statistical findings
High number of lorries in France and Spain; France recorded the most new lorries
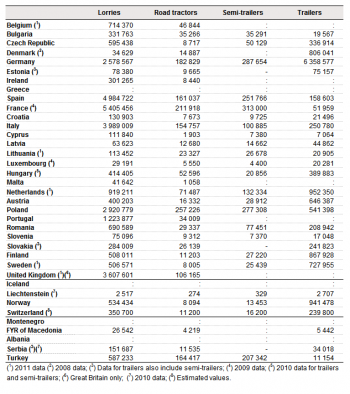
France recorded the highest number of lorries of all Member States with 5.4 million, although this number refers to year 2009. For 2012, the highest number of lorries was reported by Spain (5.0 million), followed by Italy (4.0 million), the United Kingdom (3.6 million; Great Britain only, 2011 data) and Poland (2.9 million) (see Table 1).
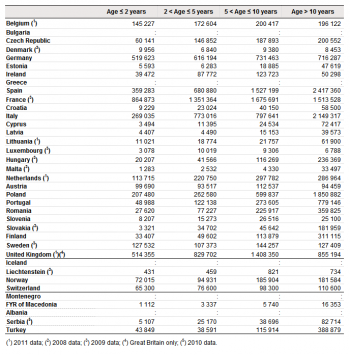
Looking closer at the data behind Table 2, the highest number of 2 years old or newer lorries was recorded in France, with 864 873 (2009 data). There were high numbers of new lorries also in Germany (519 623), the United Kingdom (514 355, 2011 data) and Spain (359 283). Denmark had the highest share of new lorries (29 %, 2008 data). Other Member States with high shares of new lorries were Austria and Sweden (both 25 %, 2009 data for Sweden), Belgium and Germany (both 20 %, 2011 data for Belgium). However, the age structure of the national stocks of lorries differs widely between Member States. In many eastern and southern Member States, the main shares of lorries were 10 years old or older. Malta had the highest share of old lorries, amounting to 80 % of all registered lorries in the country. Thereafter followed Slovakia (69 %; 2009 data), Cyprus (65 %), Portugal (64 %) and Poland (63 %). In contrast, Ireland had the lowest share of old lorries, representing only 17 % of the registered lorries.
Road tractors are motor vehicles designed to haul semi-trailers or other not motorised vehicles, thus the numbers of road tractors and semi-trailers are normally closely correlated. In 2012, Poland recorded the largest stock of road tractors (257 226), far ahead of France (211 918, 2009 data) and Germany (182 829). However, France accounted for the highest number of semi-trailers (313 000, 2009 data). Germany was second on this list (287 654), followed by Poland (277 308). Also Spain recorded high numbers of road tractors and semi-trailers, with 161 037 road tractors and 251 766 semi-trailers respectively.
Spain has the highest number of small lorries
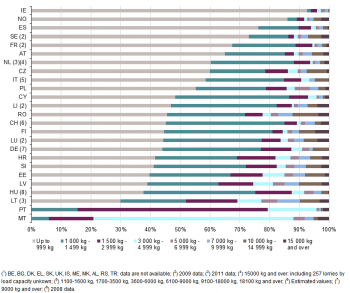
With 3.8 million, Spain topped the list of the highest number of small lorries (lorries with a load capacity of less than one tonne) in 2012. Spain was closely followed by France, with 3.6 million small lorries (2009 data). However, when measured as percentage of the total number of lorries, these small lorries were even more important in Ireland; their share of the total number of lorries was 93 %. The small lorries also made up large share of the lorries in the EFTA country Norway (86 %), as well as in the Member States Spain (76 %), Sweden (73 %; 2011 data), France (67 %; 2009 data) and Austria (65 %).
Figure 1 shows that the two categories covering smaller lorries, with capacity of up to one tonne and from one up to one and a half tonnes respectively, accounted for more than three quarters of all lorries in 13 of the 22 Member States for which data are available. Notable exceptions were Portugal and Malta. On Malta, 82 % of the lorries had a load capacity from 1.5 up to 5 tonnes; in Portugal, this share was 80 %. Looking at the largest lorries, the highest shares of lorries with a load capacity of 10 tonnes or more were recorded in Romania (12 %), in Finland and in the Baltic states Latvia and Lithuania (all 10 %). In absolute numbers, the highest numbers of these heavy lorries were found in Italy (189 037), followed by Germany (140 627; load capacity more than 9 tonnes) and France (127 397; 2011 data). In this context, it should be kept in mind that the methodologies for the voluntary Common Questionnaire for Inland Transport are not harmonized; differences may to a certain extent reflect national vehicle registration systems and practices. See the section below on Data sources and availability for more details.
Large lorries provide more than half of the load capacity in Finland and Sweden
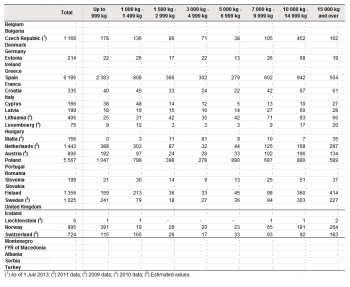
Table 3 shows that the actual load capacity of registered lorries were relatively unevenly distributed over the different size classes (in terms of load capacity) in the Member States for which data are available. In general, the distribution of load capacity of lorries was relatively heterogeneous across small (up to 1.5 tonnes), medium sized (from 1.5 up to 10 tonnes) and large lorries (10 tonnes or more). However, in each Member State there was a dominating size category. The smallest lorries provided around half of the total lorry load capacity in Spain and Cyprus (both 52 %) and the Netherlands (48 %). In contrast, the largest lorries provided more than half of the total lorry load capacity in Finland (57 %) and Sweden (52 %), while the load capacity offered by medium sized lorries was highest in Malta (71 %), Lithuania (47 %) and Poland (41 %). However, it should be noted that these data are only available for 15 Member States.
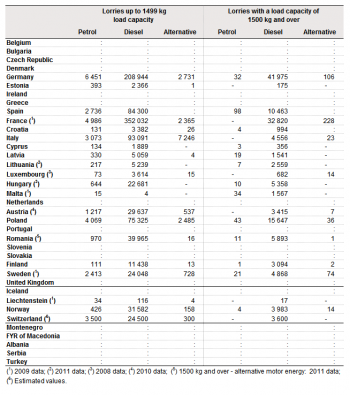
Table 4 shows that lorries with a load capacity of 1.5 tonnes or more were almost exclusively fuelled by diesel in 2012; with the exception of Malta (2.1 %, 2009 data) and Latvia (1.2 %), less than 1 % of these lorries were powered by petrol. In Germany and Sweden, more of the large lorries were motorised by alternative fuel engines than by petrol engines. However, compared to the total number of large lorries, Luxembourg (2.0%; 2008 data) and Sweden (1.5%; 2009 data) showed the highest shares of lorries with alternative fuel engines.
Also for the smaller lorries with a load capacity of less than 1.5 tonnes, diesel was the most common fuel in 2012. In most Member States the share of small lorries powered by petrol lay between 3 % and 9 %. The main exception was Malta, where 79 % of these small lorries were powered by petrol (2009 data). Alternative fuels played only a marginal role also for the smaller lorries; their share was below 1 % for most Member States. However, in Italy 7.0 % of the small lorries were powered by alternative fuels, including hybrid motor concepts. Poland, Sweden (2009 data) and Austria (2010 data) also stand out with alternative fuel shares among small lorries of 3.0 %, 2.7 % and 1.7 % respectively.
Significant decrease in the registrations of new road tractors in Mediterranean Member States in 2012
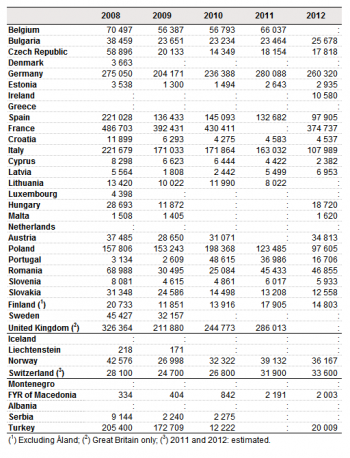
From 2008 to 2009, the registrations of new lorries fell by 20 % or more for almost all Member States (Table 5). In most countries, the registrations picked up again in 2010 and 2011, but showed a renewed decrease in 2012. Out of the 15 Member States for which data are available for both years, 11 recorded a fall in the registrations of new lorries from 2011 to 2012. This fall was especially strong in Portugal (-55 %), Cyprus (-46 %), Italy (-34 %), Spain (-26 %) and Poland (-21 %). Significant increases were only recorded in Latvia (26 %), Estonia (11 %) and Bulgaria (9 %).
There were similar falls in the registrations of new road tractors (motorized vehicles for hauling semi-trailers and similar) from 2008 to 2009 (Table 6); only Cyprus (-1 %) and Malta (-10 %) showed relatively small decreases. While the registrations of new road tractors in Cyprus fell strongly in the three following years, the growth picked up again in 2010 and 2011 in most other Member States. However, in 2012 the number of registrations decreased again in all available Member States except Bulgaria and Croatia. These falls were particularly accentuated in several of the Member States around the Mediterranean sea, including Italy (-28.1 %), Portugal (-25.2 %), Slovenia (-22.7 %) and Cyprus (-19.6 %).
Data sources and availability
Data source
The Eurostat/ITF/UNECE Common Questionnaire on Inland Transport.
Definitions
All definitions used are taken from the Eurostat/UNECE/ITF Illustrated Glossary for Transport Statistics, currently in its 4th edition. This glossary can be found on Eurostat’s website.
Context
The Common Questionnaire on Inland Transport is a joint project of Eurostat, the International Transport Forum (ITF) and the United Nations Economic Commission for Europe (UNECE). The data are provided on a voluntary basis by a large number of countries, both within and outside the European Union. Data is collected from reliable sources, but data collection methodologies are not harmonised at EU level. Comparability across countries is restricted as the classifications used in the national vehicle registers are not harmonised. Vehicles registers may exclude taxis, pick-up and vans, and may also exclude very old vehicles. This article covers data provided by the EU Member States, the European Free Trade Association (EFTA) countries and EU enlargement countries.
See also
- Freight transport statistics
- Motor trades statistics - NACE Rev. 2
- Road freight transport statistics
- Road freight transport by vehicle characteristics
- Stock of vehicles at regional level
- Sustainable development - transport
- Transport statistics introduced
Further Eurostat information
Data visualisation
- Regional Statistics Illustrated - Transport
Publications
- Energy, transport and environment indicators - Pocketbook - 2014 edition
- Decline in European road freight transport in 2011 reflecting the economic climate - Statistics in focus 38/2012
- Slow recovery in road freight transport in 2010 - Statistics in focus 15/2012
- Six years of road freight growth lost to the crisis - Statistics in focus 12/2011
Main tables
- Transport, see:
- Road transport (t_road)
Database
- Transport, see:
- Road transport (road)
- Road transport equipment - Stock of vehicles (road_eqs)
- Road transport equipment - New registration of vehicles (road_eqr)
Dedicated section
Methodology / Metadata
Source data for tables and figures (MS Excel)
Other information
- White paper COM(2011) 144 final Roadmap to a single European transport area – towards a competitive and resource efficient transport system
External links
- International Transport Forum (ITF) - Statistics
- United Nations Economic Commission for Europe (UNECE) - Transport statistics
- Handbook on statistics on road traffic - Methodology and experience (UNECE, 2007)