Archive:Manufacture of computer, electronic and optical products statistics - NACE Rev. 2
This Statistics Explained article is outdated and has been archived - for recent articles on structural business statistics see here.
- Data from April 2013. Most recent data: Further Eurostat information, Main tables and Database.
This article presents an overview of statistics for computer, electronic and optical products manufacturing in the European Union (EU), as covered by NACE Rev. 2 Division 26.

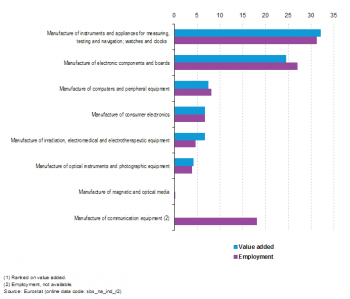
(% share of sectoral total) - Source: Eurostat (sbs_na_ind_r2)


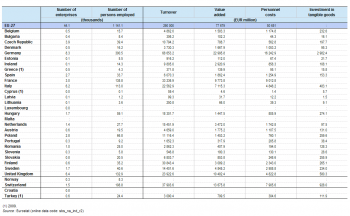
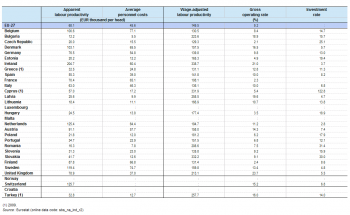

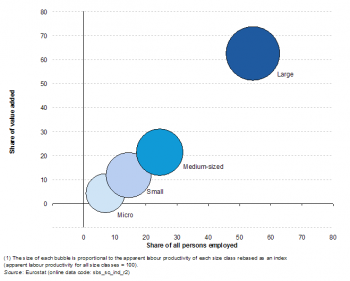
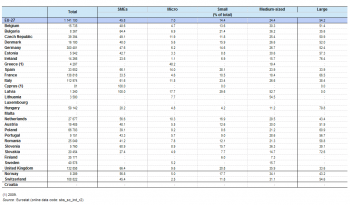
(% share of sectoral total) - Source: Eurostat (sbs_sc_ind_r2)

Main statistical findings
Structural profile
The computer, electronic and optical products manufacturing sector (Division 26) comprised 44.1 thousand enterprises in the EU-27 in 2010, employed 1.14 million persons and generated EUR 77.7 billion of value added. As such, this sector employed 0.9 % of the non-financial business economy (Sections B to J and L to N and Division 95) workforce and generated 1.3 % of its value added; its share of manufacturing (Section C) activity was 3.8 % in employment terms and 4.9 % in value added terms.
The apparent labour productivity of the EU-27’s computer, electronic and optical products manufacturing sector in 2010 was EUR 68.1 thousand per person employed, above the non-financial business economy average of EUR 44.8 thousand per person employed and the manufacturing average of EUR 52.8 thousand per person employed. This high apparent labour productivity ratio was accompanied by high average personnel costs of EUR 45.6 thousand per employee, nearly 1.5 times the EUR 30.9 thousand average for the non-financial business economy and also well above the EUR 35.8 thousand average for manufacturing. Despite these relatively high average personnel costs the wage-adjusted labour productivity ratio for the EU-27’s computer, electronic and optical products manufacturing sector reached 149.5 %, just above the 144.8 % average for the non-financial business economy as a whole and the 148.0 % average for manufacturing.
The gross operating rate for the EU-27’s computer, electronic and optical products manufacturing sector in 2010 indicated that the gross operating surplus was equivalent to 9.2 % of turnover. Operating profitability (by this measure) for the EU-27’s computer, electronic and optical products manufacturing sector was slightly below the average for the whole of the non-financial business economy (10.1 %), but in line with the manufacturing average (9.0 %).
Sectoral analysis
Based on a simple count of the number of enterprises, the two largest subsectors within the EU-27’s computer, electronic and optical products manufacturing sector in 2010 were the manufacture of instruments and appliances for measuring, testing and navigation, and watches and clocks (Group 26.5, hereafter referred to as the manufacture of measuring instruments), and the manufacture of electronic components and boards (Group 26.1). Together, these two subsectors employed close to three fifths (58.3 %) of the EU-27’s computer, electronic and optical products manufacturing sector’s workforce in 2010 and generated a slightly smaller proportion of value added (56.6 %). Behind these two large subsectors was the manufacture of communication equipment (Group 26.3) with just under one fifth (18.1 %) of the computer, electronic and optical products manufacturing sector’s workforce, followed by the manufacture of computers and peripheral equipment (Group 26.2) and the manufacture of consumer electronics (Group 26.4), with 8.2 % and 6.7 % shares of the sectoral workforce respectively. The three smallest subsectors — the manufacture of irradiation, electromedical and electrotherapeutic equipment (Group 26.6), optical instruments and photographic equipment (Group 26.7) and magnetic and optical media (Group 26.8) — collectively employed 8.7 % of the sectoral workforce.
The high level of average personnel costs for the whole of the EU-27’s computer, electronic and optical products manufacturing sector in 2010 was pulled upwards by the manufacture of measuring instruments (EUR 49.9 thousand per employee) as well as by the smaller subsectors concerning the manufacture of irradiation, electromedical and electrotherapeutic equipment and the manufacture of consumer electronics (both EUR 50.0 thousand per employee). All of the remaining subsectors recorded EU-27 average personnel costs per employee that were above the non-financial business economy average (EUR 30.9 thousand) in 2010, although the EUR 31.1 thousand average for consumer electronics was below the manufacturing average (EUR 35.8 thousand).
Analysis of apparent labour productivity and wage-adjusted labour productivity ratios for the computer, electronic and optical products manufacturing subsectors is hampered by the lack of 2010 data for two of the largest subsectors; note the difficulty of comparing 2009 values with those from 2010 due to the impact of the financial and economic crisis. Among the six subsectors for which EU-27 wage-adjusted labour productivity ratios are available for 2010, four recorded ratios that were above the manufacturing average (148.0 %), while the ratio for magnetic and optical media manufacturing (121.2 %) and measuring instruments manufacturing (140.0 %) were below. For the two subsectors for which 2010 data are not available, EU-27 wage-adjusted labour productivity ratios for 2009 were very different, ranging from 110.0 % for communication equipment manufacturing to 158.6 % for the manufacture of irradiation, electromedical and electrotherapeutic equipment.
Country analysis
Within the EU-27’s computer, electronic and optical products manufacturing sector the largest Member States in 2010 (in value added terms) were Germany (29.6 % of the EU-27 total), the United Kingdom (13.5 %) and France (12.6 %). All three of these Member States recorded a larger share of the EU-27’s total value added in this sector than they did for manufacturing as a whole, a situation that was also true in some of the smaller Member States, most notably Finland, Ireland, Sweden, Slovakia and Hungary. Finland’s 4.0 % share of the EU-27 total was its second largest share among all of the NACE divisions within the non-financial business economy in 2010, while Sweden’s 6.2 % share was its third largest.
In 2010, Germany was the Member State that recorded the highest level of value added for six of the eight computer, electronic and optical products manufacturing subsectors, with its highest share of EU-27 value added recorded for optical instruments and photographic equipment manufacturing (68.7 %). The United Kingdom was largest producer for consumer electronics manufacturing (37.2 % of the EU-27 total), while Finland was largest producer for communication equipment manufacturing — see Table 3.
In value added terms, Finland was the most specialised EU Member State in the computer, electronic and optical products manufacturing sector in 2010, as it generated 3.7 % of its non-financial business economy value added in this sector. Ireland (3.6 %) and Hungary (3.1 %) were the next most specialised Member States, followed by Slovakia (2.7 %) and Sweden (2.6 %). Switzerland was also very specialised in this sector, as it generated 5.5 % of its non-financial business economy value added from the manufacture of computers, electronics and optical products, a higher share than recorded for any of the EU Member States.
At a more detailed level, Finland was particularly specialised in the communications equipment manufacturing subsector. Ireland was highly specialised in the manufacture of computers and peripheral equipment and the manufacture of electronic components and boards. Hungary was the second most specialised EU Member State in the communications equipment manufacturing subsector and the computers and peripheral equipment subsector. Slovakia stood out for the manufacture of consumer electronics, where it generated 1.8 % of its non-financial business economy value added in 2010, around 20 times as much as the EU-27 average. Switzerland’s high specialisation was largely due to its particularly high specialisation in measuring instruments manufacturing (which includes the manufacture of watches and clocks) as well as in the manufacture of irradiation, electromedical and electrotherapeutic equipment.
The productivity and profitability of the computer, electronic and optical products manufacturing sector varied greatly between EU Member States in 2010. The wage-adjusted labour productivity ratio reached in excess of 200 % in seven Member States, and topped 300 % in Ireland, Slovakia and Cyprus (2009 data). In most Member States, wage-adjusted labour productivity ratios for the computer, electronic and optical products manufacturing sector were above national non-financial business economy averages, greatly so in Slovakia and Ireland. By contrast, France recorded the lowest wage-adjusted labour productivity ratio in this sector, at 108.1 %, some way below the next lowest ratio of 129.3 % for the Czech Republic. The Czech Republic (2.1 %) and France (2.3 %) also recorded the lowest gross operating rates for the computer, electronic and optical products manufacturing sector in 2010, with Finland (2.4 %) also recording a relatively low rate. At the other end of the ranking, there were 12 Member States that recorded gross operating rates in excess of 10.0 %, as did Switzerland. The highest levels of operating profitability (on this basis) were recorded in the United Kingdom (23.7 %) and Ireland (21.0 %).
Size class analysis
Large enterprises (employing 250 or more persons) contributed 62.5 % of the value added generated in the EU-27’s computer, electronic and optical products manufacturing sector in 2010, which was above the average contribution of large enterprises to the value added generated within the whole of the non-financial business economy (42.3 %) or the manufacturing (55.5 %) sector. In a similar vein, large enterprises employed 54.2 % of the computer, electronic and optical products manufacturing workforce, which was even higher than the share of large enterprises in the non-financial business economy (32.5 %) and manufacturing (40.0 %) workforces.
In 13 of the 21 Member States for which sufficient data are available (as well as in Switzerland) more than half of the value added in the computer, electronic and optical products manufacturing sector in 2010 stemmed from large enterprises, with this share exceeding three quarters in Poland and Ireland and reaching 85.3 % in Hungary and 87.3 % in Slovakia. Large enterprises contributed less than two fifths of sectoral value added in five of the Member States, among which figured Cyprus (2009 data) and Latvia where there were no large enterprises. In Latvia, medium-sized enterprises (employing 50 to 249 persons) were dominant, accounting for 80.8 % of the value added that was generated in 2010, while in Lithuania medium-sized enterprises also generated more than three fifths of sectoral value added. The contribution of micro enterprises (employing fewer than 10 persons) to the computer, electronic and optical products manufacturing sector’s output rarely passed one tenth, while that of small enterprises (employing 50 to 249 persons) only passed one fifth of the total in Spain and the Netherlands.
Data sources and availability
The analysis presented in this article is based on the main dataset for structural business statistics (SBS) and size class data, all of which are published annually.
The main series provides information for each EU Member State as well as a number of non-member countries at a detailed level according to the activity classification NACE. Data are available for a wide range of variables.
In structural business statistics, size classes are generally defined by the number of persons employed. A limited set of the standard structural business statistics variables (for example, the number of enterprises, turnover, persons employed and value added) are analysed by size class, mostly down to the three-digit (group) level of NACE. The main size classes used in this article for presenting the results are:
- small and medium-sized enterprises (SMEs): with 1 to 249 persons employed, further divided into;
- micro enterprises: with less than 10 persons employed;
- small enterprises: with 10 to 49 persons employed;
- medium-sized enterprises: with 50 to 249 persons employed;
- large enterprises: with 250 or more persons employed.
Context
This article presents an overview of statistics for the computer, electronic and optical products manufacturing sector in the EU, as covered by NACE Rev. 2 Division 26. This division includes the manufacture of computers, computer peripherals, communications equipment, and similar electronic products, as well as the manufacture of components for such products; computers can be analogue, digital, or hybrid. Peripherals include, for example, printers, monitors, keyboards, mice, joysticks and projectors.
Telephone and data communications equipment are used to move signals electronically over wires or through the air such as radio and television broadcast and wireless communications equipment. Included are central office switching equipment, private branch exchange (PBX) equipment, telephones, bridges, routers, and gateways, antenna, pagers, mobile communications equipment, studio and broadcasting equipment, modems, transmitters, and remote controls.
The manufacture of consumer electronics includes household products such as televisions, audio recording and duplicating systems, stereo equipment, radio receivers, CD and DVD players, and video game consoles.
Measuring, testing and navigating equipment includes equipment for industrial and non-industrial purposes, including time-based measuring devices such as watches and clocks and related devices.
Irradiation, electromedical and electrotherapeutic equipment includes industrial, medical diagnostic, medical therapeutic, research and scientific equipment, such as X-ray equipment, magnetic resonance imaging (MRI) equipment, medical lasers, pacemakers and hearing equipment.
Optical instruments and lenses include binoculars, microscopes (except electron, proton), telescopes, prisms, lenses (except ophthalmic) and photographic equipment such as cameras and light meters.
The manufacture of magnetic and optical recording media includes blank magnetic audio and video tapes and cassettes, blank diskettes, blank optical discs and hard drive media.
Production processes of this division are characterised by the design and use of integrated circuits and the application of highly specialised miniaturisation technologies.
This NACE division is composed of eight groups:
- the manufacture of electronic components and boards (Group 26.1);
- the manufacture of computers and peripheral equipment (Group 26.2);
- the manufacture of communication equipment (Group 26.3);
- the manufacture of consumer electronics (Group 26.4);
- the manufacture of instruments and appliances for measuring, testing and navigation; watches and clocks (Group 26.5);
- the manufacture of irradiation, electromedical and electrotherapeutic equipment (Group 26.6);
- the manufacture of optical instruments and photographic equipment (Group 26.7);
- the manufacture of magnetic and optical media (Group 26.8).
Excluded are the reproduction of recorded media (part of printing and reproduction of recorded media, Division 18), the production of electrical relays and wiring devices (part of the manufacture of electrical equipment, Division 27) and ophthalmic goods (classified as part of other manufacturing, Division 32).
See also
- Manufacturing
- Other analyses of the business economy by NACE Rev. 2 sector
- Structural business statistics introduced
Further Eurostat information
Publications
- European business - facts and figures (online publication)
- Key figures on European Business – with a special feature section on SMEs – 2011 edition
Main tables
Database
- SBS - industry and construction (sbs_ind_co)
- Annual detailed enterprise statistics - industry and construction (sbs_na_ind)
- Annual detailed enterprise statistics for industry (NACE Rev. 2 B-E) (sbs_na_ind_r2)
- SMEs - Annual enterprise statistics by size class - industry and construction (sbs_sc_ind)
- Industry by employment size class (NACE Rev. 2 B-E) (sbs_sc_ind_r2)
- Annual detailed enterprise statistics - industry and construction (sbs_na_ind)
- SBS - regional data - all activities (sbs_r)
- SBS data by NUTS 2 regions and NACE Rev. 2, from 2008 onwards (sbs_r_nuts06_r2)
Dedicated section
Source data for tables and figures (MS Excel)
Other information
- Decision 1578/2007/EC of 11 December 2007 on the Community Statistical Programme 2008 to 2012
- Regulation 295/2008 of 11 March 2008 concerning structural business statistics